NEW
New Highs-Lows AMEX-Buschi
English:
This indicator shows the AMEX's up volume (green) and down volume (red).
Extreme trading days with more than 90 % up or down volume are marked via lines (theoretically values) and triangles (breaches).
Deutsch:
Dieser Indikator zeigt das Aufwärts- (grün) und Abwärts-Volumen (rot) der AMEX.
Extreme Handelstage mit mehr als 90 % Aufwärts- oder Abwärts-Volumen ist gekennzeichnet über Linien (theoretische Werte) und Dreiecke (Überschreitungen).
New Highs-Lows NASDAQ-Buschi
English:
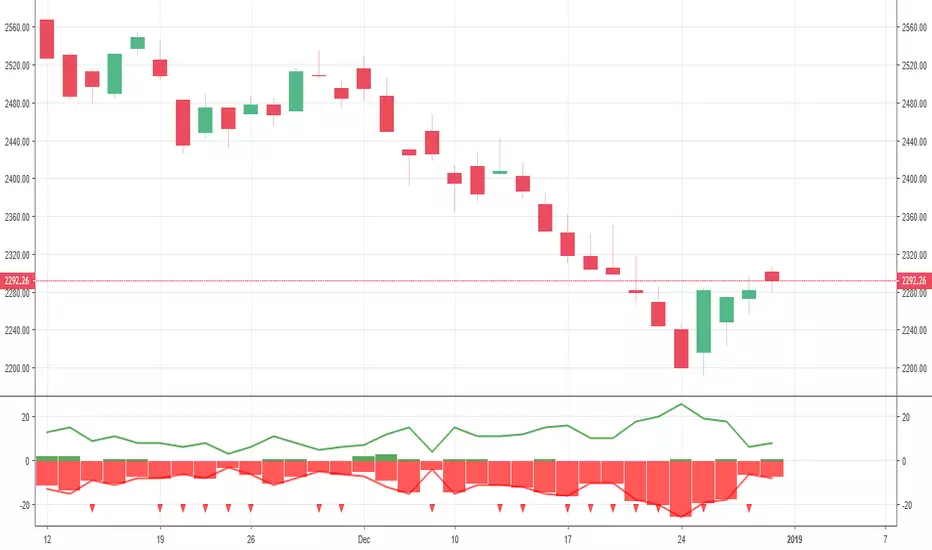
This indicator shows the NASDAQ's new highs (green) and new lows (red).
Extreme trading days with more than 99 % new highs relative to new lows vice versa are marked via lines (theoretically values) and triangles (breaches).
Deutsch:
Dieser Indikator zeigt die neuen Hochs (grün) und neuen Tiefs (rot) der NASDAQ.
Extreme Handelstage mit mehr als 99 % neuen Hochs relativ zu den neuen Tiefs und andersherum sind gekennzeichnet über Linien (theoretische Werte) und Dreiecke (Überschreitungen).
New Highs-Lows NYSE-Buschi
English:
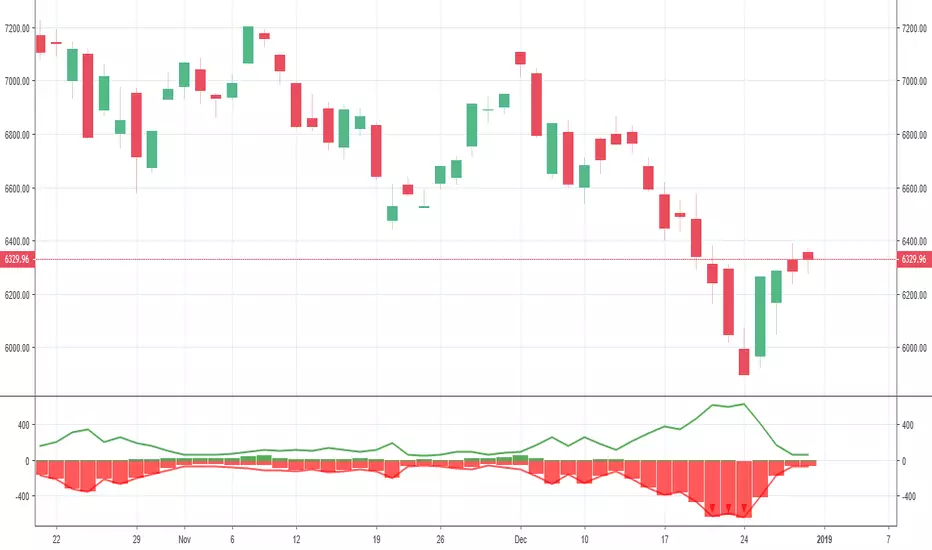
This indicator shows the NYSE's new highs (green) and new lows (red).
Extreme trading days with more than 99 % new highs relative to new lows vice versa are marked via lines (theoretically values) and triangles (breaches).
Deutsch:
Dieser Indikator zeigt die neuen Hochs (grün) und neuen Tiefs (rot) der NYSE.
Extreme Handelstage mit mehr als 99 % neuen Hochs relativ zu den neuen Tiefs und andersherum sind gekennzeichnet über Linien (theoretische Werte) und Dreiecke (Überschreitungen).

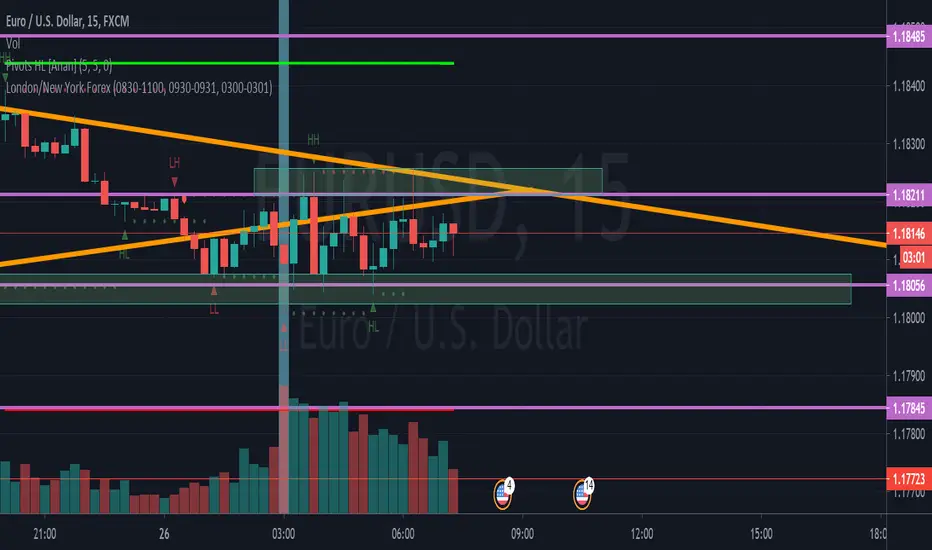
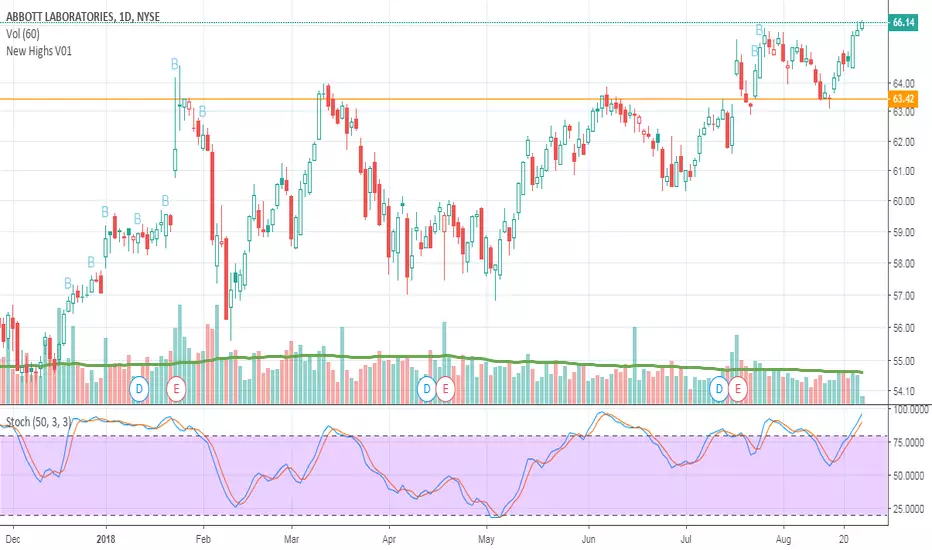
New Highs V01Script is meant for finding stocks in new uptrends and has had a pullback. Looking for support confirmation before going long. My first script.
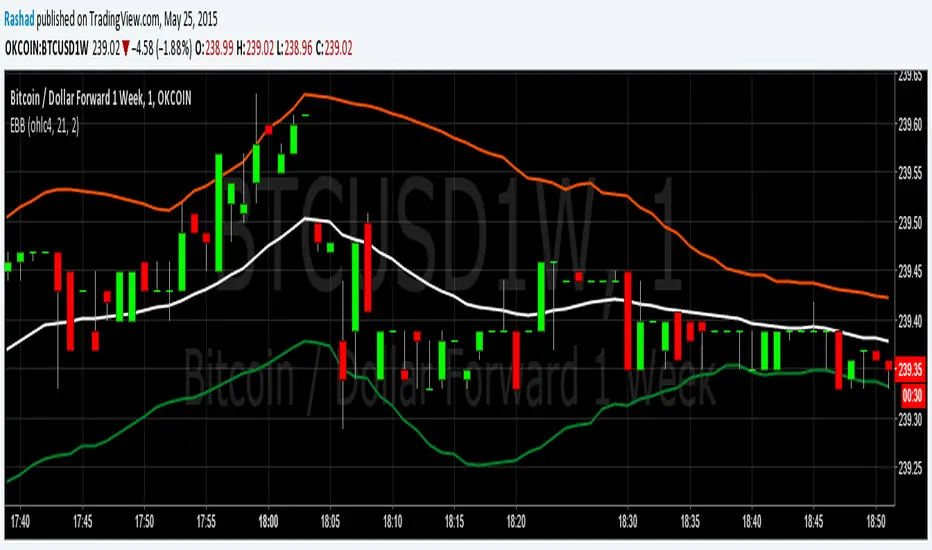
Exponential Bollinger BandsThese Bollinger Bands are exponential because the variance is calculated using the exponential moving average, rather than just adding the normal standard deviation to the ema. This may be more useful because the exponential standard deviation should be more sensitive to near term increases or decreases in volatility.
Please do not forget that Bollinger Bands should always be combined with another method of analysis. Bollinger Bands just provide an easy way to gauge where the price could range in. At 2 standard deviations of a continuously random variable, more than 98% of data points are in this range. I am however going to test this in excel to get the average number of data points that stay in the range for Bitcoin. I will upload my findings when I complete that. Please monitor this description if your interested.