ORB Pro w/ Filters + Debug + ORB Fib + Golden Pocket + HTF Trend🚀 ORB Pro – Advanced Opening Range Breakout System
A professional ORB indicator with built-in filters, retest confirmation, EMA/HTF trend alignment, and automatic risk/reward targets. Designed to eliminate false breakouts and give traders clean LONG/SHORT signals with Fibonacci and debug overlays for maximum precision.
This script is an advanced Opening Range Breakout (ORB) system designed for futures, indices, and options traders who want more precision, cleaner entries, and higher win probability. It combines classic ORB logic with modern filters, Fibonacci confluence, and higher-timeframe trend confirmation.
The indicator automatically:
Plots the ORB box based on user-defined NY session times (default: 9:30–9:45 EST).
Generates long/short signals when price breaks the ORB range, with optional conditions like:
Candle close outside the range
Retest confirmation (with tolerance %)
Volume spike validation
EMA trend alignment
Higher-timeframe EMA slope alignment
Cooldown filters to prevent over-trading
Integrates Fibonacci retracements & extensions from the ORB box for confluence levels.
Includes Golden Pocket (0.5–0.618) retests for precision entries
Risk/Reward visualization — automatically plots stop loss and take profit levels based on user-defined R:R or fixed % levels.
Debug mode overlay to show why a signal is blocked (e.g., low volume, ORB too small, too late, wrong trend).
This tool is built for scalpers, day traders, and 0DTE options traders who need both flexibility and discipline.
⚙️ Inputs & Features
ORB Settings
ORB Start & End Time (NY) → Default: 9:30–9:45
Require Candle Close → Ensures breakouts are confirmed, not wick traps.
Retest Confirmation → Optional retest before entry (tolerance % adjustable).
Filters
Volume Spike → Validates breakouts only with above-average volume.
EMA Trend Filter → Confirms trade direction with EMA slope.
Higher Timeframe Trend → Optional (e.g., 15m ORB with 1h EMA alignment).
Cooldown Bars → Prevents consecutive false signals.
ORB Size Filter → Blocks signals when ORB is too small/too large.
Fibonacci Levels
Retracements: 0.236, 0.382, 0.5, 0.618, 0.786
Extensions: 1.272, 1.618
Golden Pocket Retest filter for high-probability trades
Risk Management
R:R Stops/Targets → Automatically plots SL/TP levels.
Custom Stop % / Take Profit % if not using R:R
Debug Overlay → Explains why signals are blocked
🧑💻 How to Use
Load the indicator on your chart (works best on 1m, 5m, and 15m).
Adjust ORB window (default 9:30–9:45 EST).
Select filters (candle close, retest, volume, EMA, HTF trend).
Watch for Long/Short labels outside ORB box with filters aligned.
Manage trades using plotted SL/TP levels or your own Webull/R:R calculator.
✅ Best Use Cases
Futures (NQ1!, ES1!)
ETFs (QQQ, SPY, IWM)
0DTE Options Trading
Scalping around market open
⚠️ Disclaimer
This tool is for educational purposes only. It does not constitute financial advice. Trading carries risk, and past performance does not guarantee future results. Always test on paper trading before using real capital.
-----------------------------------------
ORB Pro w/ Filters + Debug + ORB Fib + Golden Pocket + HTF Trend
A professional Opening Range Breakout (ORB) toolkit designed for intraday traders who want precision entries, risk-managed exits, and layered confirmation filters. Built for futures, stocks, and ETFs (e.g. NQ, ES, QQQ).
🔎 Core Logic
This script plots and trades breakouts from the Opening Range (9:30 – 9:45 NY time), then applies multiple confirmation filters before signaling a LONG or SHORT setup:
ORB Box: Defines the first 15 minutes of market activity (customizable).
Breakout Candle Confirmation: Requires a candle close outside the ORB box.
Retest Confirmation: Price must retest the ORB edge within tolerance before triggering.
Trend Filter: EMA confirmation to align trades with intraday trend.
Higher-Timeframe Trend Filter: Optional (default: 45-minute EMA) to avoid countertrend trades.
Fibonacci Levels: Auto-plot retracements (0.236 → 0.786) for confluence and trade management.
Golden Pocket Retest (Optional): Adds an extra precision filter at 0.5–0.618 retracement.
⚙️ Default Settings (Optimized for Beginners)
These are the pre-configured inputs so traders can load and trade immediately:
ORB Session: 9:30 – 9:45 NY
✅ Require Candle Close Outside ORB
✅ Require Retest Confirmation (tolerance 0.333%)
❌ Require Volume Spike (off by default, optional toggle)
✅ Require EMA Trend (50 EMA intraday)
✅ Require Higher-TF Trend (45m, EMA 21)
❌ Higher-TF EMA slope required (off)
✅ Cooldown Between Signals (10 bars)
ORB % Range: Min 0.3%, Max 0.5%
Max Minutes After ORB: 180
✅ ORB-based Risk/Reward Stops & Targets (default: 2R)
Stop Loss: 0.5% (if not R:R)
Take Profit: 1% (if not R:R)
✅ Debug Overlay (shows why signals are blocked)
✅ Fibonacci Retracements Plotted
❌ Extensions (off by default, toggle if needed)
✅ Golden Pocket Retest available, tolerance 0.11 (optional)
📈 Signals
Green "LONG" Label: Valid breakout above ORB with trend confirmation.
Red "SHORT" Label: Valid breakdown below ORB with trend confirmation.
Blocked (debug text): Signal suppressed by filters (low volume, too late, no retest, etc.).
🎯 Trade Management
Default R:R is 2:1 (stop at ORB edge, TP projected).
For manual trading (e.g., Webull, IBKR), you can use the plotted TP/SL boxes directly.
Fibonacci + Golden Pocket give additional profit-taking levels and retest filters.
✅ Best Practices
Use 15m chart for main ORB entries.
Confirm direction with HTF trend (45m EMA by default).
Avoid signals blocked by “Low Volume” or “Too Late” (debug helps identify).
Adjust ORB % range for asset volatility (tight for ETFs, wider for futures).
🚀 Why ORB Pro?
This is more than a standard ORB indicator. It’s a professional breakout system with filters designed to avoid false breakouts, automatically handle risk/reward, and guide traders with clear visual signals. Perfect for both systematic day traders and discretionary scalpers who want structure and confidence.
👉 Recommended starting point:
Load defaults → trade the 15m ORB with EMA + HTF filters on → let the script handle retests and stop/target placement.
Nasdaq100
Nasdaq DowJones STOCH+RSIAlternative & UPDATED version of my previous indicator for spread trading.
This indicator can work pretty well also with other indices or correlated assets such as nasdaq100 and dax40.
The spikes from one side of the channel or the orizzontal lines signal a possible entry signal for a spread trading strategy.
Price Pivots for NASDQ 100 StocksPrice Pivots for NASDQ 100 Stocks
What is this Indicator?
• This indicator calculates the price range a Stock can move in a Day.
Advantages of this Indicator
• This is a Leading indicator, not Dynamic or Repaint.
• Helps to identify the tight range of price movement.
• Can easily identify the Options strike price.
• Develops a discipline in placing Targets.
Disadvantages of this Indicator
• The indicator is specifically made for NASDQ 100 stocks. The levels won't work for other stocks.
• The indicator shows nothing for other indexes and stocks other than above mentioned.
• The data need to be entered manually.
Who to use?
Highly beneficial for Day Traders, it can be used for Swing and Positions as well.
What timeframe to use?
• Any timeframe.
• The highlighted levels in Red and Green will not show correct levels in 1 minute timeframe.
• 5min is recommended for Day Traders.
When to use?
• Wait for proper swing to form.
• Recommended to avoid 1st 1 hour or market open, that is 9.15am to 10.15 or 10.30am.
• Within this time a proper swing will be formed.
What are the Lines?
• The concept is the price will move from one pivot to another.
• Entry and Exit can be these levels as Reversal or Retracement.
Gray Lines:
• Every lines with price labels are the Strike Prices in the Option Chain.
• Price moves from 1 Strike Price level to another.
• The dashed lines are average levels of 2 Strike Prices.
Red & Green Lines:
• The Red and Green Lines will appear only after the first 1 hour.
• The levels are calculated based on the 1st 1 hour.
• Red Lines are important Resistance levels, these are strong Bearish reversal points. It is also a breakout level, this need to be figured out from the past levels, trend, percentage change and consolidation.
• Green Lines are important Support levels, these are strong Bullish reversal points. It is also a breakdown level, this need to be figured out from the past levels, trend, percentage change and consolidation.
What are the Labels?
• First Number: Price of that level.
• Numbers in (): Percentage change and Change of price from LTP (Last Traded Price) to that Level.
How to use?
Entry:
• Enter when price is closer to the Red or Green lines.
• Enter after considering previous Swing and Trend.
• Note the 50% of previous Swing.
• Enter Short when price reverse from each level.
• If 50% of swing and the pivot level is closer it can be a good entry.
Exit:
• Use the logic of Entry, each level can be a target.
• Exit when price is closer to the Red or Green lines.
Indicator Menu
Source
• Custom: Enter the price manually after choosing the Source as Custom to show the Pivots at that price.
• LTP: Pivot is calculated based on Last Traded Price.
• Day Open: Pivot is calculated based on current day opening price.
• PD Close: Pivot is calculated based on previous day closing price.
• PD HL2: Pivot is calculated based on previous day average of High and Low.
• PD HLC3: Pivot is calculated based on previous day average of High, Low and Close.
"Time (Vertical Lines)"
• This is a marker of every 1 hour.
• Usually major price movement happen between previous day last 1 hour to today first 1 hour.
• Two swings can happen between first 2 hour of current day.
• At the end of the day last 1 hour another important movement will happen.
• Usually rest of the time won't show any interesting movement.
To the Users
• Certain symbols may show the levels as a single line. For such symbols choose a different Source or Timeframe from the indicator menu.
• Please inform if any of the Symbol's price levels don't react to the pivots , include the Symbol a well.
• Also inform if you notice any wrong values, errors or abnormal behavior in the indicator.
• Feel free to suggest or adding new features and options.
General Tips
• It is good if Stock trend is same as that of Index trend.
• Lots of indicators creates lots of confusion.
• Keep the chart simple and clean.
• Buy Low and Sell High.
• Master averages or 50%.
• Previous Swing High and Swing Low are crucial.
Important Note
• Currently the levels are in testing stage.
• Eventually the levels of certain symbols will be corrected after each update and test.
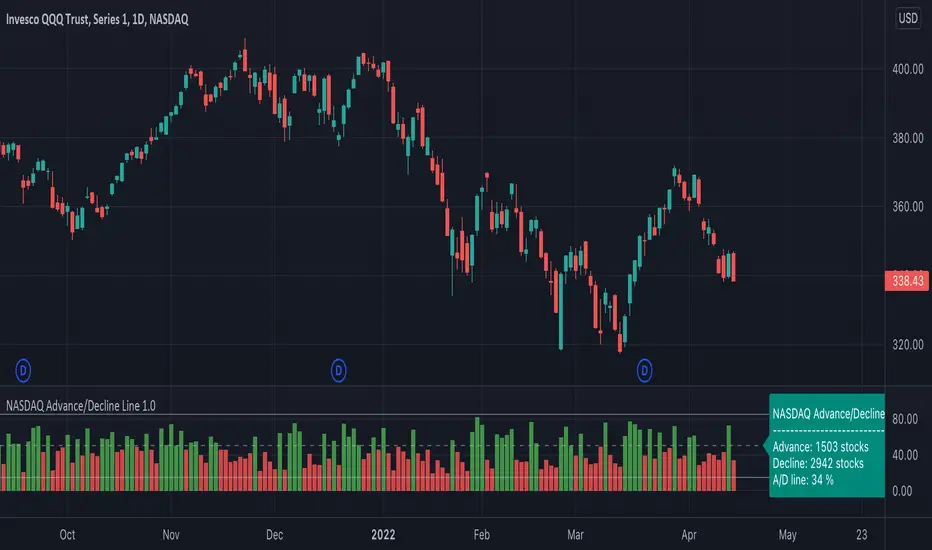
NASDAQ Advance/Decline Line 1.0NASDAQ Advance/Decline Line is a Market Breath indicator.
Brought to you by IQ-trading (Andrei Bogdan) via Trading View Pine script. If you find this helpful in anyway, please leave a like!
A/D line calculates a ratio between total number of NASDAQ stocks advancing and total number of NASDAQ stocks in one day, providing another way to grasp the market breath at any moment.A
Green columns mean more than 50% of NASDAQ stocks are advancing, red columns mean more than 50% of NASDAQ stocks are declining.
Green values above the top band mean correlation to the upside, red values bellow the low band mean correlation to the downside.
Correlation means rising probability of capitulation (to the upside or to the downside).
For a better interpretation, NASDAQ Advance/Decline Line should be used in conjunction with other indicators (volatility, volume, etc.).
--------------------
NASDAQ here refers to the totality of assets listed on the NASDAQ exchange, not to the Nasdaq Composite index or the Nasdaq100 index.
NASDAQ is the second-largest stock exchange on earth, and operates the two major stock indexes based on companies that trade on its exchange: the Nasdaq Composite and the Nasdaq 100.
The Nasdaq Composite tracks the performance of more than 3,000 stocks listed on the Nasdaq while the Nasdaq 100 captures the performance of the exchange’s largest non-financial companies.
no diceAllow this strategy to run on it's own and try not to get your emotions involved by manually closing positions. Let the strategy do all the work and you will see good returns every month.