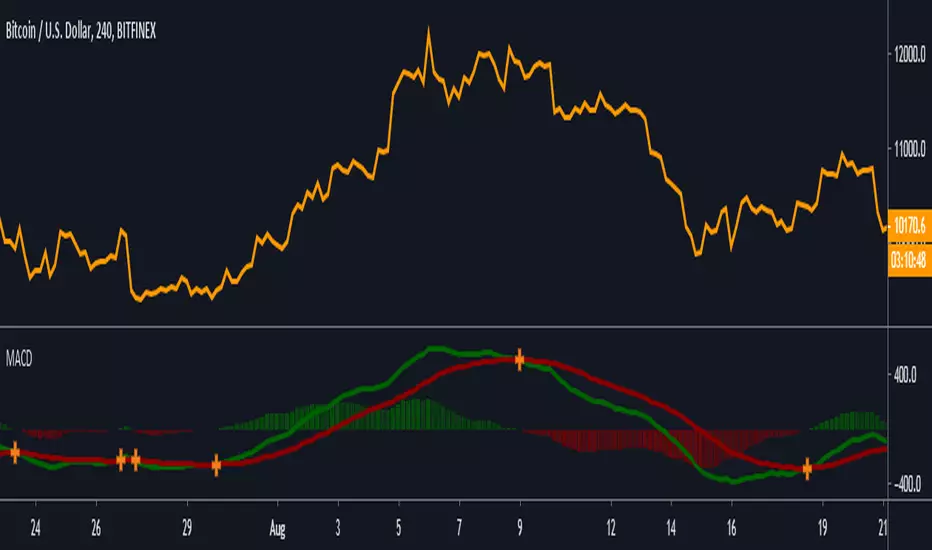
MACD [Gu5]Extremely popular indicator MACD (Moving Average Convergence/Divergence)
Same design of my previous indicators
Show Cross Line for a better visualization
```
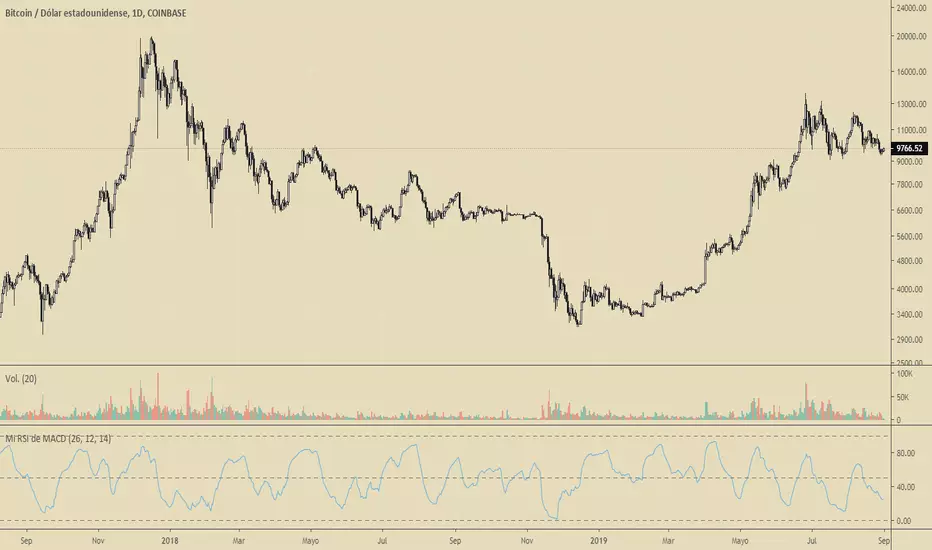
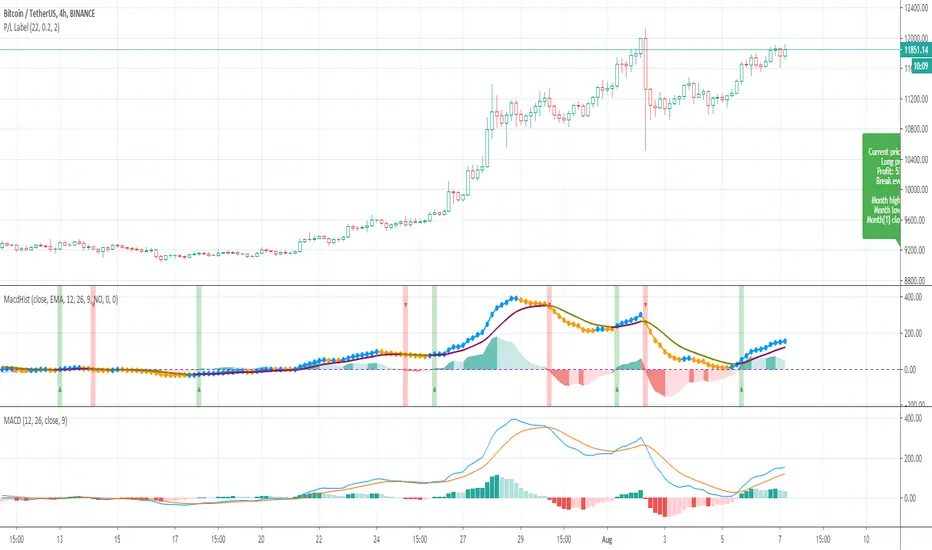
Setting recommended for BTC
"Fast Length" = 21
"Slow Length" = 55
"Signal Smoothing" = 14
Other markets try
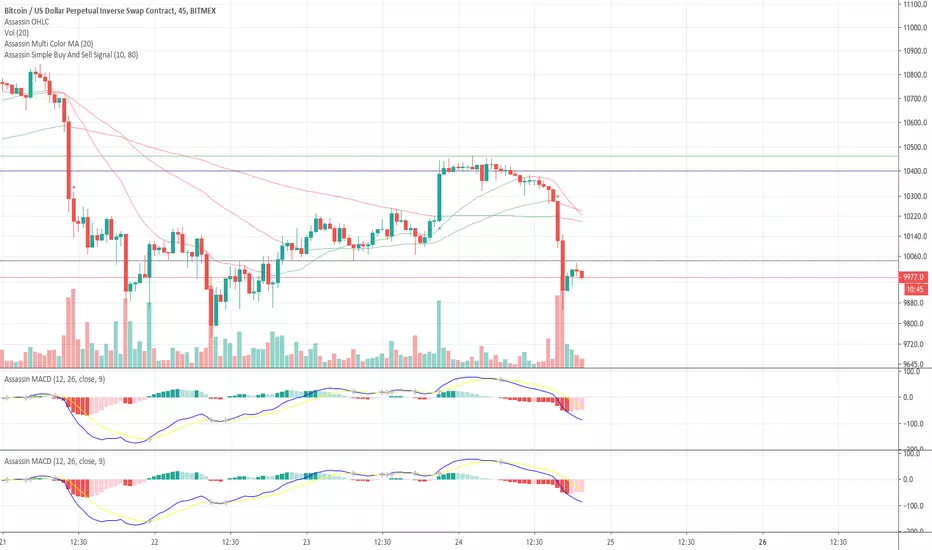
"Fast Length" = 12
"Slow Length" = 26
"Signal Smoothing" = 9
```
--
El MACD (Convergencia/Divergencia de Medias Móviles) es uno de los mas populares indicadores
Continuando con el mismo estilo de diseño de mis anteriores indicadores
Destaca el cruce de medias para una mejor visualización
Indicador Pine Script®