Dynamic Trend Fusion (DTF)The "Dynamic Trend Fusion" (DTF) indicator is a powerful technical analysis tool for traders. It stands out from other indicators due to its adaptability and ability to provide insights into different trading styles. Users can choose from various trading options such as "Short-term Trading," "Long-term Trading," "Aggressive Short-term," "Conservative Long-term," "Balanced Approach," "High Sensitivity," "Low Sensitivity," "Day Trading," and "Swing Trading." These options allow traders to customize the indicator to suit their specific trading strategies.
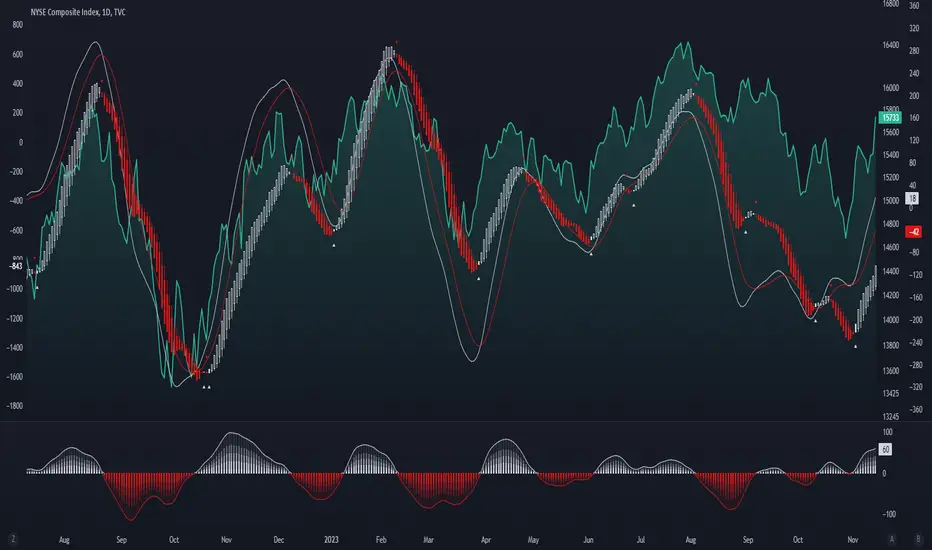
DTF combines the Moving Average Convergence Divergence (MACD) and Relative Strength Index (RSI) indicators, normalizing them to a similar scale for a comprehensive view of market conditions. It then calculates a combined value and smoothes it using a moving average.
One of its standout features is the ability to identify bullish and bearish states, which is represented visually on the chart. When the indicator detects a transition from a bullish to a bearish state or vice versa, the color of the line changes.
Additionally, DTF offers alert conditions, notifying users when the market shifts into a bullish or bearish state, allowing for timely decision-making.
In summary, the DTF indicator sets itself apart by providing traders with a versatile tool that can be tailored to various trading styles and offers clear visual signals for trend changes, enhancing trading precision and efficiency.
Indicador Pine Script®