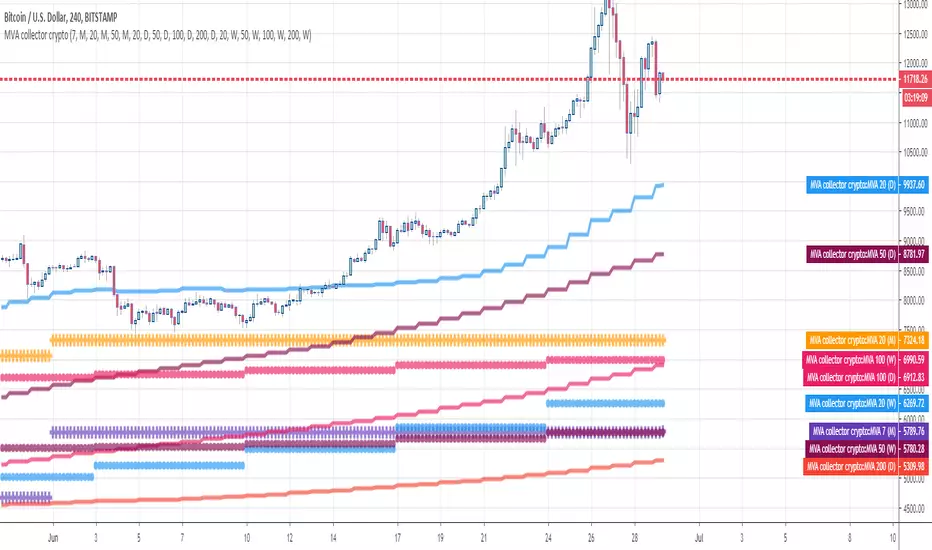
MVA collector cryptoHello Traders This indicator draw multiple Simple Moving Averages multi-timeframes at once I use it to define take profit zones for my crypto trading Hope you'll like it Enjoy Dave Indicador Pine Script®por Daveatt53
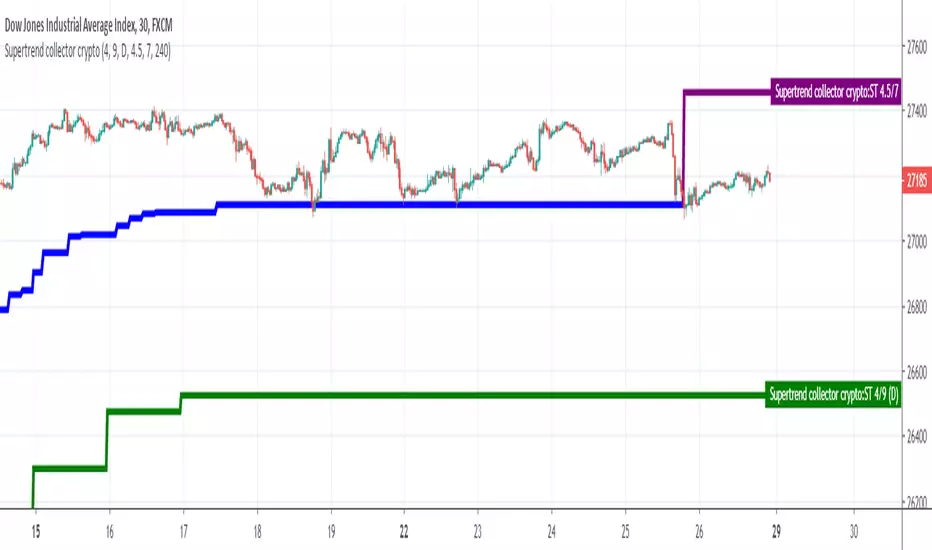
Supertrend collectorHello traders This is an example of how you can add multiple indicators into a unique one In this instance, I added two supertrend multitimeframes and draw them on a different timeframe chart Enjoy DavidIndicador Pine Script®por DaveattAtualizado 1111602
[feeble] TrenderEver wondered which way the price is trending?! feeble Trender™ **BETA** shows the trend based on middle crossings in different timeframes, volume weighting and volatility (std Deviations) --The indicator displays the same on any timeframe. --Select a FROM and TO period --Use DuPLiCaToR to make 12 copies - use values between 0.8-1.2 --Coloured bands go purple when price is below the volume-weighted mIdBaNd! --Shows the trend on a few different scales!!Indicador Pine Script®por gamazama74
Multi Time Moving Averageпозволяет выбрать в настройках 2 таймфрейма и 4 МА с разными периодами и отображать выбранные индикаторы на графиках с любым выбранным таймфреймом Indicador Pine Script®por taifunixAtualizado 33478
MTF candles by yatrader2Get higher time frame candles overlaid on a lower timeframe chart. Add 1H candles on 1M or 1D on 30M Overlaid candles feature wicks and multiple display options to customize appearance. Add the indicator multiple times to get MTF (multiple time frames) all on one chart. Indicador Pine Script®por yatrader22020 3.7 K
Is Open equal to High or LowMany people are watching opening price on each time axis. Opening price is very important. This indicator displays OHLC Open as a line in multiple time frame. If open is close to high or low, the color of the line changes. The fact that they are close means the strength of the market flow and the firmness of that price range. Note: The color of the line will not be fixed until bar is closed. And when using, please set arbitrary coefficient according to each market. Coefficient e.g. EURUSD: 0.00005 BTCUSD: 1 DJI: 5 BTCJPY: 100 USDJPY: 0.01 NI225: 2Indicador Pine Script®por h2sa22263
9 x TimeFrames: MACD + Histogram, Logarithmic***Up to 9 MACD's with fixed timeframes*** -Simply enter your MACD settings, and which timeframes you would like to see. -Settings stick regardless of viewing resolution (within reason) -Enter 0 to disable if you want less than 9 MACD's ***Logarithmic option for consistency over long timeframes*** ***Layered histogram, can be disabled, adjusted vertically*** Indicador Pine Script®por gamazamaAtualizado 22156
Reverse Engineered RSI - Key Levels + MTFThis indicator overlays 5 Reverse Engineered RSI (RERSI) levels on your main chart window. The RERSI was first developed by Giorgos Siligardos in the June 2003 issue of Stocks and Commodities Magazine. HPotter provided the initial implementation - from which this script is derived - so all credit to them (see: ). In simple terms, RERSI plots lines on the price chart that reflect levels of the RSI . E.g. if you set up a RERSI line at a level of 50, then price will touch that line when the standard RSI indicator reads 50. Hopefully that makes sense, but compare the two if it doesn't. Why is the RERSI useful if it's just plotting RSI values? Well, it simplifies things, and enables you to get a clearer picture of trend direction, RSI support and resistance levels, RSI trading signals, and it keeps your chart window uncluttered. I've set up 5 RERSI lines to be plotted: Overbought and Oversold Levels, a Middle Level (generally leave this at 50), and then Down/Up Trend Lines. The latter two are loosely based on the work of Constance Brown (and they in turn were influenced by Andrew Brown), who posited that RSI doesn't breach certain levels during trends (e.g. 40-50 is often a support level during an uptrend). Play around with the levels, and the RSI Length, to see how your particular market reacts, and where key levels may lie. Remember, this isn't meant as a stand-alone system (although I think there's potential to use it as such, especially with price action trading - which I guess wouldn't make it stand-alone then!!), and works best with confirmation from other sources. Oh, and there's MTF capability, because I think that's useful for all indicators. Any queries, please let me know. Cheers, RJRIndicador Pine Script®por DreamsDefinedAtualizado 1010602
Multi Time Frame EMA 8,13,21,55,100,200Multi Time Frame EMA 8,13,21,55,100,200Indicador Pine Script®por Jordibes222
Bollinger/Donchian ChannelsProvides a blending of Bollinger Bands and Donchian Channels with shading criteria between.Indicador Pine Script®por mortdiggiddyAtualizado 77399