Improved Multi-Timeframe (MTF) 50 EMA - plots same as live dataThis multi-timeframe 50-period exponential moving average uses an improved calculation to accurately calculate the indicator's value with every new bar on the time frame your chart is set to. Previously the indicator only recalculated with every new update on the timeframe used in its security function. This means that this improved script plots the real, current value of your indicator across your chosen timeframes on your chart's resolution and no longer only plots only the indicator's monthly/weekly/daily/4 hour/ect closing value on the your chart.
Input values are fixed to their default (close,50) configuration to make this indicator's improved calculation possible.
When using "Plot Higher Timeframe?" the script will set the indicator to only plot its value in closest larger timeframe. This option overrides the two following options. For example, when using the daily resolution , only the weekly value will plot, or when using the one hour (60m) resolution, only the 4 hour (240m) value will plot.
The "Omit Higher Timeframes?" option will set the indicator to only plot starting from the 1/2/3/4/5/6/7th closest larger timeframe. For example, when using the daily resolution and this option set to 0, all values from the weekly resolution and up will plot, but if set to 1, all values from the monthly resolution and up will plot instead.
The "Plot Yearly/Quarterly/Monthly/Weekly/Daily/4 Hour/1 Hour/15 Minute/5 Minute?" options allow enabling/disabling a specific timeframe. All are enabled by default. For example, if you do not want the yearly value of the indicator to ever plot, you can disable the "Plot Yearly?" option.
Multi

Improved Multi-Timeframe (MTF) 21 EMA - plots same as live dataThis multi-timeframe 21-period exponential moving average uses an improved calculation to accurately calculate the indicator's value with every new bar on the time frame your chart is set to. Previously the indicator only recalculated with every new update on the timeframe used in its security function. This means that this improved script plots the real, current value of your indicator across your chosen timeframes on your chart's resolution and no longer only plots only the indicator's monthly/weekly/daily/4 hour/ect closing value on the your chart.
Input values are fixed to their default (close,21) configuration to make this indicator's improved calculation possible.
When using "Plot Higher Timeframe?" the script will set the indicator to only plot its value in closest larger timeframe. This option overrides the two following options. For example, when using the daily resolution, only the weekly value will plot, or when using the one hour (60m) resolution, only the 4 hour (240m) value will plot.
The "Omit Higher Timeframes?" option will set the indicator to only plot starting from the 1/2/3/4/5/6/7th closest larger timeframe. For example, when using the daily resolution and this option set to 0, all values from the weekly resolution and up will plot, but if set to 1, all values from the monthly resolution and up will plot instead.
The "Plot Yearly/Quarterly/Monthly/Weekly/Daily/4 Hour/1 Hour/15 Minute/5 Minute?" options allow enabling/disabling a specific timeframe. All are enabled by default. For example, if you do not want the yearly value of the indicator to ever plot, you can disable the "Plot Yearly?" option.

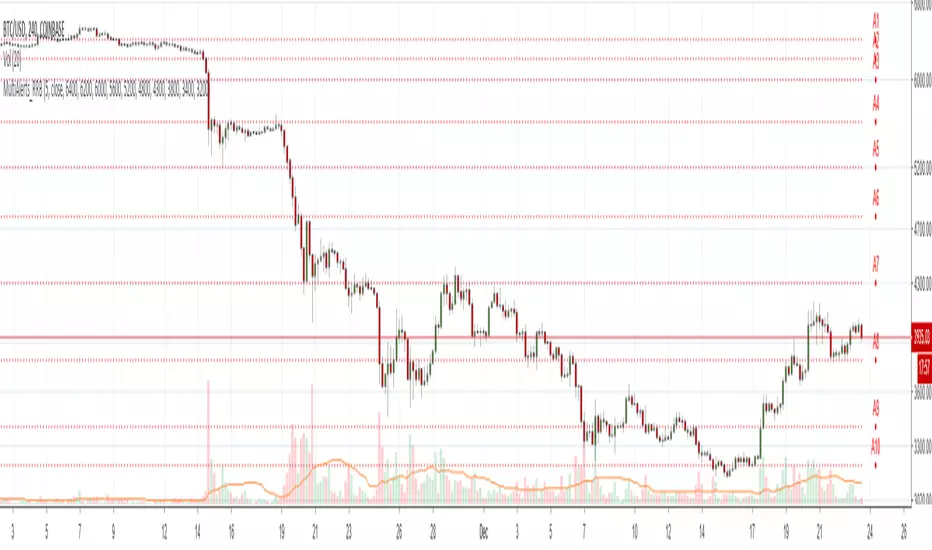
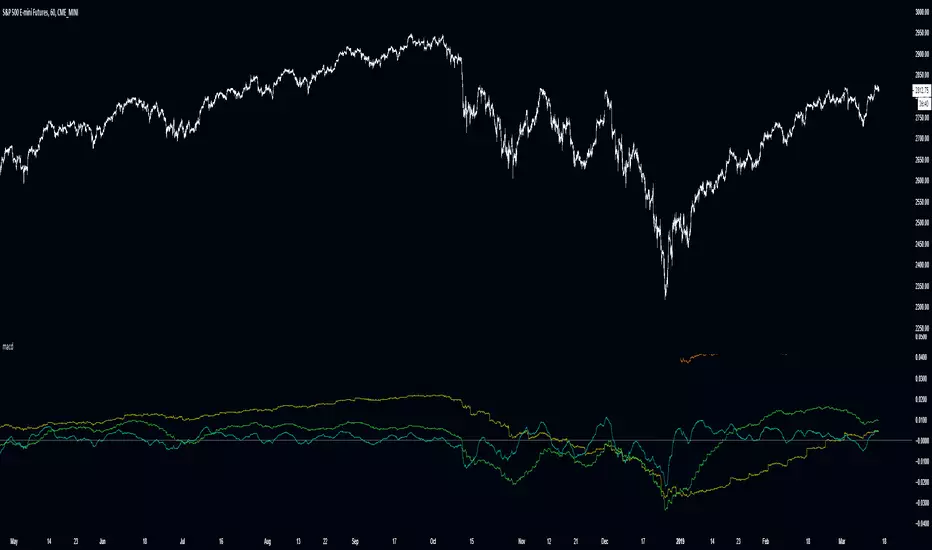
Improved Multi-Timeframe (MTF) MACD - plots same as live dataThis multi-timeframe MACD uses an improved calculation to accurately calculate the indicator's value with every new bar on the time frame your chart is set to. Previously the indicator only recalculated with every new update on the timeframe used in its security function. This means that this improved script plots the real, current value of your indicator across your chosen timeframes on your chart's resolution and no longer only plots only the indicator's monthly/weekly/daily/4 hour/ect closing value on the your chart.
Input values are fixed to their default (close,12,26) configuration to make this indicator's improved calculation possible.
When using "Plot Higher Timeframe?" the script will set the indicator to only plot its value in closest larger timeframe. This option overrides the two following options. For example, when using the daily resolution, only the weekly value will plot, or when using the one hour (60m) resolution, only the 4 hour (240m) value will plot.
The "Omit Higher Timeframes?" option will set the indicator to only plot starting from the 1/2/3/4/5/6/7th closest larger timeframe. For example, when using the daily resolution and this option set to 0, all values from the weekly resolution and up will plot, but if set to 1, all values from the monthly resolution and up will plot instead.
The "Plot Yearly/Quarterly/Monthly/Weekly/Daily/4 Hour/1 Hour/15 Minute/5 Minute?" options allow enabling/disabling a specific timeframe. All are enabled by default. For example, if you do not want the yearly value of the indicator to ever plot, you can disable the "Plot Yearly?" option.
Supertrend Multi Time Frame - Auto HTF calculationThere is already SuperTrend indicator and thanks to its developer.
This script draws supertrend for current and higher time frame, it automatically calculates higher time frame and you don't need to adjust it when you change the period.
it also change the color of bars according to current and HTF supertrend, so you can see the trend by looking at bars color.
Bar color is lime if trend is up and red if trend is down. but if you see white bars then there is movement opposite the main trend.
if you like it please comment.

Cuban's MTF FisherA multi-timeframe Fisher indicator that has been updated to Pine version 3, added linear regression and RMA lines with up down colour coding, alert conditions for ease and autoview automatic trading, and a few other little tricks.
This indicator will no longer repaint and will provide more accurate signals. I've also added a backtester to allow you to find something that works for you. Just search 'Cuban's MTF Fisher Backtester'.
If you would like any features added, DM me on Tradingview or Twitter.

High and Lows Multi-timeframeThis script displays highs and lows from higher timeframes into the chart. Recommended to use Weekly or more lines on smaller timeframe charts like the 5M charts.

Multi SMA EMA WMA HMA BB (4x5 MAs Bollinger Bands) Adv MTF - RRBMulti SMA EMA WMA HMA 4x5 Moving Averages with Bollinger Bands Advanced MTF by RagingRocketBull 2019
Version 1.0
This indicator shows multiple MAs of any type SMA EMA WMA HMA etc with BB and MTF support, can show MAs as dynamically moving levels.
There are 4 MA groups + 1 BB group, a total of 4 TFs * 5 MAs = 20 MAs. You can assign any type/timeframe combo to a group, for example:
- EMAs 12,26,50,100,200 x H1, H4, D1, W1 (4 TFs x 5 MAs x 1 type)
- EMAs 8,10,13,21,30,50,55,100,200,400 x M15, H1 (2 TFs x 10 MAs x 1 type)
- D1 EMAs and SMAs 8,10,12,26,30,50,55,100,200,400 (1 TF x 10 MAs x 2 types)
- H1 WMAs 7,77,89,167,231; H4 HMAs 12,26,50,100,200; D1 EMAs 89,144,169,233,377; W1 SMAs 12,26,50,100,200 (4 TFs x 5 MAs x 4 types)
- +1 extra MA type/timeframe for BB
There are several versions: Simple, MTF, Pro MTF, Advanced MTF and Ultimate MTF. This is the Advanced MTF version. The Differences are listed below. All versions have BB
- Simple: you have 2 groups of MAs that can be assigned any type (5+5)
- MTF: +2 custom Timeframes for each group (2x5 MTF) +1 TF for BB, TF XY smoothing
- Pro MTF: 4 custom Timeframes for each group (4x3 MTF), 1 TF for BB, MA levels and show max bars back options
- Advanced MTF: +2 extra MAs/group (4x5 MTF), custom Ticker/Symbols, Timeframe <>= filter, Remove Duplicates Option
- Ultimate MTF: +individual settings for each MA, custom Ticker/Symbols
Features:
- 4x5 = 20 MAs of any type
- 4x MTF groups with XY step line smoothing
- +1 extra TF/type for BB MAs
- 4x5 = 20 MA levels with adjustable group offsets, indents and shift
- supports any existing type of MA: SMA, EMA, WMA, Hull Moving Average (HMA)
- custom tickers/symbols for each group - you can compare MAs of the same symbol across exchanges
- show max bars back option
- show/hide both groups of MAs/levels/BB and individual MAs
- timeframe filter: show only MAs/Levels with TFs <>= Current TF
- hide MAs/Levels with duplicate TFs
- support for custom TFs that are not available in free accounts: 2D, 3D etc
- support for timeframes in H: H, 2H, 4H etc
Notes:
- Uses timeframe textbox instead of input resolution dropdown to allow for 240 120 and other custom TFs
- Uses symbol textbox instead of input symbol to avoid establishing multiple dummy security connections to the current ticker - otherwise empty symbols will prevent script from running
- Possible reasons for missing MAs on a chart:
- there may not be enough bars in history to start plotting it. For example, W1 EMA200 needs at least 200 bars on a weekly chart.
- price << default Y smoothing step 5. For charts with low/fractional prices (i.e. 0.00002 << 5) adjust X Y smoothing as needed (set Y = 0.0000001) or disable it completely (set X,Y to 0,0)
- TradingView Replay Mode UI and Pinescript security calls are limited to TFs >= D (D,2D,W,MN...) for free accounts
- attempting to plot any TF < D1 in Replay Mode will only result in straight lines, but all TFs will work properly in history and real-time modes. This is not a bug.
- Max Bars Back (num_bars) is limited to 5000 for free accounts (10000 for paid), will show error when exceeded. To plot on all available history set to 0 (default)
- Slow load/redraw times. This indicator becomes slower, its UI less responsive when:
- Pinescript Node.js graphics library is too slow and inefficient at plotting bars/objects in a browser window. Code optimization doesn't help much - the graphics engine is the main reason for general slowness.
- the chart has a long history (10000+ bars) in a browser's cache (you have scrolled back a couple of screens in a max zoom mode).
- Reload the page/Load a fresh chart and then apply the indicator or
- Switch to another Timeframe (old TF history will still remain in cache and that TF will be slow)
- in max possible zoom mode around 4500 bars can fit on 1 screen - this also slows down responsiveness. Reset Zoom level
- initial load and redraw times after a param change in UI also depend on TF. For example:
D1/W1 - 2 sec, H1/H4 - 5-6 sec, M30 - 10 sec, M15/M5 - 4 sec, M1 - 5 sec.
M30 usually has the longest history (up to 16000 bars) and W1 - the shortest (1000 bars).
- when indicator uses more MAs (plots) and timeframes it will redraw slower. Seems that up to 5 Timeframes is acceptable, but 6+ Timeframes can become very slow.
- show_last=last_bars plot limit doesn't affect load/redraw times, so it was removed from MA plot
- Max Bars Back (num_bars) default/custom set UI value doesn't seem to affect load/redraw times
- In max zoom mode all dynamic levels disappear (they behave like text)
1. based on 3EmaBB, uses plot*, barssince and security functions
2. you can't set certain constants from input due to Pinescript limitations - change the code as needed, recompile and use as a private version
3. Levels = trackprice implementation
4. Show Max Bars Back = show_last implementation
5. swma has a fixed length = 4, alma and linreg have additional offset and smoothing params
6. Smoothing is applied by default for visual aesthetics on MTF. To use exact ma mtf values (lines with stair stepping) - disable it
Good Luck! You can explore, modify/reuse the code to build your own indicators.

Multi SMA TimeframeIn this indicator, it is possible to see SMA 8 and SMA 20 of 1m, 3m, 5m and 15m, in the same chart.

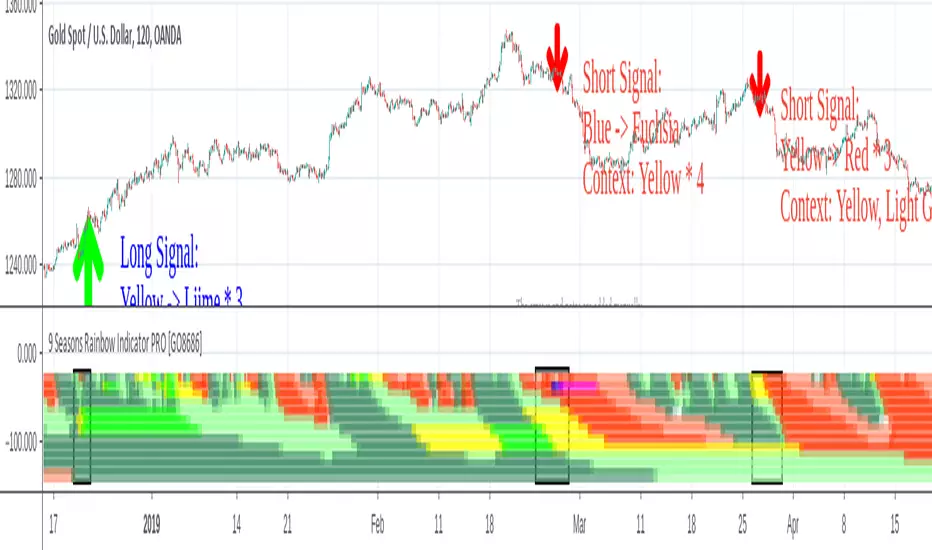
9 Seasons Rainbow Indicator PRO [GO8686]Trading on 5 minutes frame can be as reasonable as on 4H frame, use 9 Seasons Rainbow Indicator PRO for both.
5分钟维度的交易可以与4小时维度一样合理,请使用9季彩虹指标 PRO 。
Market is full of life, with seasons.
9 Seasons Rainbow Indicator displays 9 seasons of any trading instrument in multiple time frames, helping traders and investors understand the flow of price.
The combination of seasons in different time dimensions may give perfect trading signals, for instance: overbought in both small time frame and big time frame has high success probability of shorting trade.
Please install the indicator: Demo, PRO or STANDARD Version. Apply the indicator to your favorites trading instruments: indices, stocks, futures , forex or crypto currencies. Find your patterns that make money.
---------- 9 Seasons ----------
Bull(Green), evolves into BullRest, OverBought, Bear, or Neutral
Bull Rest(Light Green): a pullback or retracement, evolves into Bull or Bear
OverBought(Yellow): may have defined a top or resistance, can happen in range, evolves into CrazyBought or Bear
CrazyBought(Lime): going up in a high volatility , evolves into Bear, OverBought, or BullRest
Neutral(White): a wandering season without direction, evolves into Bull or Bear
Bear(Red), evolves into BearRest, OverSold, Bull or Neutral
Bear Rest(Light Red): a bounce, evolves into Bear or Bull
OverSold(Blue): may have defined a bottom or support, can happen in range, evolves into CrazySold or Bull
CrazySold(Fuchsia): going down in a high volatility , evolves into Bull, OverSold, or BearRest
---------- Some important evolutions of seasons ----------
OverBought -> CrazyBought: can happen with a breakout
CrazyBought -> OverBought or Bear: could mean fading of a breakout
CrazyBought -> BullRest: can happen after rising over a new level
OverSold -> CrazySold: can happen with a breakdown
CrazySold -> OverSold or Bear: could mean fading of a breakdown
CrazySold -> BearRest: can happen after dropping to a new level
---------- Rainbow Ribbons for multiple time frames ----------
Each ribbon of the rainbow represents a time frame,
The difference between two frames is 1.4142 fold (square root of 2), if level 1 is 15 M, level 2 is 15 * (square root of 2) M. level 3 is 15*2 M, level 4 is 30 * (square root of 2) M, level 5 is 30 * 2 m etc.
The uppermost ribbon represents the smallest time frame - current time period of the chart.
The lower ribbons represent bigger time frames, which work as context.
Examples for time frame rainbow:
For DEMO in 30M: 30M - 42M - 60M(1H) - 85M - 120M(2H) - 170M - 240M(4H) - 339M
For STANDARD in 15M: 15M - 21M - 30M - 42M - 60M(1H) - 85M - 120M(2H) - 170M
For PRO in 15M: 15M - 21M - 30M - 42M - 60M(1H) - 85M - 120M(2H) - 170M - 240M(4H) - 339M - 480M(8H) - 679M
---------- Versions Description ----------
The features may change later, please refer to latest update.
PRO:
PRO version of 9 Seasons Rainbow Indicator is invite-only, with the following advanced features:
12 Ribbon Rainbow lets you discover trading opportunities hidden in the 1.4142 fold time dimension while monitoring market conditions spanning 45 times.
Advanced alert sets allows you set alerts for Overbought, Crazybought, OverSold, CrazySold on low, medium, and high time frames.
Option to input different trading instrument to compare with the current ticker.
Full time periods access allows you to watch the market on broadest time dimensions.
More new features in updates.
STANDARD:
This is STANDARD version of 9 Seasons Rainbow Indicator, invite-only, with the following advanced features:
8 Ribbon Rainbow lets you discover trading opportunities hidden in the 1.4142 fold time dimension while monitoring market conditions spanning 11 times.
Advanced alert sets allows you set alerts for Overbought, Crazybought, OverSold, CrazySold on upper and lower time frames.
Broad time periods access allows you to watch the market on popular time dimensions from 15M - 1D,2D,3D,4D,5D,6D,1W.
More new features in updates.
DEMO:
A DEMO of Standard version for trial purpose, having most the functions except alert preset conditions.
It is applicable to a list of trading instruments and specific time periods(30m-1D), which may change later. please refer to latest updates.
---List of tickers applicable for Demo version.
Currency Index:AXY, BXY , CXY , DXY , EXY , JXY , SXY , ZXY ,
Stock Index:SPX,TSX, DAX , NI225 ,KOSPI,399001, SHCOMP , HSI , XJO , TAIEX , SX5E ,
Crypto:BTCUSD
Commodity:BCOUSD, GOLD
---------- Access to Indicators ----------
Please use DEMO version to taste the indicator.
Please contact the author for access to PRO or Standard versions.
---------- About Loading Time ----------
It may take up to 2 minutes for your browser to load a new setting, depending on the your computer and network speed.
---------- List of the author's Indicators ----------
tradingview.com/u/go8686/#published-scripts
---------- Disclaim ----------
By using or requesting access to this indicator, you acknowledge that you have read and accepted that this indicator is for study purposes only and it does NOT guarantee you will make money.
I am not financial adviser and I am NOT responsible for any profits or losses you may incur by using this indicator!
Users should make their own decisions, carefully assess risks and be responsible for investment and trading activities.
The latest updates override the previous description. Please check the updates.
9季彩虹指标 PRO
市场充满生机。
9季彩虹指标在多个时间维度上显示任何交易品种的9个季节交替,帮助交易者和投资者了解价格流动。
不同时间维度的季节组合可以给出完美的交易信号,例如:在小时间框架和大时间框架上同时出现超买具有很高的卖空交易成功概率。
请安装指标:DEMO,STANDARD 或者 PRO 版本. 应用指标到您的交易品种:证券,期货,外汇或者加密货币。找到属于您的盈利模式。
---------- 季节的定义 ----------
牛(绿色),可以演变到牛市回调,超买,熊 或者 中性
牛市回调(淡绿色):可以演变到牛或者熊
超买(黄色),可能刚刚定义了一个头部或者阻力区,可以发生在盘整期,可以演变到狂买或者熊
狂买(亮绿色):高波动性上涨,可以演变到熊,超买或者牛市回调
中性(白色): 没有方向的徘徊期,可以演变到牛或者熊
熊(红色),可以演变到熊市反弹,超卖,牛 或者 中性
熊市反弹(淡红色),可以演变到熊或者牛
超卖(蓝色),可能刚刚定义了一个底部或者支撑,可以发生在盘整期,可以演变到狂卖或者牛
狂卖(紫红色),高波动性下跌,可以演变到牛,超卖 或者熊市反弹
一些重要的季节交替
超买 -> 狂买:可能发生在向上突破时
狂买 -> 熊 或者 超买:可能发生在突破失败时
狂买 -> 牛市回调: 可能发生在上平台后
超卖 -> 狂卖:可能发生在向下突破时
狂卖 -> 牛 或者 超卖:可能发生在突破失败时
狂卖 -> 熊市回调: 可能发生在下平台后
---------- 色带彩虹所代表的时间维度 ----------
每条色带代表一个时间维度。
色带间隔1.4142倍(2的开方),如果第一维度是15分钟,第二维度是15*1.4142=21分钟,第三维度是15*2=30分钟,以此类推。
最上面的色带代表最小的时间维度,也就是目前图表的时间维度
最下面的色带代表最大的时间维度。
例子:
演示版: 30m-42m-60m(1H)-85m-120m(2H)-170m-240m(4H)-339m
标准版: 15m-21m-30m-42m-60m(1H)-85m-120m(2H)-170m
专业版: 15m-21m-30m-42m-60m(1H)-85m-120m(2H)-170m-240m(4H)-339m-480m(8H)-679m
---------- 不同版本功能描述 ----------
这些特征及功能可能会发生变化,以更新为准。
---专业版PRO高级特征
12色带彩虹让您发现隐藏在1.4142时间维度的交易机会,同时监控时间跨度达四十五倍的市场状态
高级警报功能:允许您在低,中,高时间帧上设置超买,狂买,超卖,狂卖的警报。
可以输入不同的交易品种用于指标,便于与当前交易品种进行比较。
全时间维度(分钟到日线级别)给您全视角观察市场
更新中的更多新功能。
---标准版STANDARD特征
8色带彩虹让您发现隐藏在1.4142时间维度的交易机会,同时监控时间跨度达十一倍的市场状态
高级警报功能:允许您在低,高时间层级上设置超买,狂买,超卖,狂卖的警报。
宽时间维度(15分钟到日线级别)让您从更宽阔的视角观察市场
更新中的更多新功能。
--演示版DEMO
演示版用于标准版的演示和试用,适用于特定的资产列表和时间维度(30M-1D),后续可能调整.
适用的品种列表
AXY , BXY , CXY , DXY , EXY , JXY , SXY , ZXY ,
SPX ,TSX, DAX , NI225 ,KOSPI,399001, SHCOMP , HSI , XJO , TAIEX , SX5E ,
BTCUSD , BCOUSD , GOLD
---------- 获得使用权 ----------
请使用演示版以初步了解指标的运行机理。
联系指标开发者以取得标准版和专业版的使用权
---------- 开发者的指标列表 ----------
tradingview.com/u/go8686/#published-scripts
---------- 加载时间 ----------
可能需要2分钟,取决于网络和电脑配置。
---------- 免责声明 ----------
在要求获得本指标使用权之前以及在使用本指标之前,用户认可已经完全了解和接受:本指标仅供研究目的, 它不提供任何赢利的可能性。
本指标的开发者并非专业投资顾问,因此不对用户的任何赢亏负责。
用户应独立判断,审慎评估并自负投资和交易风险!
最近的更新会覆盖之前的说明。 请参阅更新来查看指标的新特征和功能。
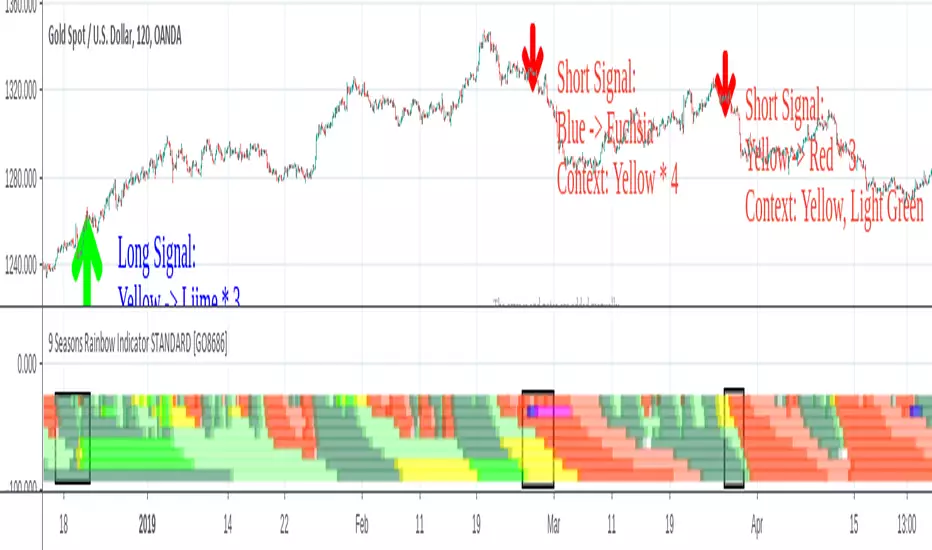
9 Seasons Rainbow Indicator STANDARD [GO8686]Market is full of life, with seasons.
9 Seasons Rainbow Indicator displays 9 seasons of any trading instrument in multiple time frames, helping traders and investors understand the flow of price.
The combination of seasons in different time dimensions may give perfect trading signals, for instance: overbought in both small time frame and big time frame has high success probability of shorting trade.
Please install the indicator: Demo, PRO or STANDARD Version. Apply the indicator to your favorites trading instruments: indices, stocks, futures , forex or crypto currencies. Find your patterns that make money.
---------- 9 Seasons ----------
Bull(Green), evolves into BullRest, OverBought, Bear, or Neutral
Bull Rest(Light Green): a pullback or retracement, evolves into Bull or Bear
OverBought(Yellow): may have defined a top or resistance, can happen in range, evolves into CrazyBought or Bear
CrazyBought(Lime): going up in a high volatility , evolves into Bear, OverBought, or BullRest
Neutral(White): a wandering season without direction, evolves into Bull or Bear
Bear(Red), evolves into BearRest, OverSold, Bull or Neutral
Bear Rest(Light Red): a bounce, evolves into Bear or Bull
OverSold(Blue): may have defined a bottom or support, can happen in range, evolves into CrazySold or Bull
CrazySold(Fuchsia): going down in a high volatility , evolves into Bull, OverSold, or BearRest
---------- Some important evolutions of seasons ----------
OverBought -> CrazyBought: can happen with a breakout
CrazyBought -> OverBought or Bear: could mean fading of a breakout
CrazyBought -> BullRest: can happen after rising over a new level
OverSold -> CrazySold: can happen with a breakdown
CrazySold -> OverSold or Bear: could mean fading of a breakdown
CrazySold -> BearRest: can happen after dropping to a new level
---------- Rainbow Ribbons for multiple time frames ----------
Each ribbon of the rainbow represents a time frame,
The difference between two frames is 1.4142 fold (square root of 2), if level 1 is 15 M, level 2 is 15 * (square root of 2) M. level 3 is 15*2 M, level 4 is 30 * (square root of 2) M, level 5 is 30 * 2 m etc.
The uppermost ribbon represents the smallest time frame - current time period of the chart.
The lower ribbons represent bigger time frames, which work as context.
Examples for time frame rainbow:
For DEMO in 30M: 30M - 42M - 60M(1H) - 85M - 120M(2H) - 170M - 240M(4H) - 339M
For STANDARD in 15M: 15M - 21M - 30M - 42M - 60M(1H) - 85M - 120M(2H) - 170M
For PRO in 15M: 15M - 21M - 30M - 42M - 60M(1H) - 85M - 120M(2H) - 170M - 240M(4H) - 339M - 480M(8H) - 679M
---------- Versions Description ----------
The features may change later, please refer to latest update.
STANDARD:
This is STANDARD version of 9 Seasons Rainbow Indicator, invite-only, with the following advanced features:
8 Ribbon Rainbow lets you discover trading opportunities hidden in the 1.4142 fold time dimension while monitoring market conditions spanning 11 times.
Advanced alert sets allows you set alerts for Overbought, Crazybought, OverSold, CrazySold on upper and lower time frames.
Broad time periods access allows you to watch the market on popular time dimensions from 15M - 1D,2D,3D,4D,5D,6D,1W.
More new features in updates.
PRO:
PRO version of 9 Seasons Rainbow Indicator is invite-only, with the following advanced features:
12 Ribbon Rainbow lets you discover trading opportunities hidden in the 1.4142 fold time dimension while monitoring market conditions spanning 45 times.
Advanced alert sets allows you set alerts for Overbought, Crazybought, OverSold, CrazySold on low, medium, and high time frames.
Option to input different trading instrument to compare with the current ticker.
Full time periods access allows you to watch the market on broadest time dimensions.
More new features in updates.
DEMO:
A DEMO of Standard version for trial purpose, having most the functions except alert preset conditions.
It is applicable to a list of trading instruments and specific time periods(30m-1D), which may change later. please refer to latest updates.
---List of tickers applicable for Demo version.
Currency Index:AXY, BXY , CXY , DXY , EXY , JXY , SXY , ZXY ,
Stock Index:SPX,TSX, DAX , NI225 ,KOSPI,399001, SHCOMP , HSI , XJO , TAIEX , SX5E ,
Crypto:BTCUSD
Commodity:BCOUSD, GOLD
---------- Access to Indicators ----------
Please contact the author for access to PRO or Standard versions.
---------- About Loading Time ----------
It may take up to 2 minutes for your browser to load a new setting, depending on the your computer and network speed.
---------- List of the author's Indicators ----------
tradingview.com/u/go8686/#published-scripts
---------- Disclaim ----------
By using or requesting access to this indicator, you acknowledge that you have read and accepted that this indicator is for study purposes only and it does NOT guarantee you will make money.
I am not financial adviser and I am NOT responsible for any profits or losses you may incur by using this indicator!
Users should make their own decisions, carefully assess risks and be responsible for investment and trading activities.
The latest updates override the previous description. Please check the updates.
9季彩虹指标 标准版 STANDARD
市场充满生机。
9季彩虹指标在多个时间维度上显示任何交易品种的9个季节交替,帮助交易者和投资者了解价格流动。
不同时间维度的季节组合可以给出完美的交易信号,例如:在小时间框架和大时间框架上同时出现超买具有很高的卖空交易成功概率。
请安装指标:DEMO,STANDARD 或者 PRO 版本. 应用指标到您的交易品种:证券,期货,外汇或者加密货币。找到属于您的盈利模式。
---------- 季节的定义 ----------
牛(绿色),可以演变到牛市回调,超买,熊 或者 中性
牛市回调(淡绿色):可以演变到牛或者熊
超买(黄色),可能刚刚定义了一个头部或者阻力区,可以发生在盘整期,可以演变到狂买或者熊
狂买(亮绿色):高波动性上涨,可以演变到熊,超买或者牛市回调
中性(白色): 没有方向的徘徊期,可以演变到牛或者熊
熊(红色),可以演变到熊市反弹,超卖,牛 或者 中性
熊市反弹(淡红色),可以演变到熊或者牛
超卖(蓝色),可能刚刚定义了一个底部或者支撑,可以发生在盘整期,可以演变到狂卖或者牛
狂卖(紫红色),高波动性下跌,可以演变到牛,超卖 或者熊市反弹
一些重要的季节交替
超买 -> 狂买:可能发生在向上突破时
狂买 -> 熊 或者 超买:可能发生在突破失败时
狂买 -> 牛市回调: 可能发生在上平台后
超卖 -> 狂卖:可能发生在向下突破时
狂卖 -> 牛 或者 超卖:可能发生在突破失败时
狂卖 -> 熊市回调: 可能发生在下平台后
---------- 色带彩虹所代表的时间维度 ----------
每条色带代表一个时间维度。
色带间隔1.4142倍(2的开方),如果第一维度是15分钟,第二维度是15*1.4142=21分钟,第三维度是15*2=30分钟,以此类推。
最上面的色带代表最小的时间维度,也就是目前图表的时间维度
最下面的色带代表最大的时间维度。
例子:
演示版: 30m-42m-60m(1H)-85m-120m(2H)-170m-240m(4H)-339m
标准版: 15m-21m-30m-42m-60m(1H)-85m-120m(2H)-170m
专业版: 15m-21m-30m-42m-60m(1H)-85m-120m(2H)-170m-240m(4H)-339m-480m(8H)-679m
---------- 不同版本功能描述 ----------
这些特征及功能可能会发生变化,以更新为准。
---标准版STANDARD特征
8色带彩虹让您发现隐藏在1.4142时间维度的交易机会,同时监控时间跨度达十一倍的市场状态
高级警报功能:允许您在低,高时间层级上设置超买,狂买,超卖,狂卖的警报。
宽时间维度(15分钟到日线级别)让您从更宽阔的视角观察市场
更新中的更多新功能。
---专业版PRO高级特征
12色带彩虹让您发现隐藏在1.4142时间维度的交易机会,同时监控时间跨度达四十五倍的市场状态
高级警报功能:允许您在低,中,高时间帧上设置超买,狂买,超卖,狂卖的警报。
可以输入不同的交易品种用于指标,便于与当前交易品种进行比较。
全时间维度(分钟到日线级别)给您全视角观察市场
更新中的更多新功能。
--演示版DEMO
演示版用于标准版的演示和试用,适用于特定的资产列表和时间维度(30M-1D),后续可能调整.
适用的品种列表
AXY , BXY , CXY , DXY , EXY , JXY , SXY , ZXY ,
SPX ,TSX, DAX , NI225 ,KOSPI,399001, SHCOMP , HSI , XJO , TAIEX , SX5E ,
BTCUSD , BCOUSD , GOLD
---------- 获得使用权 ----------
联系指标开发者以取得标准版和专业版的使用权
---------- 开发者的指标列表 ----------
tradingview.com/u/go8686/#published-scripts
---------- 加载时间 ----------
可能需要2分钟,取决于网络和电脑配置。
---------- 免责声明 ----------
在要求获得本指标使用权之前以及在使用本指标之前,用户认可已经完全了解和接受:本指标仅供研究目的, 它不提供任何赢利的可能性。
本指标的开发者并非专业投资顾问,因此不对用户的任何赢亏负责。
用户应独立判断,审慎评估并自负投资和交易风险!
最近的更新会覆盖之前的说明。 请参阅更新来查看指标的新特征和功能。
Multiple EMA MTF by ZekisA simple but effective strategy with multiple time frames for EMA.
Very useful so you don't have to change chart resolution to check it, you have direct confirmation.
I put 6 time frames for one EMA as bricks, sometimes is hard to see if a line is above or below the price and you need to zoom and zoom, so with this way of view, it will be easier.
Green = EMA is below price = bullish
Red = EMA is above price = bearish
Multi time frames as default (you can change it for your needs) - 5m, 15m, 30m, 1H, 2H and 4H.
Enjoy!
@Zekis

MTF H/L RangeThis indicator will let you have multiple timeframe support and resistance levels on any timeframe!

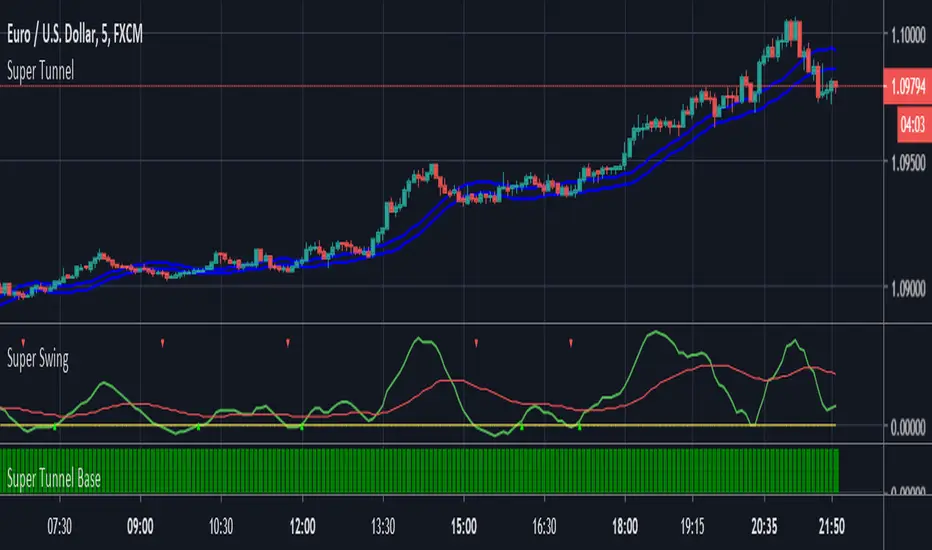
Super Tunnel by JP Goswami
One of the most accurate trend following indicator I have used till now. You yourself can test it by using on multiple charts and time frame. However, I have found it more accurate on intraday charts, may be 5 min & 15 min TF.
Highlights are:
> High Prediction rates
> Non repainting
> Can be used on MTF
> Simplicity
> Give stoploss levels
Disadvantage:
> Just like any other trend following indicator, volatility and spikes are enemy of this indicator
How to Use
Long:
When Price closes above the tunnel & background is Lime
Stoploss: Just below lower line of the tunnel
Short: When price closes below the tunnel & background is yellow
Stoploss: Just above upper line of the tunnel
No trades: When background doesn't have any colors
Reentry: if Price moves back to long and short rules
All the best
© JP Goswami
Multi-Timeframe Stochs by Tom L.I find it really usefull. Can put 4 different timeframes.
Thanks again to Tom !
PMA4LIFE
RAF3x

Multi-Timeframes(simplified)Its a simplified version of the script "Ultimate Moving Average Multi-Timeframes" by Chris Moody.
Ive removed the second MA, removed the change colors feature and added the option to change the line width of the indicator

MTF BB Meow Mix [acatwithcharts]This script adds multi-timeframe support to full BB Meow Mix, with the full set of various moving average and stdev calculation types.
There is a tradeoff in that there is, to the best of my knowledge, no way to support both MTF and the default band settings menu in the same script, because the security() function in Pinescipt doesn't support variable lookback lengths and trying to plot everything independently instead maxes out the number of plots allowed per script. So, this version of the script doesn't include a menu of defaults.
My volatility indicators are available by subscription in several packages through SharkCharts.live.
Current pricing and subscription details will be kept up-to-date on SharkCharts.live

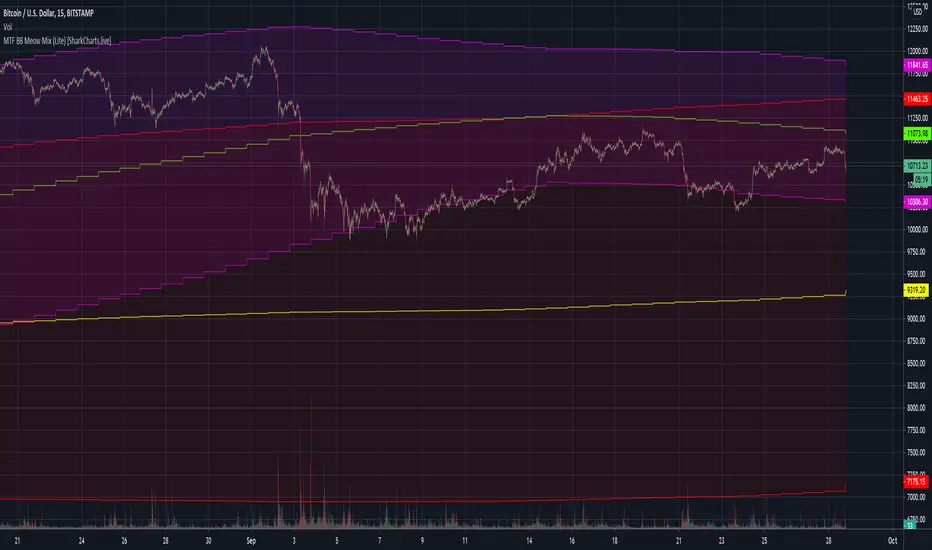
MTF BB Meow Mix (Lite) [acatwithcharts]This script adds multi-timeframe support to BB Meow Mix (Lite).
There is a tradeoff in that there is, to the best of my knowledge, no way to support both MTF and the default band settings menu in the same script, because the security() function in Pinescipt doesn't support variable lookback lengths and trying to plot everything independently instead maxes out the number of plots allowed per script. So, this version of the script doesn't include a menu of defaults.
My volatility indicators are available by subscription in several packages through SharkCharts.live.
Current pricing and subscription details will be kept up-to-date on SharkCharts.live
Moving Average 8 lines (multi timeframe 4 lines)moving average 8 lines
(multi timeframe moving average 4 lines)
and entry sign
default : for 5 minute chart

Multi Time Frame SARThis Indicator plots 5 differents time frame SAR in the same graphic.
It must be used in 5 minutes Time Frame.
Plots 5 minutes SAR, 15 minutes, 30 minutes, 1 Hour and 4 Hours.
If you need it to use in other time frame, you can send me a message to evaluate the development of a new version.

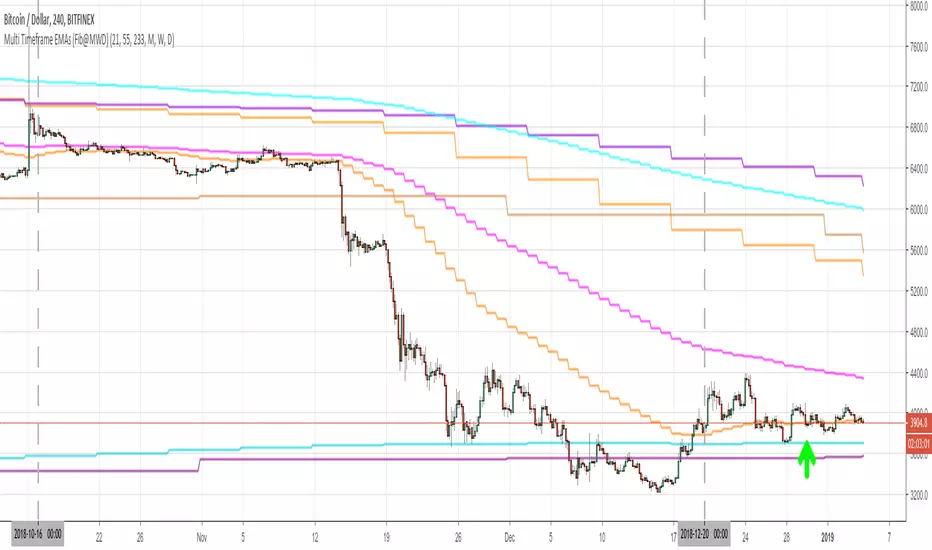
Multi Timeframe EMAs (Fib@MWD)plot fibonacci EMAs 21,55,233 on the timeframes monthly, weekly and daily.
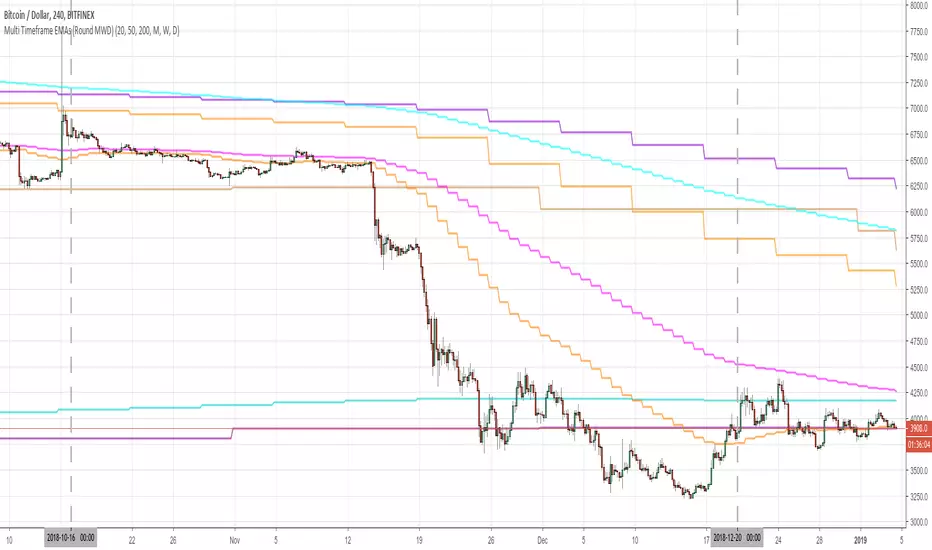
Multi Timeframe EMAs (Round@MWD)plot round number EMAs 20,50,200 on the timeframes monthly, weekly and daily.
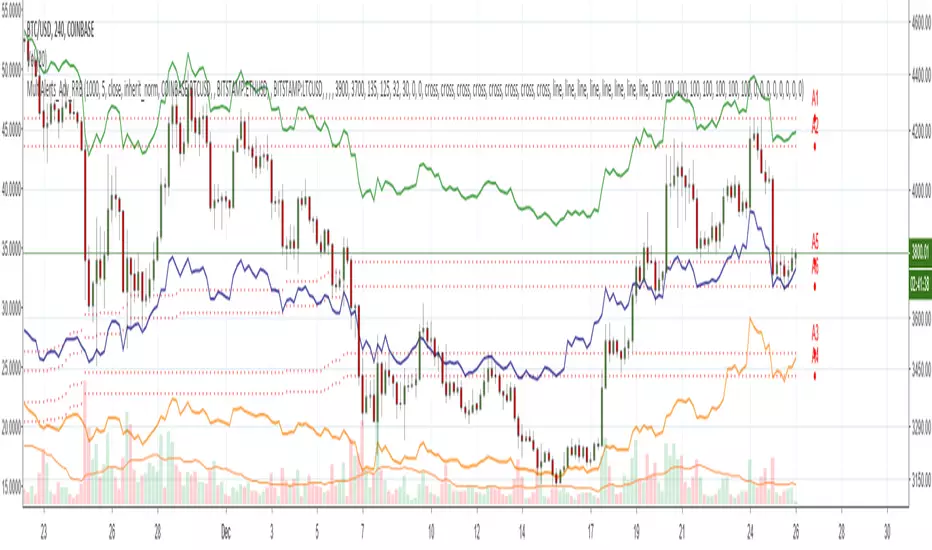
Zindarra Multi Alerts Advanced (8 Symbols, 8 Levels) by RRBZindarra Multi Alerts Advanced by RRB by RagingRocketBull 2018
Version 1.0
This indicator lets you configure multiple alert levels for several assets. Zindarra Multi Alerts Advanced supports 8 symbols with 8 custom alert levels.
You can have an M:M relationship betweeen symbols and levels, for example:
- 4 symbols each boxed by 2 alerts above/below the price
- 3 symbols with 1 alert each
- 2 symbols, 1st with 2 alerts, 2nd - with 6 alerts
- 1 symbol with 8 alerts etc
There are several versions: Simple, Pro, Advanced and Ultimate. This is the Advanced version. The Differences are listed below.
- Simple: 10 Alert Levels, 1 plot mode, alert type: cross, no colors/triggered alerts
- Pro: 9 Alert Levels, 2 plot modes: plot/price line, alert type: cross, +change/swap colors, +hide/disable triggered alerts, 2 penetration modes (close, high/low), trigger on confirmed close
- Advanced: 8 Symbols/Tickers, 8 Alert Levels, +alert types: cross up/cross down, no color change. Display sources as lines/candles, normalize, scale/shift independently
- Ultimate: 5 Symbols/Tickers, 8 Alert Levels, +alert types: volume/price %/abs change, volume/ema/time cross
Features:
- 8 custom symbols, symbols:levels = M:M
- 8 custom alert levels with labels. For each alert there must be a corresponding non-empty symbol (can be a duplicate)
- alert types: cross/cross up/cross down
- normalize symbols (and alert levels) to 100% to compare,
- scale and shift each symbol (and alert levels) to position on a chart independently
- 1 alert levels plot mode: plot
- 2 symbol types: line/candles
- colorize symbol candles
- high/low or close level penetration modes
- show/hide levels/labels
- keep or auto disable triggered alerts
- trigger alerts only after a confirmed close
You will see all symbols on a single chart at the same time with their corresponding alert levels. From this chart you can manage all alerts configured for multiple assets.
Although TradingView has 2 percentage scale modes (Percent, Indexed to 100), somehow they still fail to be usefull when comparing multiple assets.
This indicator lets you normalize all symbols to 100% making a direct single scale comparison between assets with vastly different price levels possible.
All alert levels will be normalized as well.
TradingView does not let you move the plots attached to left scale. When scaled they all remain stuck in the center and can't be moved vertically or relative to each other.
This indicator lets you position all symbols independently using individual scale and shift settings. For example, you can:
- split your screen in 3 horiz areas and have a symbol in each of them without overlapping or
- have several partially overlapping assets with different scale each or
- have all assets fully overlapping and normalized to the same 100% scale
You have to manually create an alert in Manage Alerts Panel and configure it to use with this indicator.
Free accounts are limited to only 1 alert slot and this indicator will take it (any existing alerts must be disabled/stopped).
Once the alert is configured, the indicator can be removed from chart to free a slot for another indicator, but you won't see the alert levels.
Usage:
1. attach indicator to a chart
2. define alert levels in UI settings
3. in TradingView's Manage Alerts panel on the right:
- for free accounts: disable/stop all existing alerts, you are limited to 1 alert slot only. Otherwise you won't be able to save.
- create a new Alert:
- select 'Multi Alerts' indicator name in the Condition dropdown box, leave Level 1 and Multi Alerts Cross as default options
- select 'Once Per Bar' or 'Once Per Minute' instead of 'Only Once' to trigger the alert multiple times
5. click Save. Your 9 alerts are enabled now.
Change Settings:
1. change levels/settings in UI. Any changes will also reset already triggered levels visibility.
2. in Manage Alerts panel:
- open/edit the alert you created
- select new instance of 'Multi Alerts' indicator name in the Condition dropdown box (appears at the bottom)
- check the Condition dropdown again - a single instance should remain selected.
3. click Save. Your alert settings are updated.
Notes on using alerts:
- attaching this indicator to a chart and configuring alert levels will not automatically enable the alerts - you have to manually create/configure a new alert in the Alerts Panel
- removing this indicator from chart will not disable the alerts, you have to manually disable the alert you created in the Alerts Panel
- your alert in the Alerts Panel uses another instance (copy) of indicator/settings. Any changes won't affect the alert. You have to manually update the alert every time you change any settings in the indicator.
- recompiling and attaching your own version of indicator will require creating a new Alert (delete the old one).
- alerts are designed to work in realtime. In replay mode you will see triggered alert levels hiding/changing colors but there will be no system alert messages. It's best to test the indicator in realtime on M1 (1 min) chart
- you will only see 1 system alert per bar/60 sec when multiple alert levels are crossed with a single bar or across several symbols at the same time. However all of these levels will hide in the indicator as expected.
- you can only see the alert levels when the indicator is attached to chart, they are not shown by the system alert.
- For source=high/low a directional level penetration is used automatically (crossunder/low and crossover/high). For source=close a standard bidirectional cross is used unless another alert type is specified.
- normalization breaks/distorts alert levels and symbol price - this is normal and is expected. To view the real price of alert levels uncheck normalize - the first 8 outputs are alert levels. Unnormalized levels are straight lines.
- you will see alerts from all symbols in the system alert message box of the current symbol - a bit confusing, but there's no workaround, you can't have a customized alert message for each symbol/level
- many tickers as arguments can stretch/break TradingView's Create New Alert dialog but it's still possible to push all required buttons and Save.
- duplicate symbols will be displayed by default. You can manually hide duplicates using show/hide flags.
- empty tickers (and corresponding alerts) are essentially disabled
1. uses plot*, cross*, barssince, highest, security, alertcondition
Zindarra Multi Alerts by RRBZindarra Multi Alerts by RRB by RagingRocketBull 2018
Version 1.0
This indicator lets you configure multiple alert levels for an asset. Zindarra Multi Alerts supports 10 custom alert levels.
You have to manually create an alert in Manage Alerts Panel and configure it to use with this indicator.
Free accounts are limited to only 1 alert slot and this indicator will take it (any existing alerts must be disabled/stopped).
Once the alert is configured, the indicator can be removed from chart to free a slot for another indicator, but you won't see the alert levels.
This is the Zindarra Multi Alerts Simple version. You can't auto disable already triggered alerts in this indicator. All alerts will remain active.
If you want to be able to hide/disable/change color of the triggered alert levels use the Zindarra Multi Alerts Pro version.
Features:
- 10 custom alert levels with labels
- set open/high/low/close source point for level penetration
- show/hide levels/labels
Usage:
1. attach indicator to a chart
2. define alert levels in UI settings
3. in TradingView's Manage Alerts panel on the right:
- for free accounts: disable/stop all existing alerts, you are limited to 1 alert slot only. Otherwise you won't be able to save.
- create a new Alert:
- select 'Multi Alerts' indicator name in the Condition dropdown box, leave Level 1 and Multi Alerts Cross as default options
- select 'Once Per Bar' or 'Once Per Minute' instead of 'Only Once' to trigger the alert multiple times
5. click Save. Your 9 alerts are enabled now.
Change Settings:
1. change levels/settings in UI
2. in Manage Alerts panel:
- open/edit the alert you created
- select new instance of 'Multi Alerts' indicator name in the Condition dropdown box (appears at the bottom)
- check the Condition dropdown again - a single instance should remain selected.
3. click Save. Your alert settings are updated.
Notes on using alerts:
- attaching this indicator to a chart and configuring alert levels will not automatically enable the alerts - you have to manually create/configure a new alert in the Alerts Panel
- removing this indicator from chart will not disable the alerts, you have to manually disable the alert you created in the Alerts Panel
- your alert in the Alerts Panel uses another instance (copy) of indicator/settings. Any changes won't affect the alert. You have to manually update the alert every time you change any settings in the indicator.
- recompiling and attaching your own version of indicator will require creating a new Alert (delete the old one).
- alerts are designed to work in realtime. In replay mode you will see only the alert levels but there will be no system alert messages. It's best to test the indicator in realtime on M1 (1 min) chart
- you will only see 1 system alert per bar/60 sec when multiple alert levels are crossed with a single bar.
- you can only see the alert levels when the indicator is attached to chart, they are not shown by the system alert.
- a standard bidirectional cross is used for all penetration sources
1. uses plot*, cross*, alertcondition