Multi
SWING POINTS HOUNDTry's to find possible swing points and reversal points using mutli time frame moving averages and Fibonacci retracement with multiple lengths. Can be used to gauge trends and find potential entry points for trend following strategies. Can also be used to find potential price reversal points and areas of heavy resistance/support.

Custom Timeframe FibsThis is a testing project for fib levels to try out fivs on multi timeframes
Thank you ShoujiSuzuki


9 Seasons Rainbow Indicator EXPERT [GO8686]A stable release of EXPERT version.
"Expert" is a release with features between Standard and PRO version, with initial features:
9 Ribbons, 4 Alerts Set, Time frame >= 15m, which may change later.
The indicator discovers profitable patterns by associating Price Season of multiple time frames.
Full Name: 9 Seasons Rainbow - Multiple Time Frames Associated Price Wave Pattern Indicator
This is redefined from “9 Seasons Rainbow Indicator PRO”, with clearer definition of 9 Seasons and user manual.
Version: Invite-Only Expert
Language: English
Copyright: 2019
---------- How to use the indicator ----------
Go through the manual and related ideas underneath or follow the tutorials list. Look through the profitable patterns and related cases, wait for or set alert for specific profitable pattern.
---------- Definition: 9 Seasons ----------
A life cycle of Price Wave is divided into 9 Seasons. Each time frame, from 5 minute to 1 month, has 9 seasons, Independent of each other:
Bull (Green)
Bull Pullback (Light Green): a pullback or retracement
Resistance / Overbought (Yellow): a resistance area , may become a Top, or be broken through.
Crazy Bought (Lime): Price is going up in a high volatility , could be a valid breakout, or a Bull Trap.
Neutral (White): a wandering season without direction, evolves into Bull or Bear
Bear (Red)
Bear Bounce (Light Red): Price bounces
Support / Oversold (Blue): a support area , may become a Bottom, or be broken through.
Crazy Sold (Fuchsia): Price is going down in a high volatility , could be a valid breakdown, or a Bear Trap.
---------- Some important evolution between seasons ----------
Resistance / Overbought (Yellow) -> Crazy Bought (Lime):
Bull is breaking through a resistance.
Crazy Bought (Lime) -> Resistance / Overbought (Yellow):
This normally indicates a failed breakout, Price goes back to the resistance.
Crazy Bought (Lime) -> Bull Pullback (Light Green):
This normally indicates Price has risen to a new level
Support / Oversold (Blue) -> Crazy Sold (Fuchsia):
Bear is breaking through a support.
Crazy Sold (Fuchsia) -> Support / Oversold (Blue):
This normally indicates a failed breakdown, Price recovers to the support.
Crazy Sold (Fuchsia) -> Bear Bounce (Light Red):
This normally indicates price has dropped to a new level
---------- Rainbow Ribbons for Multiple Time Frames ----------
Each ribbon of a rainbow represents a time frame.
The uppermost ribbon represents the shortest-term time frame - current time period of the chart, which is the time frame for trading.
The lowermost ribbon represent longest-term time frame, which work as environment, together with the other medium-term and long-term time frames.
The difference between two frames is 1.4142 fold (square root of 2), if level 1 is 15 minute, level 2 is 15 minute * (square root of 2) .
Examples of time frames in a rainbow:
For STANDARD in 15M: 15M - 21M - 30M - 42M - 60M(1H) - 85M
For EXPERT: 15M - 21M - 30M - 42M - 60M(1H) - 85M - 120M(2H) - 170M - 240M(4H)
For PRO in 15M: 15M - 21M - 30M - 42M - 60M(1H) - 85M - 120M(2H) - 170M - 240M(4H) - 339M - 480M(8H) - 679M
---------- Trading Methods ----------
How to open a Long position?
When a profitable Long pattern appears, open small position first based on signal on shortest-term time frame; after retesting and confirming the support, open 2nd position; when it breaks through the resistance, pullbacks and confirms the breakout, open 3rd position.
How to exit a Long position?
Lift the Stop to a confirmed higher low, so that to take advantages of the bull run as possible.
How to open a Short position?
When a profitable Short pattern appears, open small position first based on signal on shortest-term time frame; after retesting and confirming the resistance, open 2nd position; when it breaks through the support, bounces and confirms the breakdown, add 3rd position.
How to exit a Short position?
Lower the Stop to a confirmed lower high, so that to take advantages of the bear run as possible.
---------- Access to Indicators ----------
Please use DEMO version for Trial
PM the author for access to Invite-Only PRO, EXPERT and STANDARD versions:
---------- How to Install Invite Only: STANDARD, EXPERT & PRO Version----------
Ask access to STANDARD, EXPERT or PRO version
Open the chart -> Indicators (On the Top) -> Invite-Only Scripts (2nd button of the left bar)
Like/Favorite the indicator
Click to install on the chart
---------- About Loading Time ----------
It may take up to 2 minutes for your browser to load a new setting, depending on the your computer and network speed.
---------- List of the author's Indicators ----------
www.tradingview.com
---------- Disclaimer ----------
By using or requesting access to the indicator, you acknowledge that you have read and accepted that the indicator and any related content, including but not limited to: product details, user manual, tutorials, ideas, videos, chats, emails, blog, talks are for the purpose of trading strategies studying and paper trading only.
If a customer or user uses the indicator or related content mentioned above for live trading or investment, she/he should take all risks and be responsible for her/his own trading and investment activities.
---------- Updates ----------
The latest updates override the previous description.
To activate a update: Close the browser, Reopen the chart and apply the indicator.
The features may change later.
---------- Tags ----------
MTF, multiple timeframes, multiple time frames, multi timeframes, multi time frames

9 Seasons Rainbow Multi Time Frames Pattern Expert [9SRPEN]"Expert" is a release with features between Standard and PRO version, with initial features:
9 Ribbons, 4 Alerts Set, Time frame >= 15m, which may change later.
The indicator discovers profitable patterns by associating Price Season of multiple time frames.
Full Name: 9 Seasons Rainbow - Multiple Time Frames Associated Price Wave Pattern Indicator
This is redefined from “9 Seasons Rainbow Indicator PRO”, with clearer definition of 9 Seasons and user manual.
Version: Invite-Only Expert
Language: English
Copyright: 2019
---------- How to use the indicator ----------
Go through the manual and related ideas underneath or follow the tutorials list. Look through the profitable patterns and related cases, wait for or set alert for specific profitable pattern.
---------- Definition: 9 Seasons ----------
A life cycle of Price Wave is divided into 9 Seasons. Each time frame, from 5 minute to 1 month, has 9 seasons, Independent of each other:
Bull (Green)
Bull Pullback (Light Green): a pullback or retracement
Resistance / Overbought (Yellow): a resistance area , may become a Top, or be broken through.
Crazy Bought (Lime): Price is going up in a high volatility , could be a valid breakout, or a Bull Trap.
Neutral (White): a wandering season without direction, evolves into Bull or Bear
Bear (Red)
Bear Bounce (Light Red): Price bounces
Support / Oversold (Blue): a support area , may become a Bottom, or be broken through.
Crazy Sold (Fuchsia): Price is going down in a high volatility , could be a valid breakdown, or a Bear Trap.
---------- Some important evolution between seasons ----------
Resistance / Overbought (Yellow) -> Crazy Bought (Lime):
Bull is breaking through a resistance.
Crazy Bought (Lime) -> Resistance / Overbought (Yellow):
This normally indicates a failed breakout, Price goes back to the resistance.
Crazy Bought (Lime) -> Bull Pullback (Light Green):
This normally indicates Price has risen to a new level
Support / Oversold (Blue) -> Crazy Sold (Fuchsia):
Bear is breaking through a support.
Crazy Sold (Fuchsia) -> Support / Oversold (Blue):
This normally indicates a failed breakdown, Price recovers to the support.
Crazy Sold (Fuchsia) -> Bear Bounce (Light Red):
This normally indicates price has dropped to a new level
---------- Rainbow Ribbons for Multiple Time Frames ----------
Each ribbon of a rainbow represents a time frame.
The uppermost ribbon represents the shortest-term time frame - current time period of the chart, which is the time frame for trading.
The lowermost ribbon represent longest-term time frame, which work as environment, together with the other medium-term and long-term time frames.
The difference between two frames is 1.4142 fold (square root of 2), if level 1 is 15 minute, level 2 is 15 minute * (square root of 2) .
Examples of time frames in a rainbow:
For STANDARD in 15M: 15M - 21M - 30M - 42M - 60M(1H) - 85M
For EXPERT: 15M - 21M - 30M - 42M - 60M(1H) - 85M - 120M(2H) - 170M - 240M(4H)
For PRO in 15M: 15M - 21M - 30M - 42M - 60M(1H) - 85M - 120M(2H) - 170M - 240M(4H) - 339M - 480M(8H) - 679M
---------- Trading Methods ----------
How to open a Long position?
When a profitable Long pattern appears, open small position first based on signal on shortest-term time frame; after retesting and confirming the support, open 2nd position; when it breaks through the resistance, pullbacks and confirms the breakout, open 3rd position.
How to exit a Long position?
Lift the Stop to a confirmed higher low, so that to take advantages of the bull run as possible.
How to open a Short position?
When a profitable Short pattern appears, open small position first based on signal on shortest-term time frame; after retesting and confirming the resistance, open 2nd position; when it breaks through the support, bounces and confirms the breakdown, add 3rd position.
How to exit a Short position?
Lower the Stop to a confirmed lower high, so that to take advantages of the bear run as possible.
---------- Access to Indicators ----------
Please use DEMO version for Trial
PM the author for access to Invite-Only PRO, EXPERT and STANDARD versions:
---------- How to Install Invite Only: STANDARD, EXPERT & PRO Version----------
Ask access to STANDARD, EXPERT or PRO version
Open the chart -> Indicators (On the Top) -> Invite-Only Scripts (2nd button of the left bar)
Like/Favorite the indicator
Click to install on the chart
---------- About Loading Time ----------
It may take up to 2 minutes for your browser to load a new setting, depending on the your computer and network speed.
---------- List of the author's Indicators ----------
www.tradingview.com
---------- Disclaimer ----------
By using or requesting access to the indicator, you acknowledge that you have read and accepted that the indicator and any related content, including but not limited to: product details, user manual, tutorials, ideas, videos, chats, emails, blog, talks are for the purpose of trading strategies studying and paper trading only.
If a customer or user uses the indicator or related content mentioned above for live trading or investment, she/he should take all risks and be responsible for her/his own trading and investment activities.
---------- Updates ----------
The latest updates override the previous description.
To activate a update: Close the browser, Reopen the chart and apply the indicator.
---------- Tags ----------
multiple timeframes, MTF, multiple time frames, multi timeframes, multi time frames

Elgrand - Overbought Rsi and StochRsi on multiple timeframesScript to visualize the overbought and oversold condition on multiple timeframes. Good way to determine when you have a lower risk for enter a trade or to determine when you need to be on the lookout to sell.

Supertrend MTF Heatmap V2Hello traders and aspiring Pinescripters
You might remember this script Supertrend-Heatmap-Multi-timeframes/ ?
A follower, asked me in a comment to do a version where YOU guys can select the timeframes
Well... what follower asks, follower (sometimes) gets. I'm not Santa Claus but this is Christmas with a few months in advance (#oh #oh #oh)

Multi-Time Frame MonitorThis script monitors the RSI on all timeframes; no matter what chart or timeframe you are viewing.
Currently it's setup with a basic Buy/Sell indicator based off of common rsi overbought and oversold levels.
You can choose to show all the data or only have the data show up when there is a buy/sell condition.
In the future, I will be adding more multitimeframe indicators to monitor. Suggestions and feedback are welcomed!


Divergences multi timeframeMT div monitor, add your own input for divs under expressions. Add them to the original bulldivs or beardivs with +. Set div_threshold in inputs.

Week High MTFSimple script to plot weekly data into your chart and as example how MTF works in pine script.
I use it for the 52 week high but you can choose other sources as well f.e. HL2 or close to reduce noise from wicks, also define your own length.

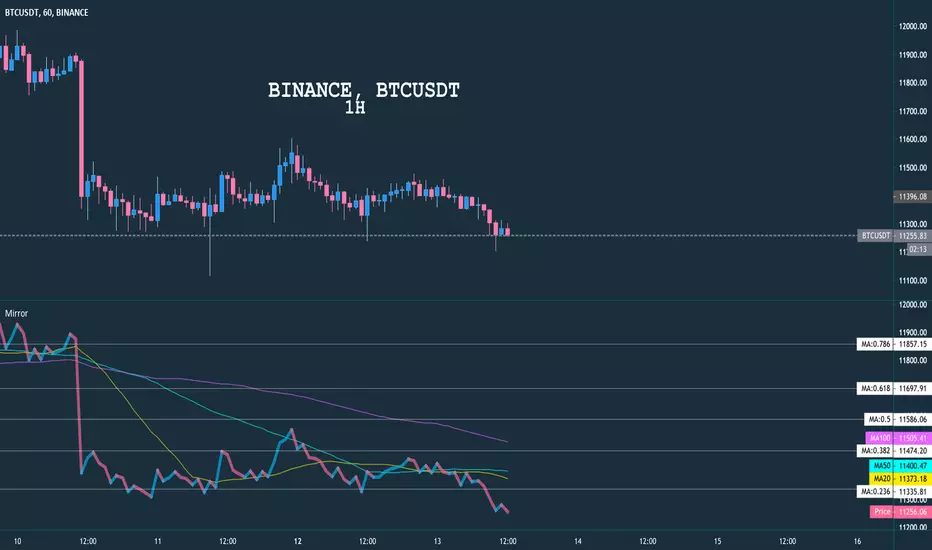
Mirror Chart MultitimeframeDescription
Allow user to display any chart from any timeframe with indicator Moving Average and Auto Fibonacci
Setting
Chart From , please enter your index symbol, example: BINANCE:BTCUSDT or ETHBTC
Timeframe , which time frame to show the chart (no impact with main chart)
MA 20, MA 50, MA 100 , check any MA that you want to display
Fibo Range , enter total candle that will be used for fibo
Show Fibo 0-1 , show fibo line from 0, 0.236 and so on to 1
Example
It shows many charts with different timeframes
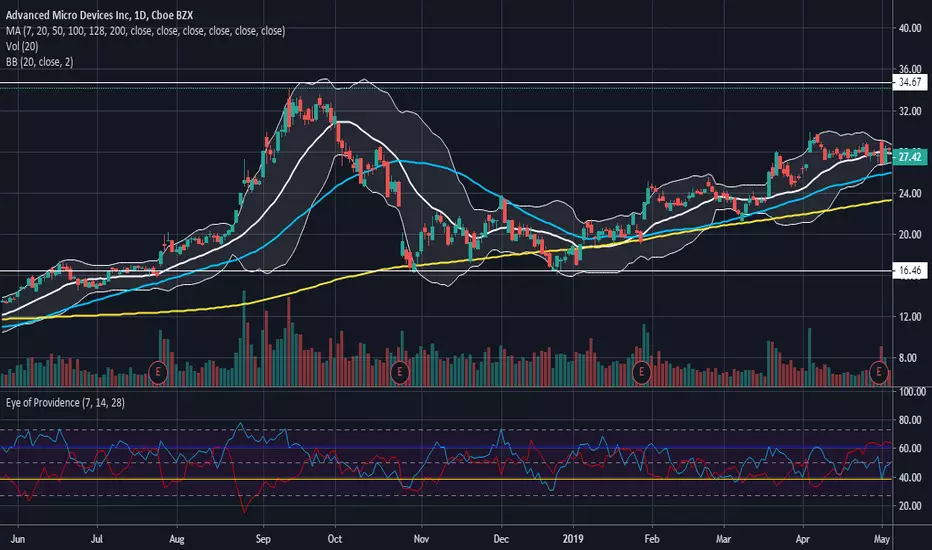
The All Seeing EyeThe All Seeing Eye is the Logarithmic Ultimate Oscillator (marked blue) interposed with a special Choppiness Index I call the "Trend Energy Index" (marked red) that has been averaged over multiple time frames. Key levels are set at the 50 center line, and then 1 and 2 standard deviations from the center line. This oscillator is intended for use in the standard stock market but can very likely be applied to the Forex market as well.
The 50 center line indicates the beginning or end of a trend based on the direction of the cross of the Ultimate Oscillator . Trend Strength is indicated by the position of the Trend Energy Index. Use this oscillator in the same way you would use the Ultimate Oscillator while considering the strength of the trend via the multiple Trend Energy Index. Entry and exit points are identified when the Trend Energy Index is in a trending state or spikes sharply downwards from an energy level near 61.8 and higher than 50. When the Trend Energy Index crosses above the 50 center line, it indicates the trend has ended. When it crosses below the 50 center line, it indicates a trend is beginning. Sharp changes in the direction of the Trend Energy Index at the 1 and 2 standard deviation key levels are usually accompanied by the same reaction from the Ultimate Oscillator indicating the trend may be entering a pullback or consolidation period. The Ultimate Oscillator will tell you the likely direction of the trend based on its slope between time intervals, as well as its position being above or below 50. Again, use the Ultimate Oscillator as you would RSI . Overbought and Oversold levels are indicated at the 2 standard deviation levels from the center line in relation to the Ultimate Oscillator . These levels are 27.2 for oversold and 72.8 for overbought.
The power of this oscillator comes from the reactivity of the Trend Energy Index in alerting you of trend strengthening or weakening of the predominant trend indicated by the Ultimate Oscillator . Pairing these two together produces great accuracy in Identifying reversals, exit points, and entry points. Additionally, the Ultimate Oscillator gives much less false divergence readings than standard RSI , and pairing with the ability of the Trend Energy Index to identify trend strength on any time frame allows great versatility while maintaining accuracy.
Because of the nature of this oscillators design, it is suited for use under any time frame and any volatility level. However, I personally have found it to be most accurate under low to medium-high volatility levels in a weekly time frame or shorter. Accuracy begins to be lost once the time frames are monthly or higher. It is recommended to use this oscillator with a volume indicator and a secondary momentum indicator such as MACD to verify signals from the All Seeing Eye for the highest degree of accuracy to be achieved.
Easy to read and notable trend states to get you started:
Blue line above 50 and red line below 50 = Uptrend
Both blue line and red line below 50 = Downtrend
Blue line 2 standard deviations above 50 and red line 2 standard deviations below 50 = Strong uptrend
Both blue line and red line 2 standard deviations below 50 = Strong downtrend
Red line at 1 standard deviation below 50 = weak trend
Red line at 2 standard deviations below 50 = strong trend
Red line at 1 standard deviation above 50 = consolidation phase (very weak or no trend)
Red line at 2 standard deviations above 50 = dead in the water (no trend at all)
My #1 tip: Pay close attention to the slopes of both lines in this oscillator and their relationship to each other!

Multi Timeframe RSI
This indicator will populate an RSI chart for multiple timeframes on the same chart.
Current Timeframe
15-min
1-hr
4-hr
1D
The point is to more easily see when things are getting oversold or overbought across multiple timeframes at the same time. To help with that, the background will also color green if all your selected timeframes are oversold and red if all your selected timeframes are overbought.
Note: It will only display and use the background colors on your current timeframe and timeframes larger than the current timeframe. So if you are looking at the 4-hr, the 15-min and 1-hr are ignored.

Dollar Cost Average (Data Window Edition)Hi everyone
Hope you had a nice weekend and you're all excited for the week to come. At least I am (thanks to a few coffee but that still counts !!!)
This indicator is inspired from Dollar-Cost-Average-Cost-Basis
EDUCATIONAL POST
The educational post is coming a bit later this afternoon explaining how to use the indicator so I would advise to follow me so that you'll get updated in real-time :) (shameless self-advertising)
1 - What is Dollar-Cost Averaging (DCA)?
Dollar-Cost Averaging is a strategy that allows an investor to buy the same dollar amount of an investment on regular intervals. The purchases occur regardless of the asset's price.
I hope you're hungry because that one is a biggie and gave me a few headaches. Happy that it's getting out of my way finally and I can offer it
This indicator will analyse for the defined date range, how a dollar cost average (DCA) method would have performed vs investing all the hard earnt money at the beginning
2- What's on the menu today ?
Please check this screenshot to understand what you're supposed to see : CLICK ME I'M A SCREENSHOT (I'll repeat this URL one more time below as I noticed some don't read the information on my description and then will come pinging me saying "sir me no understand your indicator, itz buggy sir"
(yes I finally thought about a way to share screenshots on TradingView, took me 4 weeks, I'm slow to understand things apparently)
My indicator works with all asset classes and with the daily/weekly/monthly timeframes
As always, let's review quickly the different fields so that you'll understand how to use it (and I won't get spammed with questions in DM ^^)
- Use current resolution : if checked will use the resolution of the chart
- Timeframe used for DCA : different timeframe to be used if Use current resolution is unchecked
- Amount invested in your local currency : The amount in Fiat money that will be invested at each period selected above
- Starting Date
- Ending Date
- Select a candle level for the desired timeframe : If you want to use the open or close of the selected period above. Might make a diffence when the timeframe is weekly or monthly
3 - Specifications used
I got the idea from this website dcabtc.com and the result shown by this website and my indicator are very interesting in general and for your own trading
The formula used for the DCA calculation is that one : Investopedia Dollar Cost Average
4 - How to interpret the results
"But sir which results ??"...... those ones : CLICK ME I'M A SCREENSHOT :) (strike #2 with the screenshot)
It will draw all the plots and will give you some nice data to analyze in the Data Window section of TradingView
I'm not completely satisfied with the tool yet but the results are very closed to the dcabtc website mentioned above
If you're trading a very bullish asset class (who said crypto ?), it's very interesting to see what a DCA strategy could bring in term of performance. But DCA is not magic, there is a time component which is the day/week/month you'll start to invest (those who invested in crypto beginning of 2018 in altcoins know what I'm talking about and ..............will hate me for this joke)
5 - What's next ?
As said, the educational post is coming next but not only.
Will probably post a strategy tomorrow using this indicator so that you can compare what's performing best between your trading and a dollar cost average method
I'll publish as a protected source this time a more advanced version of that one including DCA forecasts
6 - Suggested alternative (but I'll you doing it)
If you don't want to have this panel in the bottom with the plots and analyze the results in the data window, you can always create an infopanel like shown here Risk-Reward-InfoPanel/ and display all the data there
Hope you'll like it, like me, love it, love me, tip me :)
____________________________________________________________
Feel free to hit the thumbs up as it shows me that I'm not doing this for nothing and will motivate to deliver more quality content in the future. (Meaning... a few likes only = no indicators = Dave enjoying the beach)
- I'm an offically approved PineEditor/LUA/MT4 approved mentor on codementor. You can request a coaching with me if you want and I'll teach you how to build kick-ass indicators and strategies
Jump on a 1 to 1 coaching with me
- You can also hire for a custom dev of your indicator/strategy/bot/chrome extension/python

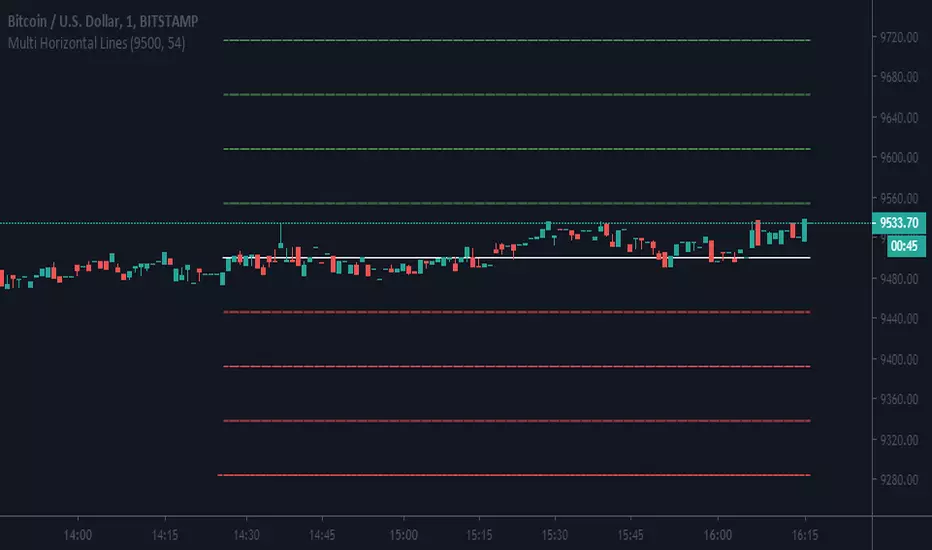
Multi Horizontal LinesAbility to plot multi price lines, go to settings and put price and increment of lines.
Enjoy
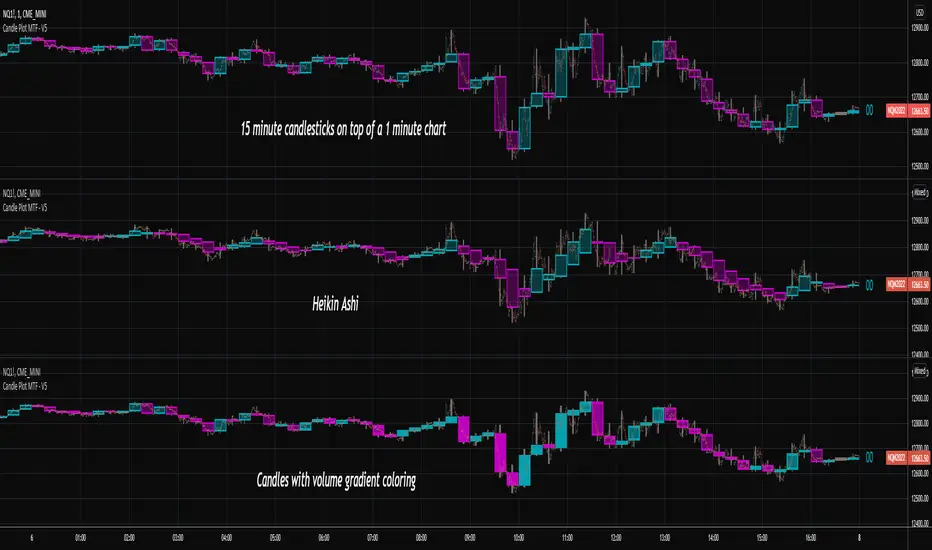
Candlestick Plot MTFPlots the live non-repainting candles for a higher time interval than the chart interval.
Features:
Configuration of the look and feel of the MTF candles.
Live candles update as the price action evolves for the session.
Historical candles can be toggled on/off.
Includes a moving average ribbon that is also MTF, matching the interval chosen.
Please watch this video to understand more:

Multi Timeframe Moving Average Collection | Swing [aamonkey]This is a Multi Timeframe Moving Average Collection (Swing Edition).
Why use it?
- Spot cluster of MAs on one chart
- See support and resistance
- Spot "freefall zones"
In the default settings you will get:
20, 100 and 200 MA of the 1D, W, and the W chart.
The color indicates significance!
From weaker to stronger support/resistance:
green(1D),yellow(W),red(M)
- Length of the MAs is modifiable
- Timeframes of the MAs is modifiable
- Which MAs you want to see
- Colors
Why use this if there is a Swing edition, that can do the same?
You can use this Swing Edition if you don't want to change between the Swing and Scalp timeframes in the settings.
Just turn on of the two on or off.

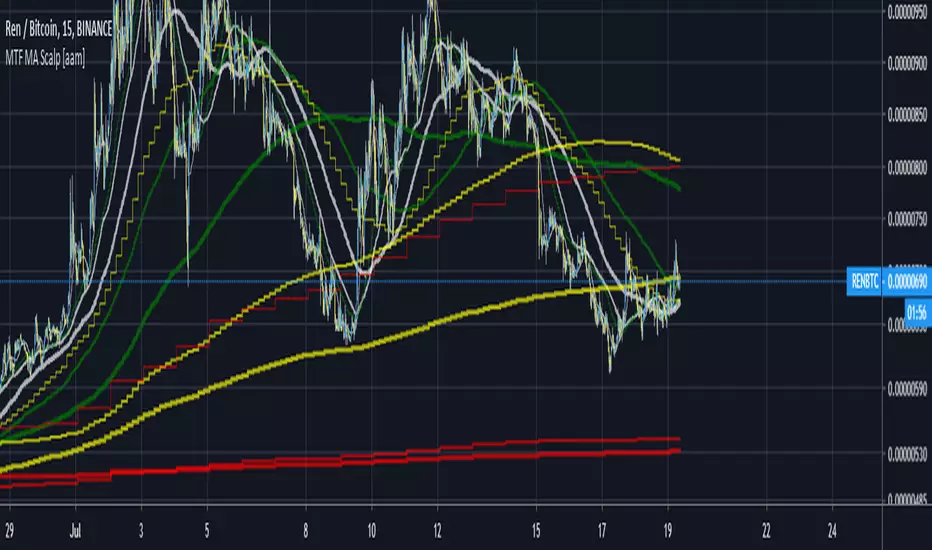
Multi Timeframe Moving Average Collection | Scalp [aamonkey]This is a Multi Timeframe Moving Average Collection (Scalp Edition).
Why use it?
- Spot cluster of MAs on one chart
- See support and resistance
- Spot "freefall zones"
In the default settings you will get:
20, 100 and 200 MA of the 15min, 1h, 4h, and the 1D chart.
The color indicates significance!
From weaker to stronger support/resistance:
white(15min), green(1h),yellow(4h),red(1D)
- Length of the MAs is modifiable
- Timeframes of the MAs is modifiable
- Which MAs you want to see
- Colors
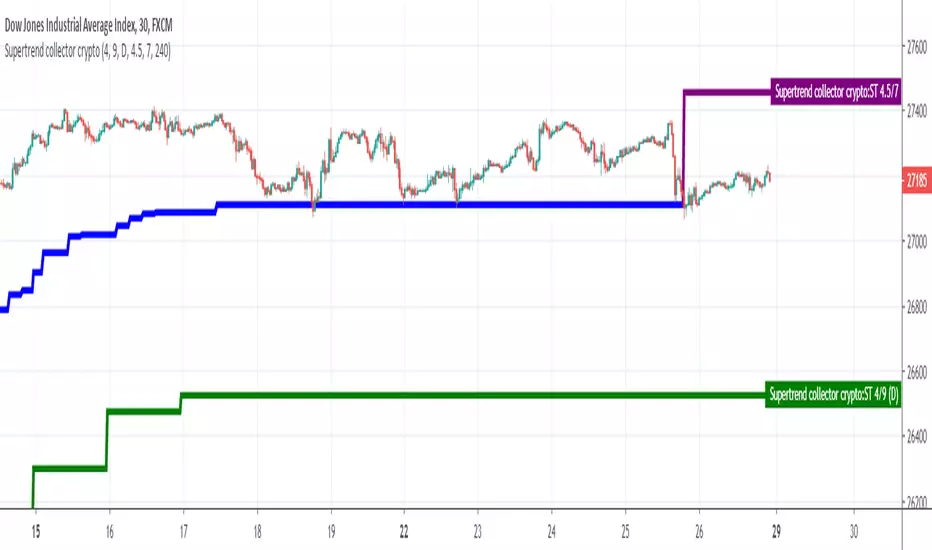
Supertrend collectorHello traders
This is an example of how you can add multiple indicators into a unique one
In this instance, I added two supertrend multitimeframes and draw them on a different timeframe chart
Enjoy
David