Price Level Multi Timeframe [Snowdex]Price Level Multi-Timeframe Indicator
This indicator visualizes important price levels from multiple timeframes (e.g., daily, weekly, monthly) directly on the chart. It helps traders identify significant support and resistance levels for better decision-making.
Features:
Displays price levels for multiple timeframes: daily (1D), weekly (1W), monthly (1M), quarterly (3M), semi-annual (6M), and yearly (12M).
Customizable options to show or hide levels and adjust their colors.
Highlights high, low, and close levels of each timeframe with labels and dotted lines.
Includes options to extend levels visually for better clarity.
Benefits:
Easily compare price levels across timeframes.
Enhance technical analysis with multi-timeframe insights.
Identify key areas of support and resistance dynamically.
Multi-timeframe

Multi Timeframe 8x MA Support Resistance Zones [SiDec]Multi-Timeframe Moving Average Support/Resistance Zones: The Ultimate Trading Power Tool
Indicator Overview
Get ready to elevate your trading game with the Multi-Timeframe Moving Average Support/Resistance Zones indicator. This advanced tool is engineered for traders who want to maximize efficiency without constantly switching between timeframes. By dynamically plotting support and resistance zones using the 21 SMA and 21 EMA, it reveals crucial price levels where trends may pause, reverse, or accelerate—giving you actionable insights in a fraction of the time.
Imagine seeing all the relevant timeframe zones on one chart, without ever needing to flip between timeframes—saving you time and allowing you to focus on what really matters.
Core Features
Dynamic Zones That Adjust in Real-Time:
The area between the 21 EMA and 21 SMA is shaded, forming a "zone" on your chart. This dynamic zone adjusts live as price moves, keeping you in sync with current market behavior across multiple timeframes.
By showing these zones across all your selected timeframes, you can view everything you need at a glance—no time wasted jumping between charts.
All Timeframes, One View:
With the ability to view multiple timeframe zones simultaneously (from 5-minute to Monthly), this tool helps you spot key levels quickly without switching between timeframes. You’ll see how price interacts with these levels across different timeframes without ever having to change charts.
Higher timeframes show broader, more significant zones—giving you the market's big picture—while intraday zones help you fine-tune your entries.
Customisable Like Never Before:
Toggle Timeframes: Only activate the timeframes you care about—no distractions, just pure focus.
Color Your World: Assign different colors to each timeframe for instant visual cues (e.g., blue for Daily, gold for Weekly). This makes it easy to identify key zones across all timeframes at a glance.
Why You Need This Tool
Instant Trend Confirmation: Track how price interacts with multiple timeframe zones to confirm bullish or bearish momentum in real-time.
Confluence = High Confidence: When zones from multiple timeframes overlap, you’ve found a high-probability reversal area. This is where the market is likely to turn, and where your edge lies.
Efficiency at Its Best: No more switching between timeframes—everything you need is in one place, giving you more time to trade and less time spent on analysis.
Configuration Instructions
1.) Timeframe Selection:
Choose which timeframes to display using the Timeframe Selection panel.
Intraday Focus: 5m, 15m, 1H.
Swing/Long-Term Focus: 4H, 12H, Daily, Weekly, Monthly.
Color Coding: Assign a distinct color to each timeframe for instant identification—like having a personal color-coded trading roadmap.
2.) MA Settings:
MA Types:
21 EMA: Perfect for capturing short-term trends and fast price action.
21 SMA: The smooth operator for spotting longer-term trends with more consistency.
Recommended Periods: The 21-period MA works wonders for trend detection across various timeframes. You can also integrate Fibonacci-based MAs (e.g., 55, 233) for enhanced confluence.
3.) Visual Tweaks:
Opacity: Adjust the zone transparency (80-90% opacity keeps it visible yet non-intrusive).
Zone Extensions: Customize how far zones extend backward and forward, capturing the full impact of support/resistance levels.
Labels: Show real-time MA values and timeframe-specific details for further clarity.
Trading Strategies That Pack a Punch
1.) Trend Confirmation:
Uptrend: Price staying above the 21 EMA and 21 SMA suggests a bullish trend.
Downtrend: Price holding below these MAs signals a bearish market.
2.) Zone-Based Reversals:
Entry: Look for price to retrace to a higher timeframe support zone (e.g., Daily 21 SMA) with confirmation from oversold/overbought indicators like RSI.
Exit: Time to sell when price breaks through a critical zone, like the 4H 21 EMA.
3.) Confluence Trading:
Combine the zones with other indicators to amplify your trade setups:
Fibonacci Levels: When a 61.8% retracement lines up with an MA zone, you’ve found a high-confluence area.
Volume Profile: High-volume nodes near key zones strengthen their significance.
Best Practices for Maximum Profit
Focus on Higher Timeframes: Weekly and Monthly zones carry more weight, making them more significant in decision-making.
Avoid Clutter: If you’re trading higher timeframes, disable intraday timeframes like 5m and 15m to keep your chart clear and focused.
Risk Management: Zones are probabilities, not guarantees. Always use stop-loss orders to protect your trades.
Example of a Winning Setup
Scenario:
Price retraces to the 1H 21 EMA zone.
The Daily 21 SMA zone is nearby—talk about confluence!
RSI shows oversold conditions, indicating a potential reversal.
Action:
Enter long on a bullish candlestick pattern (e.g., bullish engulfing).
Set your stop-loss just below the Daily 21 SMA zone.
Target the next higher timeframe resistance.
Performance Considerations
Repainting Risk: Zones might slightly adjust with the formation of new bars, but the changes will typically be minimal.
Enhance with Oscillators: Use momentum indicators like MACD or Stochastic and volume analysis for even more confirmation.
Conclusion
The Multi-Timeframe Moving Average Support/Resistance Zones indicator isn’t just a tool—it’s a game-changer. With the ability to view all relevant timeframe zones on one chart, you can make decisions faster, spot high-confluence areas, and trade with greater precision. The time you save by not switching between timeframes can make all the difference in your trading success.
Maximise your trading edge—harness the power of multi-timeframe analysis, gain more time to trade, and dominate the market like never before. 📊🔍

Power Trend [MacAlgo]Description:
The Power Trend Indicator is a sophisticated technical analysis tool that overlays on your trading charts to identify prevailing market trends. It utilizes a combination of ATR-based trend calculations, moving averages, volume analysis, and momentum indicators to generate reliable buy and sell signals. Additionally, it offers customizable settings to adapt to various trading styles and timeframes.
Key Features:
Adaptive ATR Calculation: Automatically adjusts the ATR (Average True Range) period and multiplier based on the selected timeframe for more accurate trend detection.
Dynamic Trend Lines: Plots continuous trend lines with color-coded bars to visually represent bullish and bearish trends.
Buy/Sell Signals: Generates standard and power buy/sell signals to help you make informed trading decisions.
Volume Analysis: Incorporates average buy and sell volumes to identify strong market movements.
Multiple Timeframe Support: Automatically adjusts the indicator's timeframe or allows for manual selection to suit your trading preferences.
Highlighting: Highlights trending bars for easy visualization of market conditions.
Alerts: Customizable alert conditions to notify you of potential trading opportunities in real-time.
How it Works:
1. ATR-Based Trend Calculation:
ATR Period & Multiplier: Calculates ATR based on user-defined periods and multipliers, dynamically adjusting according to the chart's timeframe.
Trend Determination: Identifies trends as bullish (1) or bearish (-1) based on price movements relative to ATR-based upper (up) and lower (dn) trend lines.
2. Moving Averages:
EMA & SMA: Calculates exponential and simple moving averages to smooth price data and identify underlying trends.
AlphaTrend Line: Combines a 50-period EMA and a 30-period SMA on a 4-hour timeframe to create the AlphaTrend line, providing a robust trend reference.
3. Volume Analysis:
Buy/Sell Volume: Differentiates between buy and sell volumes to gauge market strength.
Average Volume: Compares current volume against average buy/sell volumes to detect significant market movements.
4. Momentum Indicators:
RSI, MACD, OBV: Incorporates Relative Strength Index (RSI), Moving Average Convergence Divergence (MACD), and On-Balance Volume (OBV) to assess momentum and confirm trend strength.
5. Signal Generation:
Standard Signals: Basic buy and sell signals based on trend crossovers.
Power Signals: Enhanced signals requiring multiple conditions (e.g., increased volume, momentum confirmation) for higher confidence trades.
Customization Options:
Tailor the Power Trend Indicator to your specific trading needs with the following settings:
ATR Period: Set the period for ATR calculation (default: 8).
ATR Multiplier: Adjust the ATR multiplier to fine-tune trend sensitivity (default: 3.0).
Source: Choose the price source (e.g., HL2, Close) for calculations.
Change ATR Calculation Method: Toggle between different ATR calculation methods.
Show Buy/Sell Signals: Enable or disable the display of buy and sell signals on the chart.
Highlighting: Turn on or off the bar highlighting feature.
Timeframe Adjustment: Choose between automatic timeframe adjustment or manually set
the indicator's timeframe.
Manual Indicator Timeframe: If manual adjustment is selected, specify the desired timeframe (default: 60 minutes).
Visual Components:
Trend Lines: Continuous lines representing the current trend, color-coded for easy identification (green for bullish, red for bearish, orange for neutral).
Bar Coloring: Bars are colored based on the current trend and its relationship to the AlphaTrend line.
Buy/Sell Triangles: Triangular markers appear on the chart to indicate buy and sell signals.
Power Signals: Larger triangles highlight strong buy and sell opportunities based on multiple confirming factors.
Highlighting: Transparent overlays highlight trending areas to enhance visual clarity.
Alerts:
Stay informed with customizable alerts that notify you of important market movements:
SuperTrend Buy/Sell: Alerts when standard buy or sell signals are generated.
Power Buy/Sell Alerts: Notifications for strong buy or sell signals based on comprehensive conditions.
Trend Direction Change: Alerts when the trend changes from bullish to bearish or vice versa.
How to Use:
Add to Chart: Apply the Power Trend Indicator to your preferred trading chart on TradingView.
Configure Settings: Adjust the input parameters to match your trading style and the timeframe you are analyzing.
Analyze Trends: Observe the trend lines, bar colors, and AlphaTrend line to understand the current market trend.
Follow Signals: Look for buy and sell signals or power signals to identify potential entry and exit points.
Set Alerts: Enable alerts to receive real-time notifications of significant trading opportunities.
Adjust as Needed: Fine-tune the settings based on market conditions and your trading experience.
Important Notes:
Backtesting: While the Power Trend Indicator is built using robust technical analysis principles, it's essential to backtest and validate its performance within your trading strategy.
Market Conditions: The indicator performs best in trending markets. In sideways or highly volatile markets, signal reliability may vary.
Risk Management: Always employ proper risk management techniques when trading based on indicator signals to protect your capital.
Disclaimer:
This indicator is intended for educational purposes only and does not provide financial advice or guarantee future performance. Trading involves risk, and past results are not indicative of future outcomes. Always conduct your own analysis and risk management.

Percent Change HistogramThis indicator shows you percent changes in a super visual way using a color-coded histogram.
Here's how the colors work:
🟩 Dark green = percent change is growing stronger
🟢 Light green = still positive but losing steam
🟥 Dark red = getting more negative
🔴 Light red = negative but improving
The cool part? You can set any lookback period you want. For example:
24 periods on 1H chart = last 24 hours
30 periods on daily = last month
7 periods on daily = last week
Pro tip: You're not locked to your chart's timeframe! Want to see monthly changes while trading on 5min?
No problem.
You can even stack multiple indicators to watch different intervals simultaneously (daily, weekly, monthly) - super helpful for multi-timeframe analysis.
Perfect for spotting momentum shifts across different timeframes without switching between charts.

TVMC - Composite Indicator with Technical RatingsDescription:
The TVMC (Trend, Volume, Momentum, Composite) indicator is a powerful multi-component tool designed to provide traders with a comprehensive understanding of market conditions. By combining four essential technical analysis components—trend, momentum, volume, and volatility—this indicator offers clear and actionable insights to assist in decision-making.
Key Features:
1. Trend Component (TC):
* Based on MACD (Moving Average Convergence Divergence), this component analyzes the relationship between two exponential moving averages (fast and slow) to determine the prevailing market trend.
* The MACD signal is normalized to a range of -1 to +1 for consistency and clarity.
2. Momentum Component (MC):
* Utilizes RSI (Relative Strength Index) to measure the strength and speed of price movements.
* This component highlights overbought or oversold conditions, which may indicate potential market reversals.
3. Volume Confirmation (VC):
* Compares the current trading volume to its moving average over a specified period.
* High volume relative to the average confirms the validity of the current trend.
4. Volatility Filter (VF):
* Uses ATR (Average True Range) to gauge market volatility.
* Adjusts and smooths signals to reduce noise during periods of high volatility.
5. Technical Ratings Integration:
* Incorporates TradingView’s Technical Ratings, allowing users to validate signals using moving averages, oscillators, or a combination of both.
* Users can choose their preferred source of ratings for enhanced signal confirmation.
How It Works:
The TVMC indicator combines the weighted contributions of the Trend, Momentum, and Volume components, further refined by the Volatility Filter. Each component plays a specific role:
* Trend: Identifies whether the market is bullish, bearish, or neutral.
* Momentum: Highlights the strength of price action.
* Volume: Confirms whether the current price action is supported by sufficient trading activity.
* Volatility: Filters out excessive noise in volatile market conditions, providing a smoother and more reliable output.
Visualization:
1. Bullish Signals:
* The indicator line turns green and remains above the zero line, indicating upward momentum.
2. Bearish Signals:
* The indicator line turns red and falls below the zero line, signaling downward momentum.
3. Neutral Signals:
* The line is orange and stays near zero, indicating a lack of strong trend or momentum.
4. Zones:
* Horizontal lines at +30 and -30 mark strong bullish and bearish zones, respectively.
* A zero line is included for clear separation between bullish and bearish signals.
Recommended Usage:
* Best Timeframes: The indicator is optimized for higher timeframes such as 4-hour (H4) and daily (D1) charts.
* Trading Style: Suitable for swing and positional trading.
* Customization: The indicator allows users to adjust all major parameters (e.g., MACD, RSI, volume, and ATR settings) to fit their trading preferences.
Customization Options:
* Adjustable weights for Trend, Momentum, and Volume components.
* Fully configurable settings for MACD, RSI, Volume SMA, and ATR periods.
* Timeframe selection for multi-timeframe analysis.
Important Notes:
1. Originality: The TVMC indicator combines multiple analysis methods into a unique framework. It does not replicate or minimally modify existing indicators.
2. Transparency: The description is detailed enough for users to understand the methodology without requiring access to the code.
3. Clarity: The indicator is explained in a way that is accessible even to users unfamiliar with complex technical analysis tools.
Compliance with TradingView Rules:
* The indicator is written in Pine Script version 5, adhering to TradingView’s language standards.
* The description is written in English to ensure accessibility to the global community, with a clear explanation of all components and functionality.
* No promotional content, links, or unrelated references are included.
* The chart accompanying the indicator is clean and demonstrates its intended use clearly, with no additional indicators unless explicitly explained.

Enhanced Cumulative Volume Delta + MAThe Enhanced Cumulative Volume Delta (CVD) indicator is designed to help traders analyze the cumulative buying and selling pressure in the market by examining the delta between the up and down volume. By tracking this metric, traders can gain insights into the strength of a trend and potential reversals. This indicator uses advanced volume analysis combined with customizable moving averages to provide a more detailed view of market dynamics.
How to Use This Indicator:
Volume Delta Visualization:
The indicator plots the cumulative volume delta (CVD) using color-coded candles, where teal represents positive delta (buying pressure) and soft red represents negative delta (selling pressure).
Moving Averages:
Use the moving averages to smooth the CVD data and identify long-term trends. You can choose between SMA and EMA for each of the three available moving averages. The first and third moving averages are typically used for short-term and long-term trend analysis, respectively, while the second moving average can serve as a medium-term filter.
Arrow Markers:
The indicator will display arrows (green triangle up for crossing above, red triangle down for crossing below) when the CVD volume crosses the 3rd moving average. You can control the visibility of these arrows through the input parameters.
Volume Data:
The indicator provides error handling in case no volume data is available for the selected symbol, ensuring that you're not misled by incomplete data.
Practical Applications:
Trend Confirmation: Use the CVD and moving averages to confirm the overall trend direction and strength. Positive delta and a rising CVD can confirm an uptrend, while negative delta and a falling CVD indicate a downtrend.
Volume Breakouts: The arrows marking when the CVD crosses the 3rd moving average can help you spot potential volume breakouts or reversals, making them useful for entry or exit signals.
Volume Divergence: Pay attention to divergences between price and CVD, as these can often signal potential trend reversals or weakening momentum.

MultiTime Stochastics ProMultiTime Stochastics Pro
This indicator is an enhanced version of the stochastic indicator, featuring two separate stochastics. This functionality allows you to adjust the settings and time frame for each stochastic individually, enabling a more precise analysis of market fluctuations.
The Double Stochastic indicator enables you to simultaneously analyze the market in different time frames with two separate stochastics. One of the standout features of this indicator is that when the chart's time frame changes, each stochastic is displayed according to the time set for it and does not change in other time frames. This feature provides greater flexibility and accuracy in market analysis.
How the Indicator Works
This indicator calculates two separate stochastics:
The first stochastic (K1 and D1) with its own specific time frame and settings.
The second stochastic (K2 and D2) with a different time frame and settings.
These two stochastics are displayed simultaneously on one chart, and overbought and oversold lines are also included.
How to Use
Parameter Adjustment : Adjust the parameters K1 Length, D1 Smoothing, and K1 Time Frame as desired. Do the same for the second stochastic.
Signal Analysis : Analyze buy and sell signals based on the stochastic values and the overbought and oversold lines.
Advantages
Greater Precision : With two separate stochastics, you can follow market fluctuations with greater accuracy.
Flexibility : The ability to individually set the time frame and parameters for each stochastic makes this indicator highly flexible.
Stronger Signals : The simultaneous display of two stochastics allows you to receive stronger buy and sell signals.
Multi-time frame Analysis : The ability to analyze the market in different time frames simultaneously.
This indicator is suitable for traders seeking more precise and flexible market analysis tools. I hope these explanations help you publish your indicator in the best possible way!

MTF Fractal Bias Confluence DetectorMTF Fractal Bias Confluence Detector
This indicator, the MTF Fractal Bias Confluence Detector, is based on the idea that the market exhibits fractal behaviour. The origin of the idea traces back to 1963, when Benoit Mandelbrot analyzed the fluctuations in cotton prices over a time series starting in 1900, discovering that price changes exhibited scale-invariant patterns. This means that the curve representing daily price changes mirrored the shape of monthly price changes, highlighting the fractal nature of market behaviour. When applied to swing points across multiple timeframes (MTF), this concept suggests that swing points demonstrate similar patterns regardless of the timeframe being analyzed. These self-similar fractal structures provide traders with insights into market reversals and trends, making them a powerful tool for multi-timeframe analysis.
A Swing Point is made up of three main parts: a move away from the last Break level; forming a peak (pivot point) with a Fakeout of the peak (explained through an example later); and a subsequent move away from it. These swing points recur across all timeframes as part of cyclical momentum patterns, meaning each swing point gives rise to a new cycle of market movement. Due to the fractal nature of the market, larger cycles encompass multiple smaller ones.
The theory behind the Fractal Bias Confluence Detector utilizes the idea that the market movements are fractal in nature and illustrates how such swing points can be identified across MTFs. To do so, we examine the Peak Fakeouts within these cycles, as they form. It is not possible to know in advance how long each of these moves will last, but a Swing Point will often occur with a Peak Fakeout. Therefore, the most critical element is to identify the Peak Fakeout.
The snapshot below captures a Peak Fakeout, as discussed earlier.
Similarly, the following snapshot shows various possible breakdowns of Higher Time Frame (HTF) cycles into smaller Lower Time Frame (LTF) movements. The chart contains a white table(not part of the indicator and shown for illustration purposes only).
To further illustrate. Consider the combination of Time Frames (TF) from the 2nd row (from the above snapshot). Cycle TF (1M), Setup TF (1W), Momentum TF (1D) etc.
Price movements in the 1M TF highlight the direction in which HTF traders are pushing the market. Often, when markets have broken out of a level, they tend to form a peak and can then pull back towards the prior breakout level. Once the pullback is beyond the last breakout level, in the opposite direction, we may say the peak formation is created, and directional bias has changed. This is also called Peak Fakeout. Due to the fractal nature of the market, Swing Points on the HTF will often constitute multiple Swing Points on the LTF, though they are not always in sync. However, after such peak formation, there is a high probability that the price might move away from the peak for at least 1 candle (in the cycle TF). This theory illustrates that once a new cycle is in play, we can then look at 1W (Setup TF) to look for possible in-sync movements, at least within that 1 candle of the HTF. Repeating the same for further lower TFs, we may arrive at a confluence of Fractal Bias and see how the movements in LTF are driven by the HTF momentum.
Another example within the chart:
Note: The above examples are just for illustration purposes, and other permutations and combinations of movements across multiple TFs are also possible.
This indicator aims to help users identify such fractal-bias-confluences, so that they can leverage the fractal nature of the market to get a holistic view. To do so, the indicator displays how the market has moved across multiple time frames, with respect to different historical levels.
Features:
1. The bias summary table
The following snapshot depicts the bias summary table at the bottom right of the chart.
1.1. Workings: The table will display, for various TFs, in the first four (starting from "current" to Prev ) rows, one of the following.
"F/H" , " Acronym for the failed break of the previous high",
"F/L" , " Acronym for the failed break of the previous low",
"B/H" , " Acronym for the break of the previous high",
"B/L" , " Acronym for the break of the previous low",
"IN" , " Acronym for an inside candle (never broke high or low of perv candle)",
"OT" , " Acronym for an outside candle (broke both high and low of previous candle and closing price is in between previous high and low)".
Note: these acronyms are customizable according to the user's choice of terminology in any language, as shown in the snapshot below.
1.1.1 In the above snapshot, the 1st row, called "Current", shows how the current candle is evolving with respect to the previous one. The "previous" row shows how the previous candle closed with respect to the pre-previous one. The next two rows represent the bias of the pre-previous and pre-pre-previous in a similar manner. By default, the bias is updated in real-time, even for the already closed historical candles. For example, if the previous 4H candle closed as a B/H and the current price then comes below the pre-previous 4H candle high, then the bias of the previous candle will get updated to F/H. This informs the user that the break above the pre-previous high has failed. However, the user has the option to turn this off. The information in these four rows shows the user how the market is moving currently and how it evolved before reaching the current price levels.
Note: The calculation done by the indicator is to keep track of how the price is moving with respect to the last candle levels in real-time. This means if the price first goes above the previous high and then goes below the previous low, the indicator is equipped to display what happened in the most recent time. The snapshot below shows the option to turn on/off such updates in the bias summary table.
Note: While the bias summary table is turned on, the user also has the option to turn off Prev and Prev rows, as shown in the snapshot below.
1.1.2 The 2nd to last row, called CL/CS(Consecutive Long/Short), shows whether consecutive (2+) breaks of high/low happened or not in one direction without taking out the previous candle's range in the opposite direction. When conditions are met, it will show the number of times the price has been pushed in one direction (in the above manner), followed by "L" for long and "S" for short, for each TF, for example, "4L". It gets updated in real-time for each push in the same direction. Furthermore, a good analogy of "4L" on an HTF is 4 consecutive Break of Structure (BOS) (in the same direction) on LTF, without a Change of Character (CHoCH). Another example would be Stacey Burke's 3 consecutive rises that can be mapped in the indicator, if the conditions are met for "3L" for a given TF.
1.1.3 The last row, FRC/FGC, stands for the first red/green candle. It shows whether the last candle of a TF has closed as green (i.e., close>open) after posting two red candles (i.e., close

ADVDEC.US OSCILLATORThis Pine Script implements an ADVDEC.US Oscillator, which is an indicator designed to analyze the Advance-Decline index (ADVDEC.US) with multiple smoothing techniques and timeframes. Here's what the script does:
Symbol and Inputs:
- The script is based on the ADVDEC.US index, which measures the difference between advancing and declining stocks.
Users can adjust several settings:
- Lookback Period: Defines the number of periods over which the highest and lowest values of the ADVDEC.US index are calculated.
- Smoothing Period: Smooths the oscillator with a simple moving average (SMA) to reduce market noise.
- EMA Period: Applies an Exponential Moving Average (EMA) to the smoothed oscillator for further trend analysis.
- MTF Period: Allows for fetching data from a specified timeframe (default is 5 minutes).
Calculation:
- It calculates the highest and lowest values of the ADVDEC index over the defined lookback period.
- It normalizes the ADVDEC value into a percentage between 0 and 100, representing the position of the current value relative to the range over the lookback period.
- This raw oscillator is then smoothed with an SMA to reduce choppiness.
- Finally, an EMA is calculated on the smoothed oscillator to emphasize the trend direction.
Thresholds:
- Horizontal lines are plotted at key levels (70, 30, and 50) for visual reference, offering an "RSI-style" interpretation of the oscillator.
- The upper and lower thresholds can indicate overbought/oversold conditions, while the midline helps identify neutral levels.
Visualization:
- The smoothed oscillator is plotted in blue.
- The EMA of the smoothed oscillator is plotted in orange.
In summary, this indicator aims to visualize the relationship between advancing and declining stocks with added smoothing and trend-following elements, providing an easy-to-interpret oscillator that can be used for market analysis or decision-making.

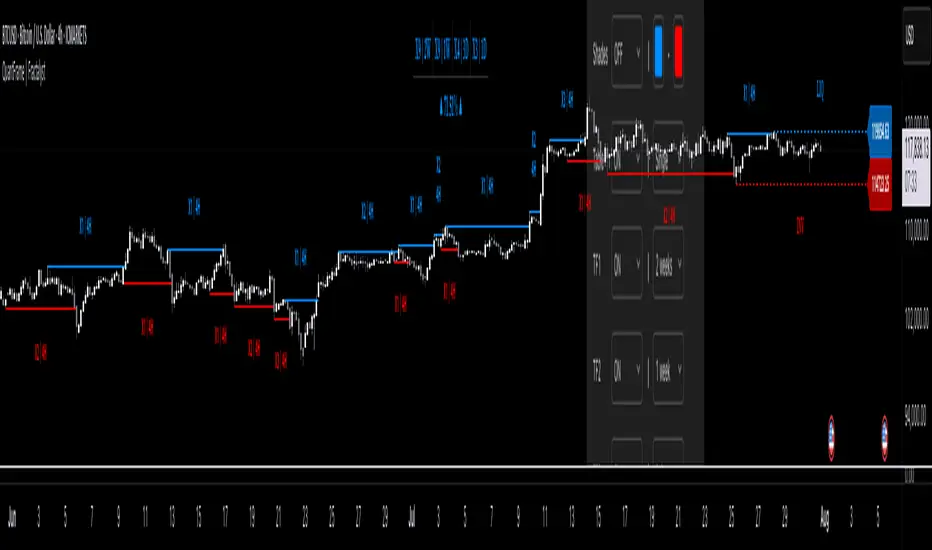
QuantFrame | FractalystWhat’s the purpose of this indicator?
The purpose of QuantFrame is to provide traders with a systematic approach to analyzing market structure, eliminating subjectivity, and enhancing decision-making. By clearly identifying and labeling structural breaks, QuantFrame helps traders:
1. Refine Market Analysis: Transition from discretionary market observation to a structured framework.
2. Identify Key Levels: Highlight important liquidity and invalidation zones for potential entries, exits, and risk management.
3. Streamline Multi-Timeframe Analysis: Track market trends and structural changes across different timeframes seamlessly.
4. Enhance Consistency: Reduce guesswork by following a rule-based methodology for identifying structural breaks.
How Does This Indicator Identify Market Structure?
1. Swing Detection
• The indicator identifies key swing points on the chart. These are local highs or lows where the price reverses direction, forming the foundation of market structure.
2. Structural Break Validation
• A structural break is flagged when a candle closes above a previous swing high (bullish) or below a previous swing low (bearish).
• Break Confirmation Process:
To confirm the break, the indicator applies the following rules:
• Valid Swing Preceding the Break: There must be at least one valid swing point before the break.
3. Numeric Labeling
• Each confirmed structural break is assigned a unique numeric ID starting from 1.
• This helps traders track breaks sequentially and analyze how the market structure evolves over time.
4. Liquidity and Invalidation Zones
• For every confirmed structural break, the indicator highlights two critical zones:
1. Liquidity Zone (LIQ): Represents the structural liquidity level.
2. Invalidation Zone (INV): Acts as Invalidation point if the structure fails to hold.
What do the extremities show us on the charts?
When using QuantFrame for market structure analysis, the extremities—Liquidity Level (LIQ) and Invalidation Level (INV)—serve as critical reference points for understanding price behavior and making informed trading decisions.
Here's a detailed explanation of what these extremities represent and how they function:
Liquidity Level (LIQ)
Definition: The Liquidity Level is a key price zone where the market is likely to retest, consolidate, or seek liquidity. It represents areas where orders are concentrated, making it a high-probability reaction zone.
Purpose: Traders use this level to anticipate potential pullbacks or continuation patterns. It helps in identifying areas where price may pause or reverse temporarily due to the presence of significant liquidity.
Key Insight: If a candle closes above or below the LIQ, it results in another break of structure (BOS) in the same direction. This indicates that price is continuing its trend and has successfully absorbed liquidity at that level.
Invalidation Level (INV)
Definition: The Invalidation Level marks the threshold that, if breached, signifies a structural shift in the market. It acts as a critical point where the current market bias becomes invalid.
Purpose: This level is often used as a stop-loss or re-evaluation point for trading strategies. It ensures that traders have a clear boundary for risk management.
Key Insight: If a candle closes above or below the INV, it signals a shift in market structure:
A closure above the INV in a bearish trend indicates a shift from bearish to bullish bias.
A closure below the INV in a bullish trend indicates a shift from bullish to bearish bias.
What does the top table display?
The top table in QuantFrame serves as a multi-timeframe trend overview. Here’s what it provides:
1. Numeric Break IDs Across Multiple Timeframes:
• Each numeric break corresponds to a confirmed structural break on a specific timeframe, helping traders track the most recent breaks systematically.
2. Trend Direction via Text Color:
• The color of the text reflects the current trend direction:
• Blue indicates a bullish structure.
• Red signifies a bearish structure.
3. Higher Timeframe Insights Without Manual Switching:
• The table eliminates the need to switch between timeframes by presenting a consolidated view of the market trend across multiple timeframes, saving time and improving decision-making.
What is the Multi-Timeframe Trend Score (MTTS)?
MTTS is a score that quantifies trend strength and direction across multiple timeframes.
How does MTTS work?
1. Break Detection:
• Analyzes bullish and bearish structural breaks on each timeframe.
2. Trend Scoring:
• Scores each timeframe based on the frequency and quality of bullish/bearish breaks.
3. MTTS Calculation:
• Averages the scores across all timeframes to produce a unified trend strength value.
How is MTTS interpreted?
• ⬆ (Above 50): Indicates an overall bullish trend.
• ⬇ (Below 50): Suggests an overall bearish trend.
• ⇅ (Exactly 50): Represents a neutral or balanced market structure.
How to Use QuantFrame?
1. Implement a Systematic Market Structure Framework:
• Use QuantFrame to analyze market structure objectively by identifying key structural breaks and marking liquidity (LIQ) and invalidation (INV) zones.
• This eliminates guesswork and provides a clear framework for understanding market movements.
2. Leverage MTTS for Directional Bias:
• Refer to the MTTS table to identify the multi-timeframe directional bias, giving you the broader market context.
• Align your trading decisions with the overall trend or structure to improve accuracy and consistency.
3. Apply Your Preferred Entry Model:
• Once the market context is clear, use your preferred entry model to capitalize on the identified structure and trend.
• Manage trades dynamically as price delivers, using the provided liquidity and invalidation zones for risk management.
What Makes QuantFrame Original?
1. Objective Market Structure Analysis:
• Unlike subjective methods, QuantFrame uses a rule-based approach to identify structural breaks, ensuring consistency and reducing emotional decision-making.
2. Multi-Timeframe Integration:
• The MTTS table consolidates trend data across multiple timeframes, offering a bird’s-eye view of market trends without the need to switch charts manually.
• This unique feature allows traders to align strategies with higher-timeframe trends for more informed decision-making.
3. Liquidity and Invalidation Zones:
• Automatically marks Liquidity (LIQ) and Invalidation (INV) zones for every structural break, providing actionable levels for entries, exits, and risk management.
• These zones help traders define their risk-reward setups with precision.
4. Dynamic Trend Scoring (MTTS):
• The Multi-Timeframe Trend Score (MTTS) quantifies trend strength and direction across selected timeframes, offering a single, consolidated metric for market sentiment.
• This score is visualized with intuitive symbols (⬆, ⬇, ⇅) for quick decision-making.
5. Numeric Labeling of Breaks:
• Each structural break is assigned a unique numeric ID, making it easy to track, analyze, and backtest specific market scenarios.
6. Systematic Yet Flexible:
• While it provides a structured framework for market analysis, QuantFrame seamlessly integrates with any trading style. Traders can use it alongside their preferred entry models, adapting it to their unique strategies.
7. Enhanced Market Context:
• By combining structural insights with directional bias (via MTTS), the indicator equips traders with a complete market context, enabling them to make better-informed decisions.
Terms and Conditions | Disclaimer
Our charting tools are provided for informational and educational purposes only and should not be construed as financial, investment, or trading advice. They are not intended to forecast market movements or offer specific recommendations. Users should understand that past performance does not guarantee future results and should not base financial decisions solely on historical data.
Built-in components, features, and functionalities of our charting tools are the intellectual property of @Fractalyst use, reproduction, or distribution of these proprietary elements is prohibited.
By continuing to use our charting tools, the user acknowledges and accepts the Terms and Conditions outlined in this legal disclaimer and agrees to respect our intellectual property rights and comply with all applicable laws and regulations.
HTF CandlesHTF Candles, Plot of a Higher/Lower Timeframe Candles on any chart.
This HTF / LTF candle plot displays the previous 3 daily candles with the current update of the price with reference to a lower time frame.
Candles includes 3 Candles of HTF
last HTF candle includes 4 previous candles from LTF
Candle High Low Open Close are plotted.
these OHLC values act as Support and Resistance With reference to current Price.
very useful in making HTF and LTF analysis with reference to current timeframe.

goose's session + killzone indicatorA powerful, multi-functional TradingView script designed for forex traders. It visually delineates major market sessions—Asia, London, and New York—on the chart, provides customizable session ranges, pip range counters, and configurable “killzone” markers. The indicator allows users to switch between a traditional line-and-fill style and a historical box style for session visualization, offering both real-time and historical context of market ranges.
Key Features:
1. Session Visualization Options:
• Lines & Fill Style:
• Highlights active sessions using dynamic lines and filled areas that update in real-time.
• Displays session high, low, and mid-range boundaries with customizable colors, border widths, and line styles.
• Historical Boxes Style:
• Creates and retains boxes for each past session, enabling users to review historical session ranges over extended periods.
• Each session box is drawn with user-defined fill and border colors, opacity, and line styles, anchored to the session’s high, low, and timeframe.
• Supports viewing multiple historical sessions at once, up to a configurable limit.
2. Pip Range Counters:
• Displays the range of pips for each active session, anchored to a fixed position near the bottom-right corner of the session.
• Uses arrow-style labels (label.style_label_up/down) to maintain a stable visual offset relative to the session, minimizing movement during vertical zoom.
• Customizable text size, color, and vertical offset, ensuring the pip counter remains legible and unobtrusive.
3. Killzone Lines:
• Allows users to define up to 15 custom “killzone” times with specific line colors, styles, and optional labels.
• Each killzone is drawn precisely when the price crosses the user-specified time, marking important market events or transitions.
4. User Configurations:
• Session Times: Fully adjustable start and end times for Asian, London, and New York sessions.
• Color & Style Settings:
• Customizable fill and border colors (with adjustable opacity) for each session style.
• User-friendly dropdowns and checkboxes for setting line styles, widths, and text sizes.
• Display Mode Selector:
• A dropdown (sessionStyle) lets users toggle between “Lines & Fill” and “Historical Boxes” for session visualization.
• Pip Counter and Killzone Settings:
• Options to show or hide pip counters, match label colors to session fills, and configure killzone appearance individually.
5. Robust Utility Functions:
• Functions to parse user-input times, determine if the current time falls within a session, and calculate session ranges.
• Historical session logic that detects session transitions and creates/upgrades boxes accordingly.
How It Works:
• Session Style Selection:
• Users choose their preferred visualization style via the sessionStyle dropdown.
• If “Lines & Fill” is selected, the indicator plots dynamic lines and fills during active sessions.
• If “Boxes” is selected, the indicator creates historical boxes that outline the range of each past session, persisting on the chart until session boundaries change.
• Pip Counter Labeling:
• During an active session, the pip counter calculates the range between the session’s high and low and displays it as text positioned just below the bottom-right corner of the session.
• The use of arrow-style labels ensures the text remains at a stable visual distance from the session’s outline, even when zooming vertically.
• Killzones:
• Users can define specific times (“killzones”) where important market events occur.
• When the price crosses these times, the script draws lines and optional labels with user-defined appearance settings.
Ideal Use Cases:
• Real-Time Trading: Quickly identify current session ranges, pip sizes, and crucial killzone markers during live trading.
• Historical Analysis: Switch to Historical Boxes to review past session ranges over days, weeks, or months, aiding in pattern recognition and strategy refinement.
• Customization: Tailor the appearance to match personal preferences or chart themes, including colors, styles, line widths, and label sizes.
This comprehensive indicator combines real-time session tracking with historical range visualization and customizable killzones. Its dual display modes, extensive settings, and stable pip counter labels make it a versatile tool for forex traders seeking to analyze market sessions both in the moment and retrospectively.

Intelligent Support & Resistance Lines (MTF)This script automatically detects and updates key Support & Resistance (S/R) levels using a higher timeframe (MTF) approach. By leveraging volume confirmation, levels are only identified when significant volume (relative to the SMA of volume) appears. Each level is drawn horizontally in real time, and whenever the market breaks above a resistance level (and retests it), the script automatically converts that resistance into support. The opposite occurs if the market breaks below a support level.
Key Features:
Multi-Timeframe (MTF) Data
Select a higher timeframe for more robust S/R calculations.
The script fetches High, Low, Volume, and SMA of Volume from the chosen timeframe.
Automatic Role Reversal
Resistance becomes Support if a breakout retest occurs.
Support becomes Resistance if a breakdown retest occurs.
Dynamic Line Width & Labeling
Each S/R line’s thickness increases with additional touches, making frequently tested levels easier to spot.
Labels automatically display the number of touches (e.g., “R 3” or “S 2”) and can have adjustable text size.
Volume Threshold
Only significant pivots (where volume exceeds a specified multiplier of average volume) are plotted, reducing noise.
Horizontal Offset for Clarity
Lines are drawn with timestamps instead of bar_index, ensuring that old levels remain visible without chart limitations.
Adjustable Maximum Levels
Maintain a clean chart by limiting how many S/R lines remain at once.
How It Works:
Pivot Detection: The script identifies swing highs and lows from the higher timeframe (timeframeSR).
Volume Check: Only pivots with volume ≥ (SMA Volume * volumeThreshold) qualify.
Line Creation & Updates: New lines are drawn at these pivots, labeled “R #” or “S #,” indicating how many times they’ve been touched.
Role Reversal: If price breaks above a resistance and retests it from above, that line is removed from the resistance array and re-created in the support array (and vice versa).
Inputs:
Timeframe for S/R: Choose the higher timeframe for S/R calculations.
Swing Length: Number of bars to consider in a pivot calculation.
Minimum Touches: Minimum required touches before drawing or updating a level.
Volume Threshold (Multiplier): Determines how much volume (relative to SMA) is needed to confirm a pivot.
Maximum Number of Levels: Caps how many S/R lines can be shown at once.
Color for Resistance & Color for Support: Customize your preferred colors for lines and labels.
Label Size: Select from "tiny", "small", "normal", "large", or "huge" to resize the labels.
Disclaimer:
This script is intended for educational purposes and should not be interpreted as financial or investment advice. Always conduct your own research or consult a qualified professional before making trading decisions.

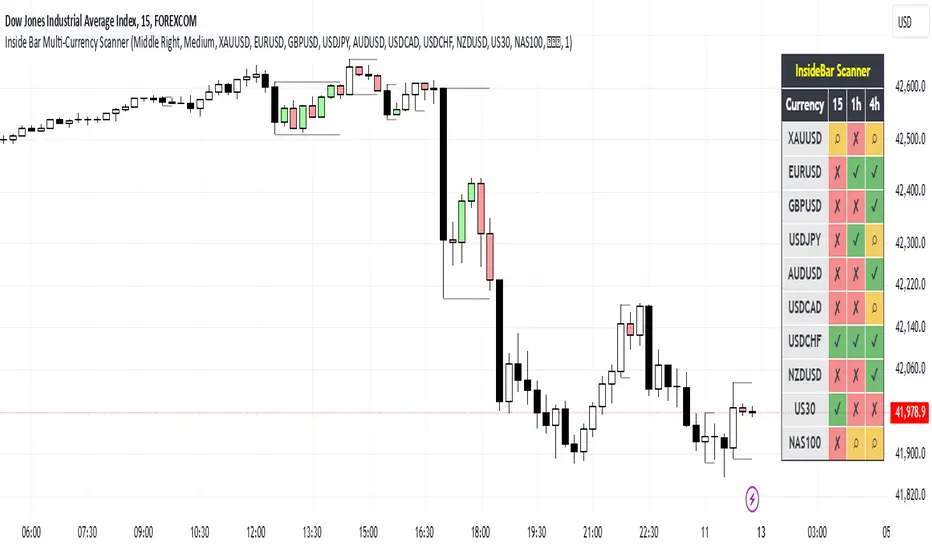
Inside Bar Multi-Currency ScannerDescription:
This script is an Inside Bar Scanner that allows you to monitor multiple currency pairs across different timeframes (15 minutes, 1 hour, and 4 hours). Its main features include:
Inside Bar Detection:
An Inside Bar is a candlestick where both the High and Low are within the range of the previous candle.
The script automatically identifies Inside Bars and displays the results in a table.
Customizable Timeframes:
Supports scanning in 15-minute, 1-hour, and 4-hour timeframes.
Results are displayed for each timeframe separately.
Multi-Currency Support:
Scan up to 10 currency pairs simultaneously.
Currency pairs are customizable and selected by the user.
Candle Coloring:
Inside Bars are highlighted with colors:
Semi-transparent green for bullish Inside Bars.
Semi-transparent red for bearish Inside Bars.
Colors are customizable and selected by the user.
Alerts:
Custom alerts for detecting Inside Bars in selected timeframes.
Receive notifications when an Inside Bar is detected in any of the selected currency pairs.
How to Use:
Select your desired currency pairs from the Scanner Currencies section.
Enable your preferred timeframes in the Scanner Timeframe section.
The script will display a table of results with Inside Bar information for each currency pair and timeframe.
Optionally, customize the candle colors in the Scanner InsideBar Color section.
Additional Explanation for Timeframe Status:
In each selected timeframe, there are three possible states for the candles:
Previous Candle is an Inside Bar:
Displayed with a green background and the symbol ✔.
Previous Candle is NOT an Inside Bar:
Displayed with a red background and the symbol ✘.
Current Candle is an Inside Bar:
Displayed with an orange background and the symbol ⌕.
These visual indicators provide a clear and quick overview of the Inside Bar status for each selected currency pair and timeframe.
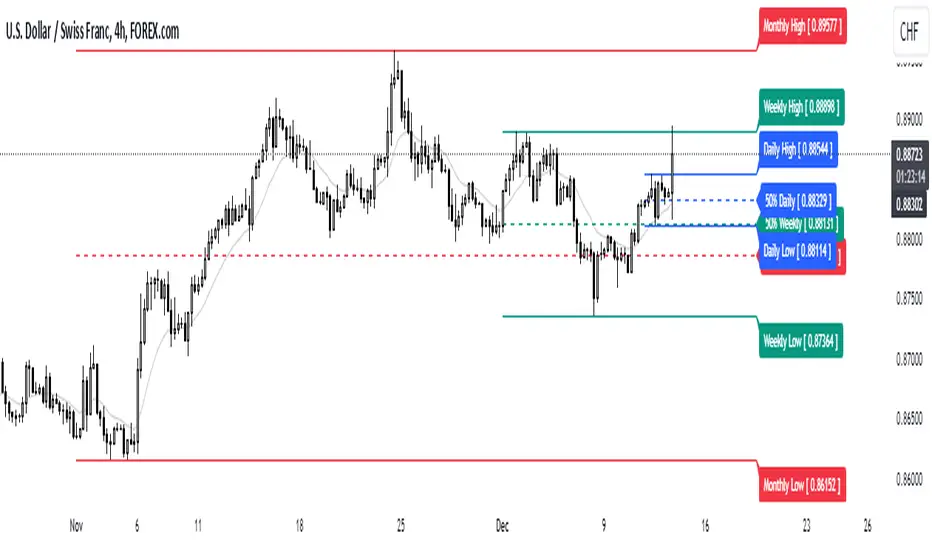
High/Mid/Low of the Previous Month, Week and Day + MAIntroducing the Ultimate Price Action Indicator
Take your trading to the next level with this feature-packed indicators. Designed to provide key price insights, this tool offers:
- Monthly, Weekly, and Daily Levels : Displays the High, Midpoint, and Low of the previous month, week, and day.
- Logarithmic Price Lines : Option to plot price levels logarithmically for enhanced accuracy.
- Customizable Labels : Display labels on price lines for better clarity. (This feature is optional.)
- Dual Moving Averages : Add two customizable Moving Averages (Simple, Exponential, or Weighted) directly on the price chart. (This feature is optional.)
This code combines features from the Moving Average Exponential and Daily Weekly Monthly Highs & Lows (sbtnc) indicators, with custom modifications to implement unique personal ideas.
Perfect for traders who want to combine precision with simplicity. Whether you're analyzing historical levels or integrating moving averages into your strategy, this indicator provides everything you need for informed decision-making.
To prevent change chart scale, right click on Price Scale and enable "Scale price chart only"
Multi-Timeframe Stochastic Alert [tradeviZion]# Multi-Timeframe Stochastic Alert : Complete User Guide
## 1. Introduction
### What is the Multi-Timeframe Stochastic Alert?
The Multi-Timeframe Stochastic Alert is an advanced technical analysis tool that helps traders identify potential trading opportunities by analyzing momentum across multiple timeframes. It combines the power of the stochastic oscillator with multi-timeframe analysis to provide more reliable trading signals.
### Key Features and Benefits
- Simultaneous analysis of 6 different timeframes
- Advanced alert system with customizable conditions
- Real-time visual feedback with color-coded signals
- Comprehensive data table with instant market insights
- Motivational trading messages for psychological support
- Flexible theme support for comfortable viewing
### How it Can Help Your Trading
- Identify stronger trends by confirming momentum across multiple timeframes
- Reduce false signals through multi-timeframe confirmation
- Stay informed of market changes with customizable alerts
- Make more informed decisions with comprehensive market data
- Maintain trading discipline with clear visual signals
## 2. Understanding the Display
### The Stochastic Chart
The main chart displays three key components:
1. ** K-Line (Fast) **: The primary stochastic line (default color: green)
2. ** D-Line (Slow) **: The signal line (default color: red)
3. ** Reference Lines **:
- Overbought Level (80): Upper dashed line
- Middle Line (50): Center dashed line
- Oversold Level (20): Lower dashed line
### The Information Table
The table provides a comprehensive view of stochastic readings across all timeframes. Here's what each column means:
#### Column Explanations:
1. ** Timeframe **
- Shows the time period for each row
- Example: "5" = 5 minutes, "15" = 15 minutes, etc.
2. ** K Value **
- The fast stochastic line value (0-100)
- Higher values indicate stronger upward momentum
- Lower values indicate stronger downward momentum
3. ** D Value **
- The slow stochastic line value (0-100)
- Helps confirm momentum direction
- Crossovers with K-line can signal potential trades
4. ** Status **
- Shows current momentum with symbols:
- ▲ = Increasing (bullish)
- ▼ = Decreasing (bearish)
- Color matches the trend direction
5. ** Trend **
- Shows the current market condition:
- "Overbought" (above 80)
- "Bullish" (above 50)
- "Bearish" (below 50)
- "Oversold" (below 20)
#### Row Explanations:
1. ** Title Row **
- Shows "🎯 Multi-Timeframe Stochastic"
- Indicates the indicator is active
2. ** Header Row **
- Contains column titles
- Dark blue background for easy reading
3. ** Timeframe Rows **
- Six rows showing different timeframe analyses
- Each row updates independently
- Color-coded for easy trend identification
4. **Message Row**
- Shows rotating motivational messages
- Updates every 5 bars
- Helps maintain trading discipline
### Visual Indicators and Colors
- ** Green Background **: Indicates bullish conditions
- ** Red Background **: Indicates bearish conditions
- ** Color Intensity **: Shows strength of the signal
- ** Background Highlights **: Appear when alert conditions are met
## 3. Core Settings Groups
### Stochastic Settings
These settings control the core calculation of the stochastic oscillator.
1. ** Length (Default: 14) **
- What it does: Determines the lookback period for calculations
- Higher values (e.g., 21): More stable, fewer signals
- Lower values (e.g., 8): More sensitive, more signals
- Recommended:
* Day Trading: 8-14
* Swing Trading: 14-21
* Position Trading: 21-30
2. ** Smooth K (Default: 3) **
- What it does: Smooths the main stochastic line
- Higher values: Smoother line, fewer false signals
- Lower values: More responsive, but more noise
- Recommended:
* Day Trading: 2-3
* Swing Trading: 3-5
* Position Trading: 5-7
3. ** Smooth D (Default: 3) **
- What it does: Smooths the signal line
- Works in conjunction with Smooth K
- Usually kept equal to or slightly higher than Smooth K
- Recommended: Keep same as Smooth K for consistency
4. ** Source (Default: Close) **
- What it does: Determines price data for calculations
- Options: Close, Open, High, Low, HL2, HLC3, OHLC4
- Recommended: Stick with Close for most reliable signals
### Timeframe Settings
Controls the multiple timeframes analyzed by the indicator.
1. ** Main Timeframes (TF1-TF6) **
- TF1 (Default: 10): Shortest timeframe for quick signals
- TF2 (Default: 15): Short-term trend confirmation
- TF3 (Default: 30): Medium-term trend analysis
- TF4 (Default: 30): Additional medium-term confirmation
- TF5 (Default: 60): Longer-term trend analysis
- TF6 (Default: 240): Major trend confirmation
Recommended Combinations:
* Scalping: 1, 3, 5, 15, 30, 60
* Day Trading: 5, 15, 30, 60, 240, D
* Swing Trading: 15, 60, 240, D, W, M
2. ** Wait for Bar Close (Default: true) **
- What it does: Controls when calculations update
- True: More reliable but slightly delayed signals
- False: Faster signals but may change before bar closes
- Recommended: Keep True for more reliable signals
### Alert Settings
#### Main Alert Settings
1. ** Enable Alerts (Default: true) **
- Master switch for all alert notifications
- Toggle this off when you don't want any alerts
- Useful during testing or when you want to focus on visual signals only
2. ** Alert Condition (Options) **
- "Above Middle": Bullish momentum alerts only
- "Below Middle": Bearish momentum alerts only
- "Both": Alerts for both directions
- Recommended:
* Trending Markets: Choose direction matching the trend
* Ranging Markets: Use "Both" to catch reversals
* New Traders: Start with "Both" until you develop a specific strategy
3. ** Alert Frequency **
- "Once Per Bar": Immediate alerts during the bar
- "Once Per Bar Close": Alerts only after bar closes
- Recommended:
* Day Trading: "Once Per Bar" for quick reactions
* Swing Trading: "Once Per Bar Close" for confirmed signals
* Beginners: "Once Per Bar Close" to reduce false signals
#### Timeframe Check Settings
1. ** First Check (TF1) **
- Purpose: Confirms basic trend direction
- Alert Triggers When:
* For Bullish: Stochastic is above middle line (50)
* For Bearish: Stochastic is below middle line (50)
* For Both: Triggers in either direction based on position relative to middle line
- Settings:
* Enable/Disable: Turn first check on/off
* Timeframe: Default 5 minutes
- Best Used For:
* Quick trend confirmation
* Entry timing
* Scalping setups
2. ** Second Check (TF2) **
- Purpose: Confirms both position and momentum
- Alert Triggers When:
* For Bullish: Stochastic is above middle line AND both K&D lines are increasing
* For Bearish: Stochastic is below middle line AND both K&D lines are decreasing
* For Both: Triggers based on position and direction matching current condition
- Settings:
* Enable/Disable: Turn second check on/off
* Timeframe: Default 15 minutes
- Best Used For:
* Trend strength confirmation
* Avoiding false breakouts
* Day trading setups
3. ** Third Check (TF3) **
- Purpose: Confirms overall momentum direction
- Alert Triggers When:
* For Bullish: Both K&D lines are increasing (momentum confirmation)
* For Bearish: Both K&D lines are decreasing (momentum confirmation)
* For Both: Triggers based on matching momentum direction
- Settings:
* Enable/Disable: Turn third check on/off
* Timeframe: Default 30 minutes
- Best Used For:
* Major trend confirmation
* Swing trading setups
* Avoiding trades against the main trend
Note: All three conditions must be met simultaneously for the alert to trigger. This multi-timeframe confirmation helps reduce false signals and provides stronger trade setups.
#### Alert Combinations Examples
1. ** Conservative Setup **
- Enable all three checks
- Use "Once Per Bar Close"
- Timeframe Selection Example:
* First Check: 15 minutes
* Second Check: 1 hour (60 minutes)
* Third Check: 4 hours (240 minutes)
- Wider gaps between timeframes reduce noise and false signals
- Best for: Swing trading, beginners
2. ** Aggressive Setup **
- Enable first two checks only
- Use "Once Per Bar"
- Timeframe Selection Example:
* First Check: 5 minutes
* Second Check: 15 minutes
- Closer timeframes for quicker signals
- Best for: Day trading, experienced traders
3. ** Balanced Setup **
- Enable all checks
- Use "Once Per Bar"
- Timeframe Selection Example:
* First Check: 5 minutes
* Second Check: 15 minutes
* Third Check: 1 hour (60 minutes)
- Balanced spacing between timeframes
- Best for: All-around trading
### Visual Settings
#### Alert Visual Settings
1. ** Show Background Color (Default: true) **
- What it does: Highlights chart background when alerts trigger
- Benefits:
* Makes signals more visible
* Helps spot opportunities quickly
* Provides visual confirmation of alerts
- When to disable:
* If using multiple indicators
* When preferring a cleaner chart
* During manual backtesting
2. ** Background Transparency (Default: 90) **
- Range: 0 (solid) to 100 (invisible)
- Recommended Settings:
* Clean Charts: 90-95
* Multiple Indicators: 85-90
* Single Indicator: 80-85
- Tip: Adjust based on your chart's overall visibility
3. ** Background Colors **
- Bullish Background:
* Default: Green
* Indicates upward momentum
* Customizable to match your theme
- Bearish Background:
* Default: Red
* Indicates downward momentum
* Customizable to match your theme
#### Level Settings
1. ** Oversold Level (Default: 20) **
- Traditional Setting: 20
- Adjustable Range: 0-100
- Usage:
* Lower values (e.g., 10): More conservative
* Higher values (e.g., 30): More aggressive
- Trading Applications:
* Potential bullish reversal zone
* Support level in uptrends
* Entry point for long positions
2. ** Overbought Level (Default: 80) **
- Traditional Setting: 80
- Adjustable Range: 0-100
- Usage:
* Lower values (e.g., 70): More aggressive
* Higher values (e.g., 90): More conservative
- Trading Applications:
* Potential bearish reversal zone
* Resistance level in downtrends
* Exit point for long positions
3. ** Middle Line (Default: 50) **
- Purpose: Trend direction separator
- Applications:
* Above 50: Bullish territory
* Below 50: Bearish territory
* Crossing 50: Potential trend change
- Trading Uses:
* Trend confirmation
* Entry/exit trigger
* Risk management level
#### Color Settings
1. ** Bullish Color (Default: Green) **
- Used for:
* K-Line (Main stochastic line)
* Status symbols when trending up
* Trend labels for bullish conditions
- Customization:
* Choose colors that stand out
* Match your trading platform theme
* Consider color blindness accessibility
2. ** Bearish Color (Default: Red) **
- Used for:
* D-Line (Signal line)
* Status symbols when trending down
* Trend labels for bearish conditions
- Customization:
* Choose contrasting colors
* Ensure visibility on your chart
* Consider monitor settings
3. ** Neutral Color (Default: Gray) **
- Used for:
* Middle line (50 level)
- Customization:
* Should be less prominent
* Easy on the eyes
* Good background contrast
### Theme Settings
1. **Color Theme Options**
- Dark Theme (Default):
* Dark background with white text
* Optimized for dark chart backgrounds
* Reduces eye strain in low light
- Light Theme:
* Light background with black text
* Better visibility in bright conditions
- Custom Theme:
* Use your own color preferences
2. ** Available Theme Colors **
- Table Background
- Table Text
- Table Headers
Note: The theme affects only the table display colors. The stochastic lines and alert backgrounds use their own color settings.
### Table Settings
#### Position and Size
1. ** Table Position **
- Options:
* Top Right (Default)
* Middle Right
* Bottom Right
* Top Left
* Middle Left
* Bottom Left
- Considerations:
* Chart space utilization
* Personal preference
* Multiple monitor setups
2. ** Text Sizes **
- Title Size Options:
* Tiny: Minimal space usage
* Small: Compact but readable
* Normal (Default): Standard visibility
* Large: Enhanced readability
* Huge: Maximum visibility
- Data Size Options:
* Recommended: One size smaller than title
* Adjust based on screen resolution
* Consider viewing distance
3. ** Empowering Messages **
- Purpose:
* Maintain trading discipline
* Provide psychological support
* Remind of best practices
- Rotation:
* Changes every 5 bars
* Categories include:
- Market Wisdom
- Strategy & Discipline
- Mindset & Growth
- Technical Mastery
- Market Philosophy
## 4. Setting Up for Different Trading Styles
### Day Trading Setup
1. **Timeframes**
- Primary: 5, 15, 30 minutes
- Secondary: 1H, 4H
- Alert Settings: "Once Per Bar"
2. ** Stochastic Settings **
- Length: 8-14
- Smooth K/D: 2-3
- Alert Condition: Match market trend
3. ** Visual Settings **
- Background: Enabled
- Transparency: 85-90
- Theme: Based on trading hours
### Swing Trading Setup
1. ** Timeframes **
- Primary: 1H, 4H, Daily
- Secondary: Weekly
- Alert Settings: "Once Per Bar Close"
2. ** Stochastic Settings **
- Length: 14-21
- Smooth K/D: 3-5
- Alert Condition: "Both"
3. ** Visual Settings **
- Background: Optional
- Transparency: 90-95
- Theme: Personal preference
### Position Trading Setup
1. ** Timeframes **
- Primary: Daily, Weekly
- Secondary: Monthly
- Alert Settings: "Once Per Bar Close"
2. ** Stochastic Settings **
- Length: 21-30
- Smooth K/D: 5-7
- Alert Condition: "Both"
3. ** Visual Settings **
- Background: Disabled
- Focus on table data
- Theme: High contrast
## 5. Troubleshooting Guide
### Common Issues and Solutions
1. ** Too Many Alerts **
- Cause: Settings too sensitive
- Solutions:
* Increase timeframe intervals
* Use "Once Per Bar Close"
* Enable fewer timeframe checks
* Adjust stochastic length higher
2. ** Missed Signals **
- Cause: Settings too conservative
- Solutions:
* Decrease timeframe intervals
* Use "Once Per Bar"
* Enable more timeframe checks
* Adjust stochastic length lower
3. ** False Signals **
- Cause: Insufficient confirmation
- Solutions:
* Enable all three timeframe checks
* Use larger timeframe gaps
* Wait for bar close
* Confirm with price action
4. ** Visual Clarity Issues **
- Cause: Poor contrast or overlap
- Solutions:
* Adjust transparency
* Change theme settings
* Reposition table
* Modify color scheme
### Best Practices
1. ** Getting Started **
- Start with default settings
- Use "Both" alert condition
- Enable all timeframe checks
- Wait for bar close
- Monitor for a few days
2. ** Fine-Tuning **
- Adjust one setting at a time
- Document changes and results
- Test in different market conditions
- Find your optimal timeframe combination
- Balance sensitivity with reliability
3. ** Risk Management **
- Don't trade against major trends
- Confirm signals with price action
- Use appropriate position sizing
- Set clear stop losses
- Follow your trading plan
4. ** Regular Maintenance **
- Review settings weekly
- Adjust for market conditions
- Update color scheme for visibility
- Clean up chart regularly
- Maintain trading journal
## 6. Tips for Success
1. ** Entry Strategies **
- Wait for all timeframes to align
- Confirm with price action
- Use proper position sizing
- Consider market conditions
2. ** Exit Strategies **
- Trail stops using indicator levels
- Take partial profits at targets
- Honor your stop losses
- Don't fight the trend
3. ** Psychology **
- Stay disciplined with settings
- Don't override system signals
- Keep emotions in check
- Learn from each trade
4. ** Continuous Improvement **
- Record your trades
- Review performance regularly
- Adjust settings gradually
- Stay educated on markets

Harmonic Pattern Detector (75 patterns)Harmonic Pattern Detector offers a record amount of "Harmonic Patterns" in one script, with 75 different patterns detected, together with up to 99 different swing lengths.
🔶 USAGE
Harmonic Patterns are detected from several different ZigZag lines, derived from Swings with different lengths (shorter - longer term)
Depending on the settings ' Minimum/Maximum Swing Length ', the user will see more or less patterns from shorter and/or longer-term swing points.
🔹 Fibonacci Ratio
Certain patterns have only one ratio for a specific retrace/extension instead of one upper and one lower limit. In this case, we add a ' Tolerance ', which adds a percentage tolerance below/above the ratio, creating two limits.
A higher number may show more patterns but may become less valid.
Hoovering over points B, C, and D will show a tooltip with the concerning limits; adjusted limits will be seen if applicable.
Tooltips in settings will also show which patterns the Fibonacci Ratio applies to.
🔹 Triangle Area Ratio
Using Heron's formula , the triangle area is calculated after the X-Y axis is normalized.
Users can filter patterns based on the ratio of the smallest triangle to the largest triangle.
A lower Triangle Area Ratio number leads to more symmetrical patterns but may appear less frequently.
🔶 DETAILS
Harmonic patterns are based on geometric patterns, where the retracement/extension of a swing point must be located between specific Fibonacci ratios of the previous swing/leg. Different Harmonic Patterns require unique ratios to become valid patterns.
In the above example there is a valid 'Max Butterfly' pattern where:
Point B is located between 0.618 - 0.886 retracement level of the X-A leg
Point C is located between 0.382 - 0.886 retracement level of the A-B leg
Point D is located between 1.272 - 2.618 extension level of the B-C leg
Point D is located between 1.272 - 1.618 extension level of the X-A leg
Harmonic Pattern Detector uses ZigZag lines, where swing highs and swing lows alternate. Each ZigZag line is checked for valid Harmonic Patterns . When multiple types of Harmonic Patterns are valid for the same sequence, the pattern will be named after the first one found.
Different swing lengths form different ZigZag lines.
By evaluating different ZigZag lines (up to 99!), shorter—and longer-term patterns can be drawn on the same chart.
🔹 Blocks
The patterns are organized into blocks that can be toggled on or off with a single click.
When a block is enabled, the user can still select which specific patterns within that block are enabled or disabled.
🔹 Visuals
Besides color settings, labels can show pattern names or arrows at point D of the pattern.
Note this will happen 1 bar after validation because one extra bar is needed for confirmation.
An option is included to show only arrows without the patterns.
🔹 Updated Patterns
When a Swing Low is followed by a lower low or a Swing High followed by a higher high , triggering a pattern identical to a previous one except with a different point D, the pattern will be updated. The previous C-D line will be visible as a dashed line to highlight the event. Only the last dashed line is shown when this happens more than once.
🔹 Optimization
The script only verifies the last leg in the initial phase, significantly reducing the time spent on pattern validation. If this leg doesn't align with a potential Harmonic Pattern , the pattern is immediately disregarded. In the subsequent phase, the remaining patterns are quickly scrutinized to ensure the next leg is valid. This efficient process continues, with only valid patterns progressing to the next phase until all sequences have been thoroughly examined.
This process can check up to 99 ZigZag lines for 75 different Harmonic Patterns , showcasing its high capacity and versatility.
🔹 Ratios
The following table shows the different ratios used for each Harmonic Pattern .
' min ' and ' max ' are used when only one limit is provided instead of 2. This limit is given a percentage tolerance above and below, customizable by the setting ' Tolerance - Fibonacci Ratio '.
For example a ratio of 0.618 with a tolerance of 1% would result in:
an upper limit of 0.624
a lower limit of 0.612
|-------------------|------------------------|------------------------|-----------------------|-----------------------|
| NAME PATTERN | BCD (BD) | ABC (AC) | XAB (XB) | XAD (XD) |
| | min max | min max | min max | min max |
|-------------------|------------------------|------------------------|-----------------------|-----------------------|
| 'ABCD' | 1.272 - 1.618 | 0.618 - 0.786 | | |
| '5-0' | 0.5 *min - 0.5 *max | 1.618 - 2.24 | 1.13 - 1.618 | |
| 'Max Gartley' | 1.128 - 2.236 | 0.382 - 0.886 | 0.382 - 0.618 | 0.618 - 0.786 |
| 'Gartley' | 1.272 - 1.618 | 0.382 - 0.886 | 0.618*min - 0.618*max | 0.786*min - 0.786*max |
| 'A Gartley' | 1.618*min - 1.618*max | 1.128 - 2.618 | 0.618 - 0.786 | 1.272*min - 1.272*max |
| 'NN Gartley' | 1.128 - 1.618 | 0.382 - 0.886 | 0.618*min - 0.618*max | 0.786*min - 0.786*max |
| 'NN A Gartley' | 1.618*min - 1.618*max | 1.128 - 2.618 | 0.618 - 0.786 | 1.272*min - 1.272*max |
| 'Bat' | 1.618 - 2.618 | 0.382 - 0.886 | 0.382 - 0.5 | 0.886*min - 0.886*max |
| 'Alt Bat' | 2.0 - 3.618 | 0.382 - 0.886 | 0.382*min - 0.382*max | 1.128*min - 1.128*max |
| 'A Bat' | 2.0 - 2.618 | 1.128 - 2.618 | 0.382 - 0.618 | 1.128*min - 1.128*max |
| 'Max Bat' | 1.272 - 2.618 | 0.382 - 0.886 | 0.382 - 0.618 | 0.886*min - 0.886*max |
| 'NN Bat' | 1.618 - 2.618 | 0.382 - 0.886 | 0.382 - 0.5 | 0.886*min - 0.886*max |
| 'NN Alt Bat' | 2.0 - 4.236 | 0.382 - 0.886 | 0.382*min - 0.382*max | 1.128*min - 1.128*max |
| 'NN A Bat' | 2.0 - 2.618 | 1.128 - 2.618 | 0.382 - 0.618 | 1.128*min - 1.128*max |
| 'NN A Alt Bat' | 2.618*min - 2.618*max | 1.128 - 2.618 | 0.236 - 0.5 | 0.886*min - 0.886*max |
| 'Butterfly' | 1.618 - 2.618 | 0.382 - 0.886 | 0.786*min - 0.786*max | 1.272 - 1.618 |
| 'Max Butterfly' | 1.272 - 2.618 | 0.382 - 0.886 | 0.618 - 0.886 | 1.272 - 1.618 |
| 'Butterfly 113' | 1.128 - 1.618 | 0.618 - 1.0 | 0.786 - 1.0 | 1.128*min - 1.128*max |
| 'A Butterfly' | 1.272*min - 1.272*max | 1.128 - 2.618 | 0.382 - 0.618 | 0.618 - 0.786 |
| 'Crab' | 2.24 - 3.618 | 0.382 - 0.886 | 0.382 - 0.618 | 1.618*min - 1.618*max |
| 'Deep Crab' | 2.618 - 3.618 | 0.382 - 0.886 | 0.886*min - 0.886*max | 1.618*min - 1.618*max |
| 'A Crab' | 1.618 - 2.618 | 1.128 - 2.618 | 0.276 - 0.446 | 0.618*min - 0.618*max |
| 'NN Crab' | 2.236 - 4.236 | 0.382 - 0.886 | 0.382 - 0.618 | 1.618*min - 1.618*max |
| 'NN Deep Crab' | 2.618 - 4.236 | 0.382 - 0.886 | 0.886*min - 0.886*max | 1.618*min - 1.618*max |
| 'NN A Crab' | 1.128 - 2.618 | 1.128 - 2.618 | 0.236 - 0.447 | 0.618*min - 0.618*max |
| 'NN A Deep Crab' | 1.128*min - 1.128*max | 1.128 - 2.618 | 0.236 - 0.382 | 0.618*min - 0.618*max |
| 'Cypher' | 1.272 - 2.00 | 1.13 - 1.414 | 0.382 - 0.618 | 0.786*min - 0.786*max |
| 'New Cypher' | 1.272 - 2.00 | 1.414 - 2.14 | 0.382 - 0.618 | 0.786*min - 0.786*max |
| 'Anti New Cypher' | 1.618 - 2.618 | 0.467 - 0.707 | 0.5 - 0.786 | 1.272*min - 1.272*max |
| 'Shark 1' | 1.618 - 2.236 | 1.128 - 1.618 | 0.382 - 0.618 | 0.886*min - 0.886*max |
| 'Shark 1 Alt' | 1.618 - 2.618 | 0.618 - 0.886 | 0.446 - 0.618 | 1.128*min - 1.128*max |
| 'Shark 2' | 1.618 - 2.236 | 1.128 - 1.618 | 0.382 - 0.618 | 1.128*min - 1.128*max |
| 'Shark 2 Alt' | 1.618 - 2.618 | 0.618 - 0.886 | 0.446 - 0.618 | 0.886*min - 0.886*max |
| 'Leonardo' | 1.128 - 2.618 | 0.382 - 0.886 | 0.5*min - 0.5*max | 0.786*min - 0.786*max |
| 'NN A Leonardo' | 2.0*min - 2.0*max | 1.128 - 2.618 | 0.382 - 0.886 | 1.272*min - 1.272*max |
| 'Nen Star' | 1.272 - 2.0 | 1.414 - 2.14 | 0.382 - 0.618 | 1.272*min - 1.272*max |
| 'Anti Nen Star' | 1.618 - 2.618 | 0.467 - 0.707 | 0.5 - 0.786 | 0.786*min - 0.786*max |
| '3 Drives' | 1.272 - 1.618 | 0.618 - 0.786 | 1.272 - 1.618 | 1.618 - 2.618 |
| 'A 3 Drives' | 0.618 - 0.786 | 1.272 - 1.618 | 0.618 - 0.786 | 0.13 - 0.886 |
| '121' | 0.382 - 0.786 | 1.128 - 3.618 | 0.5 - 0.786 | 0.382 - 0.786 |
| 'A 121' | 1.272 - 2.0 | 0.5 - 0.786 | 1.272 - 2.0 | 1.272 - 2.618 |
| '121 BG' | 0.618 - 0.707 | 1.128 - 1.733 | 0.5 - 0.577 | 0.447 - 0.786 |
| 'Black Swan' | 1.128 - 2.0 | 0.236 - 0.5 | 1.382 - 2.618 | 1.128 - 2.618 |
| 'White Swan' | 0.5 - 0.886 | 2.0 - 4.237 | 0.382 - 0.786 | 0.238 - 0.886 |
| 'NN White Swan' | 0.5 - 0.886 | 2.0 - 4.236 | 0.382 - 0.724 | 0.382 - 0.886 |
| 'Sea Pony' | 1.618 - 2.618 | 0.382 - 0.5 | 0.128 - 3.618 | 0.618 - 3.618 |
| 'Navarro 200' | 0.886 - 3.618 | 0.886 - 1.128 | 0.382 - 0.786 | 0.886 - 1.128 |
| 'May-00' | 0.5 - 0.618 | 1.618 - 2.236 | 1.128 - 1.618 | 0.5 - 0.618 |
| 'SNORM' | 0.9 - 1.1 | 0.9 - 1.1 | 0.9 - 1.1 | 0.618 - 1.618 |
| 'COL Poruchik' | 1.0 *min - 1.0 *max | 0.382 - 2.618 | 0.128 - 3.618 | 0.618 - 3.618 |
| 'Henry – David' | 0.618 - 0.886 | 0.44 - 0.618 | 0.128 - 2.0 | 0.618 - 1.618 |
| 'DAVID VM 1' | 1.618 - 1.618 | 0.382*min - 0.382*max | 0.128 - 1.618 | 0.618 - 3.618 |
| 'DAVID VM 2' | 1.618 - 1.618 | 0.382*min - 0.382*max | 1.618 - 3.618 | 0.618 - 7.618 |
| 'Partizan' | 1.618*min - 1.618*max | 0.382*min - 0.382*max | 0.128 - 3.618 | 0.618 - 3.618 |
| 'Partizan 2' | 1.618 - 2.236 | 1.128 - 1.618 | 0.128 - 3.618 | 1.618 - 3.618 |
| 'Partizan 2.1' | 1.618*min - 1.618*max | 1.128*min - 1.128*max | 0.128 - 3.618 | 0.618 - 3.618 |
| 'Partizan 2.2' | 2.236*min - 2.236*max | 1.128*min - 1.128*max | 0.128 - 3.618 | 0.618 - 3.618 |
| 'Partizan 2.3' | 1.618*min - 1.618*max | 0.618 - 1.618 | 0.128 - 3.618 | 0.618 - 3.618 |
| 'Partizan 2.4' | 2.236*min - 2.236*max | 1.618*min - 1.618*max | 0.128 - 3.618 | 0.618 - 3.618 |
| 'TOTAL' | 1.272 - 3.618 | 0.382 - 2.618 | 0.276 - 0.786 | 0.618 - 1.618 |
| 'TOTAL NN' | 1.272 - 4.236 | 0.382 - 2.618 | 0.236 - 0.786 | 0.618 - 1.618 |
| 'TOTAL 1' | 1.272 - 2.618 | 0.382 - 0.886 | 0.382 - 0.786 | 0.786 - 0.886 |
| 'TOTAL 2' | 1.618 - 3.618 | 0.382 - 0.886 | 0.382 - 0.786 | 1.128 - 1.618 |
| 'TOTNN 2NN' | 1.618 - 4.236 | 0.382 - 0.886 | 0.382 - 0.786 | 1.128 - 1.618 |
| 'TOTAL 3' | 1.272 - 2.618 | 1.128 - 2.618 | 0.276 - 0.618 | 0.618 - 0.886 |
| 'TOTNN 3NN' | 1.272 - 2.618 | 1.128 - 2.618 | 0.236 - 0.618 | 0.618 - 0.886 |
| 'TOTAL 4' | 1.618 - 2.618 | 1.128 - 2.618 | 0.382 - 0.786 | 1.128 - 1.272 |
| 'BG 1' | 2.618*min - 2.618*max | 0.382*min - 0.382*max | 0.128 - 0.886 | 1.0 *min - 1.0 *max |
| 'BG 2' | 2.237*min - 2.237*max | 0.447*min - 0.447*max | 0.128 - 0.886 | 1.0 *min - 1.0 *max |
| 'BG 3' | 2.0 *min - 2.0 *max | 0.5 *min - 0.5 *max | 0.128 - 0.886 | 1.0 *min - 1.0 *max |
| 'BG 4' | 1.618*min - 1.618*max | 0.618*min - 0.618*max | 0.128 - 0.886 | 1.0 *min - 1.0 *max |
| 'BG 5' | 1.414*min - 1.414*max | 0.707*min - 0.707*max | 0.128 - 0.886 | 1.0 *min - 1.0 *max |
| 'BG 6' | 1.272*min - 1.272*max | 0.786*min - 0.786*max | 0.128 - 0.886 | 1.0 *min - 1.0 *max |
| 'BG 7' | 1.171*min - 1.171*max | 0.854*min - 0.854*max | 0.128 - 0.886 | 1.0 *min - 1.0 *max |
| 'BG 8' | 1.128*min - 1.128*max | 0.886*min - 0.886*max | 0.128 - 0.886 | 1.0 *min - 1.0 *max |
|-------------------|------------------------|------------------------|-----------------------|-----------------------|
🔶 SETTINGS
🔹 Swings
Minimum Swing Length: Minimum length used for the swing detection.
Maximum Swing Length: Maximum length used for the swing detection.
🔹 Patterns
Toggle Pattern Block
Toggle separate pattern in each Pattern Block
🔹 Tolerance
Fibonacci Ratio: Adds a percentage tolerance below/above the ratio when only one ratio applies, creating two limits.
Triangle Area Ratio: Filters patterns based on the ratio of the smallest triangle to the largest triangle.
🔹 Display
Labels: Display Pattern Names, Arrows or nothing
Patterns: Display or not
Last Line: Display previous C-D line when updated
🔹 Style
Colors: Pattern Lines/Names/Arrows - background color of patterns
Text Size: Text Size of Pattern Names/Arrows
🔹 Calculation
Calculated Bars: Allows the usage of fewer bars for performance/speed improvement
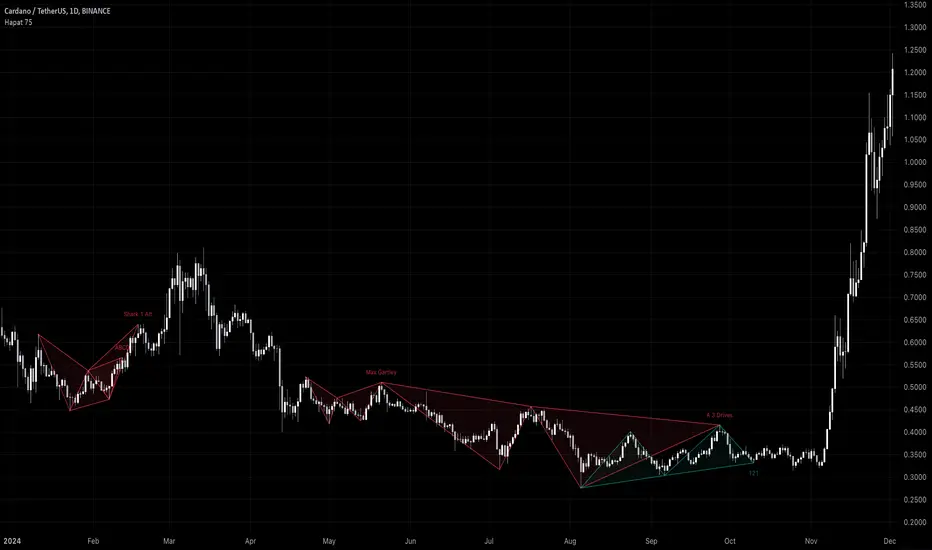
VAMA - Volume Adjusted Moving Average [jpkxyz]VAMA is a moving average that adapts to volume, giving more weight to price movements backed by higher relative volume. This VAMA (Volume Adjusted Moving Average) indicator implementation emphasizes visual clarity. It is based on the VAMA script by @allanster
Dual VAMA lines (Fast/Slow) with dynamic coloring:
Single-color scheme switches between green (bullish) and red (bearish)
Color changes on crossovers rather than relative position
Configurable line widths (set to 1 for clean appearance)
Visual enhancements:
Optional fill between VAMA lines (50% transparency)
Crossover dots can be toggled
Fills and dots match the current trend color
Customization parameters:
Independent source inputs for Fast/Slow lines
Adjustable VI Factor (volume influence)
Sample size control
Strict/non-strict calculation toggle
The code maintains efficient computation while prioritizing visual feedback for trend changes. It's designed for clear signal identification without visual clutter.
Notable style choices:
Consistent color theming throughout all visual elements
Simplified color transitions (only at crossovers)
Subtle transparency for fill areas
Minimal dot size for crossover markers
VAMA (Volume Adjusted Moving Average) Technical Analysis:
Core Calculation:
1. Volume Influence (v2i):
v2i = volume / ((total_volume/total_periods) * volume_factor)
- total_volume: Sum of volume over sample period
- total_periods: Either full history (nvb=0) or specified sample size
- volume_factor: Controls sensitivity to volume deviation
2. Price Weighting:
weighted_price = source_price * v2i
3. Accumulation Process:
- Iterates through length*10 periods
- Accumulates weighted prices and volume influence values
- Continues until volume influence sum >= specified length or strict rule triggers
4. Final VAMA Value:
vama = (weighted_sum - (volume_sum - length) * last_price) / length
Parameters:
- SampleN: Historical reference length (0=full history)
- Length: Base period for calculation
- VI Factor: Volume influence multiplier (>0.01)
- Strict: Forces exact length period completion when true
- Source: Input price data
GP - SRSI ChannelGP - SRSI Channel Indicator
The GP - SRSI Channel is a channel indicator derived from the Stochastic RSI (SRSI) oscillator. It combines SRSI data from multiple timeframes to analyze minimum, maximum, and closing values, forming a channel based on these calculations. The goal is to identify overbought and oversold zones with color coding and highlight potential trading opportunities by indicating trend reversal points.
How It Works
SRSI Calculation: The indicator calculates the Stochastic RSI values using open, high, low, and close prices from the selected timeframes.
Channel Creation: Minimum and maximum values derived from these calculations are combined across multiple timeframes. The midpoint is calculated as the average of these values.
Color Coding: Zones within the channel are color-coded with a gradient from red to green based on the ratios. Green zones typically indicate selling opportunities, while red zones suggest buying opportunities.
Visual Elements:
The channel boundaries (min/max) are displayed as lines.
Overbought/oversold regions (95-100 and 0-5) are highlighted with shaded areas.
Additional explanatory labels are placed on key levels to guide users.
How to Use
Trading Strategy: This indicator can be used for both trend following and identifying reversal points. Selling opportunities can be evaluated when the channel reaches the upper green zone, while buying opportunities can be considered in the lower red zone.
Timeframe Selection: Users can analyze multiple timeframes simultaneously to gain a broader perspective.
Customization: RSI and Stochastic RSI parameters are adjustable, allowing users to tailor the indicator to their trading strategies.
Important Note
This indicator is for informational purposes only and should not be used as a sole basis for trading decisions. Please validate the results of the indicator with your own analysis.

TrendLines MTF [Cometreon]TrendLines MTF is a next-generation indicator designed to automatically detect and plot all relevant trendlines across any symbol and timeframe—including higher ones. Using advanced algorithms, it constantly scans price action and updates the chart in real-time, offering a fast, precise, and dynamic view of market structure.
This tool streamlines market analysis and boosts decision-making by eliminating the need for manual trendline drawing.
🔷 Key Features
🟩 Automatic Plotting
The indicator automatically draws and updates trendlines, providing a real-time overview of market trends.
🟩 Breakout and Bounce Signaling
Provides immediate notifications when a trendline is broken or the price bounces off it, allowing traders to react promptly to market changes.
🟩 Customization
Offers the ability to modify length, touches, colors, and line style to suit individual preferences.
🟩 Information Table
Includes a detailed table showing the values of all active trendlines, facilitating the monitoring of key market points.
🟩 Configurable Alerts
Allows setting custom alerts for breakouts, bounces, or creation of new trendlines.
🔷 Technical Details and Customizable Inputs
Trendline offers a range of customizable inputs that allow adapting the indicator to specific needs:
1️⃣ Trendline Type - Select between active trendlines, broken ones, both, or none.
2️⃣ Left and Right Length - Defines the extension of maximum and minimum points to identify Trendlines.
3️⃣ Timeframe - You can also modify the timeframe of Trendlines to display a higher timeframe.
4️⃣ Confirm at Timeframe - Allows you to confirm the Trendlines using the chart's timeframe instead of the selected one. This checks whether a candle has already broken the line previously.
5️⃣ Delete at Timeframe - Input to remove trendlines based on breakouts with chart candles, instead of using candles of a higher timeframe.
6️⃣ Touch Need - Sets the number of touches needed to confirm a Trendline.
7️⃣ Max Trend Line for Level - Limits the maximum number of Trendlines in a single level.
8️⃣ Extended Line After Break - Option to extend broken Trendlines by a specific value.
9️⃣ Session Range - The "Session Range" offers two options: select a specific date or a period relative to the last candle. The input allows choosing between "Choose" and "Pick Up".
With "Choose", you select a relative period, with two modes:
Last : shows the trendlines of the selected period, compatible with Replay.
Real Time : displays all TrendLines, searching from the last selected period.
Example: "1 Month" with "Last" shows the TrendLines from the previous month, while "Real Time" searches without time limits but uses the values from the last month. This allows defining the search depth of the indicator, crucial for computing power. In case of issues, use "Auto".
1️⃣0️⃣ Trendlines Style - Modify the style for each type of Trendlines (Valid, Break) including color, style, and line thickness.
1️⃣1️⃣ Trends Trendlines - Enable/disable two different trends:
Trend Bar Color : based on TrendLines breakouts. Breaking a bearish TrendLine results in a bullish trend, vice versa for breaking a bullish TrendLine.
Trend Background : based on the number of active TrendLines. For example, if the number of bullish TrendLines is greater than the "Strength", the trend will be bullish.
1️⃣2️⃣ Signal Style - You can enable or disable breakout and bounce signals, with customizable colors for each signal type.
1️⃣3️⃣ Alert - Set notifications for breakouts, bounces, or formation of new Trendlines.
1️⃣4️⃣ Table - Customize the table showing the values of all active trendlines, facilitating the monitoring of key market points. You can modify the appearance of the table, changing the color of cells and text.
These options allow you to optimize the indicator for different trading styles and market conditions, ensuring precise and personalized technical analysis.
🔍 How to Use Trendlines MTF
📌 Market Analysis
Use the displayed Trendlines as critical indicators of market dynamics to make informed trading decisions.
📈 Signal Interpretation
Leverage Trendline breakouts and bounces to identify potential trend changes and trading opportunities.
🛠 Strategy Integration
Use Trendlines and generated signals as a basis for creating personalized and innovative trading strategies.
☄️ With Trendlines, you can simplify your market analysis, saving time and improving the accuracy of your decisions with clearly visualized and customizable Trendlines.
Don't waste any more time and visit the link to get access to all Cometreon indicators.

Higher Time Frame Support/Resistance [BigBeluga]The Higher Time Frame Support/Resistance indicator is a tool designed to display pivot points derived from higher timeframes on your current chart. These pivot points are calculated based on the highs and lows of price action in different timeframes, and the indicator draws horizontal lines to represent these levels. These lines act as potential support and resistance zones, giving traders key market levels that may influence future price movement.
Each pivot line is color-coded and labeled with its price value and the timeframe it originates from. This allows traders to clearly differentiate between the significance of the levels based on their timeframe. For example, weekly pivot levels may represent stronger, more long-term support and resistance, while hourly pivots offer more immediate, short-term levels to watch.
🔵 IDEA
The Higher Time Frame Support/Resistance indicator is designed to simplify the process of tracking key support and resistance levels across multiple timeframes. Pivot points, which represent turning points in the market, are essential for identifying areas where price might reverse or break out. By displaying these levels from higher timeframes directly on the current chart, traders can quickly identify and react to critical areas in the market without needing to switch between different timeframe charts.
The indicator labels each pivot point with the specific timeframe it comes from (e.g., 4H, 1D, 1W), making it easy for traders to assess the relative strength of each level. Stronger levels from higher timeframes are likely to act as more significant barriers or support zones, while lower timeframe levels can be used for more precise entries and exits.
🔵 KEY FEATURES
Pivot Levels from Multiple Timeframes:
The indicator calculates pivot highs and lows from various higher timeframes (e.g., 4H, 1D, 1W) and plots these levels on the current chart. These pivot points are represented by horizontal lines that extend across the chart, serving as potential support and resistance zones.
Color-Coded Support and Resistance Lines:
Each pivot level is color-coded based on its timeframe, helping traders quickly differentiate between short-term and long-term support and resistance. This visual aid simplifies the analysis and allows for a clearer understanding of key market levels.
Price Labels and Timeframe Information:
In addition to the pivot lines, the indicator displays labels at each level with the corresponding price and timeframe. For example, a label may show "D Pivot High" followed by the exact price. This helps traders understand the origin and significance of each line, allowing for more informed trading decisions.
Labels up and down mark highs and lows from higher timeframes:
Pivot Shadows for Enhanced Clarity:
The indicator can also draw shadow lines that represent the pivot points but with increased transparency. These shadows allow traders to keep track of previous pivots without cluttering the chart with too many solid lines. The width and transparency of these shadows can be customized in the settings.
🔵 HOW TO USE
🔵 CUSTOMIZATION
Timeframes and Pivot Length: Customize which higher timeframes (e.g., 4H, 1D, 1W) you want to display pivot levels from. Adjust the pivot length to control how sensitive the indicator is in detecting market highs and lows.
Line Style and Colors: Adjust the line style (solid, dashed, dotted) and colors for each timeframe to match your personal preference or chart theme. This customization helps in maintaining a clear and visually appealing chart.
Shadow Line Width and Transparency: Control the width and transparency of the shadow pivot lines to reduce chart clutter while still keeping track of key historical levels.

Enhanced Pressure MTF ScreenerEnhanced Pressure Multi-Timeframe (MTF) Screener Indicator
Overview
The Enhanced Pressure MTF Screener is an add-on that extends the capabilities of the Enhanced Buy/Sell Pressure, Volume, and Trend Bar Analysis . It provides a clear and consolidated view of buy/sell pressure across multiple timeframes. This indicator allows traders to determine when different timeframes are synchronized in the same trend direction, which is particularly useful for making high-confidence trading decisions.
Image below: is the Enhanced Buy/Sell Pressure, Volume, and Trend Bar Analysis with the Enhanced Pressure MTF Screener indicator both active together.
Key Features
1.Multi-Timeframe Analysis
The indicator screens various predefined timeframes (from 1 week down to 10 minutes).
It offers a table view that shows buy or sell ratings for each timeframe, making it easy to see which timeframes are aligned.
Traders can choose which timeframes to include based on their trading strategies (e.g., higher timeframes for position trading, lower timeframes for scalping).
2.Pressure and Trend Calculation
Uses Buy and Sell Pressure calculations from the Enhanced Buy/Sell Pressure indicator to determine whether buying or selling is dominant in each timeframe.
By analyzing pressures on multiple timeframes, the indicator gives a comprehensive perspective of the current market sentiment.
The indicator calculates whether a move is strong based on user-defined thresholds, which are displayed in the form of additional signals.
3.Heikin Ashi Option
The Heikin Ashi candle type can be toggled on or off. Using Heikin Ashi helps smooth out market noise and provides a clearer indication of trend direction.
This is particularly helpful for traders who want to filter out market noise and focus on the primary trend.
4.Table Customization
Table Positioning: The table showing timeframe data can be positioned at different locations on the chart—top, middle, or bottom.
Text and Alignment: The alignment and text size of the table can be customized for better visual clarity.
Color Settings: Users can choose specific colors to indicate buying and selling pressure across timeframes, making it easy to interpret.
5.Strong Movement Indicators
The screener provides an additional visual cue (🔥) for timeframes where the movement is deemed strong, based on a user-defined threshold.
This helps highlight timeframes where significant buying or selling pressure is present, which could signal potential trading opportunities.
How the Screener Works
1.Pressure Calculation
For each selected timeframe, the indicator retrieves the Open, High, Low, and Close (OHLC) values.
It calculates buy pressure (the range between high and low when the closing price is higher than the opening) and sell pressure (the range between high and low when the closing price is equal to or lower than the opening).
The screener computes the pressure ratio, which represents the difference between buying and selling pressure, to determine which side is dominant.
2.Trend Rating and Signal Generation
Based on the calculated pressure, the screener determines a trend rating for each timeframe: "Buy," "Sell," or "Neutral." (▲ ,▼ or •)
Additionally, it generates a signal (▲ or ▼) to indicate the current trend direction and whether the move is strong (based on the user-defined threshold).
If the movement is strong, a fire icon (🔥) is added to indicate that there is significant pressure on that timeframe, signaling a higher confidence in the trend.
3.Customizable Strong Move Thresholds
Strong Move Threshold: The screener uses this value to decide whether a trend is significantly strong. A higher value makes it more selective in determining strong moves.
Strong Movement Threshold: Helps determine when an additional strong signal should be displayed, offering further insight into the strength of market movement.
Inputs and Customization
The Enhanced Pressure MTF Screener is highly customizable to fit the needs of individual traders:
General Settings:
Use Heikin Ashi: Toggle this setting to use Heikin Ashi for a smoother trend representation.
Strong Move Threshold: Defines how strong a move should be to be considered significant.
Strong Movement Threshold: Specifies the level of pressure required to highlight a move with the fire icon.
Table Settings:
Position: Choose the vertical position of the screener table (top, middle, or bottom of the chart).
Alignment: Align the table (left, center, or right) to best suit your chart layout.
Text Size: Adjust the text size in the table for better readability.
Table Color Settings:
Users can set different colors to represent buying and selling signals for better visual clarity, particularly when scanning multiple timeframes.
Timeframe Settings:
The screener provides options to include up to ten different timeframes. Traders can select and customize each timeframe to match their strategy.
Examples of available timeframes include 1 Week, 1 Day, 12 Hours, down to 10 Minutes, allowing for both broad and detailed analysis.
Practical Use Case
Identifying Trend Alignment Across Timeframes:
Imagine you are about to take a long trade but want to make sure that the trend direction is aligned across multiple timeframes.
The screener displays "Buy" ratings across the 4H, 1H, 30M, and 10M timeframes, while higher timeframes (like 1W and 1D) also show "Buy" with strong signals (🔥). This indicates that buying pressure is strong across the board, adding confidence to your trade.
Spotting Reversal Opportunities:
If a downtrend is evident across most timeframes but suddenly a higher timeframe, such as 12H, changes to "Buy" while showing a strong move (🔥), this could indicate a potential reversal.
The screener allows you to spot these discrepancies and consider taking early action.
Benefits for Traders
1.Synchronization Across Timeframes:
One of the main strengths of this screener is its ability to show synchronized buy/sell signals across different timeframes. This makes it easy to confirm the strength and consistency of a trend.
For example, if you see that all the selected timeframes display "Buy," this implies that both short-term and long-term traders are favoring the upside, giving additional confidence to go long.
2.Quick and Visual Trend Overview:
The table offers an at-a-glance summary, reducing the time required to manually inspect each timeframe.
This makes it particularly useful for traders who want to make quick decisions, such as day traders or scalpers.
3.Strong Move Indicator:
The use of fire icons (🔥) provides an easy way to identify significant movements. This is particularly helpful for traders looking for breakouts or strong market conditions that could lead to high probability trades.
To put it short or to summarize
The Enhanced Pressure MTF Screener is a powerful add-on for traders looking to understand how buy and sell pressure aligns across multiple timeframes. It offers:
A clear summary of buying or selling pressure across different timeframes.
Heikin Ashi smoothing, providing an option to reduce market noise.
Strong movement signals to highlight significant trading opportunities.
Customizable settings to fit any trading strategy or style.
The screener and the main indicator are best used together, as the screener provides the multi-timeframe overview, while the main indicator provides an in-depth look at each individual bar and trend.
I hope my indicator helps with your trading, if you guys have any ideas or questions there is the comment section :D

Black Moving AveragesGENERAL OVERVIEW
The moving average (MA) indicator is a foundational yet versatile tool in technical analysis, used by traders and investors to smooth out price data over a specific time frame. This helps to identify the direction of a trend by filtering out short-term fluctuations or "noise" in the price action. By observing the moving average line, traders can gain insights into potential support and resistance levels, trend strength, and possible trend reversals. Moving averages are especially useful in trending markets, where they can enhance the timing of entries and exits.
The Black Moving Averages indicator is an enhanced Moving Average indicator with unique features in one indicator, features like multi-timeframe, multi-types/length, custom labelling and moving average compact PANEL with multi-symbol support.
📌HOW DOES IT WORK
A moving average is a constantly updated average price calculated by adding up the closing prices of a security over a set period and dividing by the total number of periods.
Uptrend: If the moving average line is sloping upwards and the price is above the moving average, this typically indicates an uptrend.
Downtrend: If the moving average slopes downward with price action mostly below it, a downtrend is likely in effect.
Flat/Sideways Trend: When the moving average is flat, it suggests a range-bound or consolidating market with no clear trend.
Common Moving Average Periods:
The choice of period for a moving average can vary significantly depending on the trader’s strategy:
Short-Term Traders: Often use periods such as 5, 10, or 20 (intraday or daily) to capture quick price movements.
Medium-Term Traders: Typically use 50-period MAs, which can help spot trend changes within a few weeks to a few months.
Long-Term Traders/Investors: Favor 100, 200, or even 250-period MAs to analyze the overarching trend in daily or weekly charts.
📌HOW TO USE IT
When an asset's price crosses above its moving average, it can be a signal to buy, while crossing below can be a signal to sell.
Moving Average Crossovers: When a short-term moving average crosses above a long-term moving average, it generates a “Golden Cross,” indicating a bullish trend. Conversely, when a short-term MA crosses below a long-term MA, this creates a “Death Cross,” signalling a potential bearish trend.
Moving Average Envelopes and Bands: Some traders use moving averages to create envelopes or bands (e.g., Bollinger Bands), which add upper and lower bands around the moving average. These can help to assess the volatility and gauge potential price reversals.
Dynamic Support and Resistance: Longer-term MAs, such as the 200-day SMA, often act as dynamic support or resistance. If the price bounces off this MA several times, it reinforces the indicator’s significance.
Trend Confirmation and Continuation: Traders can confirm trends by observing if the price consistently stays above or below the moving average. This can be a signal to maintain an existing position.
Crossover Signals for Entries and Exits: A crossover strategy, where a shorter MA crosses above or below a longer MA, can serve as a reliable entry or exit point. This is particularly popular for catching early trend changes.
Combining with Other Indicators: Moving averages often yield better results when used alongside other indicators, such as the Relative Strength Index (RSI) for confirming overbought or oversold conditions, or the MACD for gauging momentum.
Limitations of Moving Averages
Lagging Nature: Moving averages rely on historical data, which makes them inherently lagging indicators, meaning they tend to react after a trend is already underway.
False Signals: In range-bound or choppy markets, moving averages can produce false signals, leading to potentially unprofitable trades.
When to be cautious:
When an asset's price is driven by strong momentum, it can remain over-extended for a long time. In this case, slight pauses may be mistaken for reversals.
By refining your understanding of moving averages and using them within the broader context of technical analysis, you can leverage their simplicity and effectiveness to better time entries, and exits, and spot potential reversals in various types of market conditions.
Black Moving Averages Indicator Features:
Multiple Moving Averages with multiple types, lengths & Cross
Multi Timeframe support
Moving Average PANEL with TF, Multi Symbol, Type, Length & Trend Strength
Moving Averages Horizontal Display with Labels (Type, TF, Price)
⚙️Black Moving Average SETTINGS
+ Black Moving Averages Dashboard ◢
- Moving Averages: Enable/Disable the Moving Averages on Chart
- MA Cross: Enable/Disable the Moving Averages Cross plot on the Chart
- MA PANEL: Enable/Disable the Moving Averages Panel on Chart
- VWAP: Enable/Disable the VWAP on Chart
+ Moving Averages Display Settings ◢
- Switch to Horizontal Lines: It switches the moving averages lines into horizontal lines on the charts
- Labels: It allows users to display moving averages labels (TF, type, length), prices or both on the chart
- Label Text Size: The user can select label text size (Tiny, Small, Normal, Large, Huge)
- Label Offset: Input label offset value (distance of label display from moving averages)
+ Moving Average Settings ◢
- Moving Average Length: input value of moving average length
- Color: Color selection for moving average
- Timeframe: Selection of timeframe for the moving average
- Type: Selection of MA type for the moving average
- Source: Selection of MA source(close, open etc) for the moving average
- Style: Display style (Line, Cross, Circle) for the moving average
- Line width: Display width of the moving average
+ Moving Average Cross Settings ◢
- | | Coss A | :
Plots cross of two user-specified moving averages on the chart
- | | Coss B | :
Plots cross of two user-specified moving averages on the chart
- | | Coss C | :
Plots cross of two user-specified moving averages on the chart
+ Moving Average PANEL Settings ◢
- Override Panel Symbol: Enables user to select the symbol for MA PANEL
- MA Panel Symbol: Displays symbol on the MA PANEL
- Panel H/V Position: Displays MA Panel Horizontally or Vertically
- Moving Average Panel Position: Selection of MA Panel position on the chart
- Panel Text Size: The user can select panel text size (Tiny, Small, Normal, Large, Huge)
- Panel Text Color: Color selection for panel text
- Cross A: Displays moving averages bullish/bearish cross on the panel from "Moving Average Cross Settings"
- Cross B: Displays moving averages bullish/bearish cross on the panel from "Moving Average Cross Settings"
- Cross C: Displays moving averages bullish/bearish cross on the panel from "Moving Average Cross Settings"
- Panel MA Length: input value of panel moving average length
- Timeframe: Selection of timeframe for the panel moving average
- Type: Selection of MA type for the panel moving average
- Source: Selection of MA source(close, open etc) for the panel moving average
Feedback & Bug Report
if you found any bug in this indicator or any suggestion, please let me know. Please give feedback & appreciate it if you like to see more future updates and indicators. Thank you
