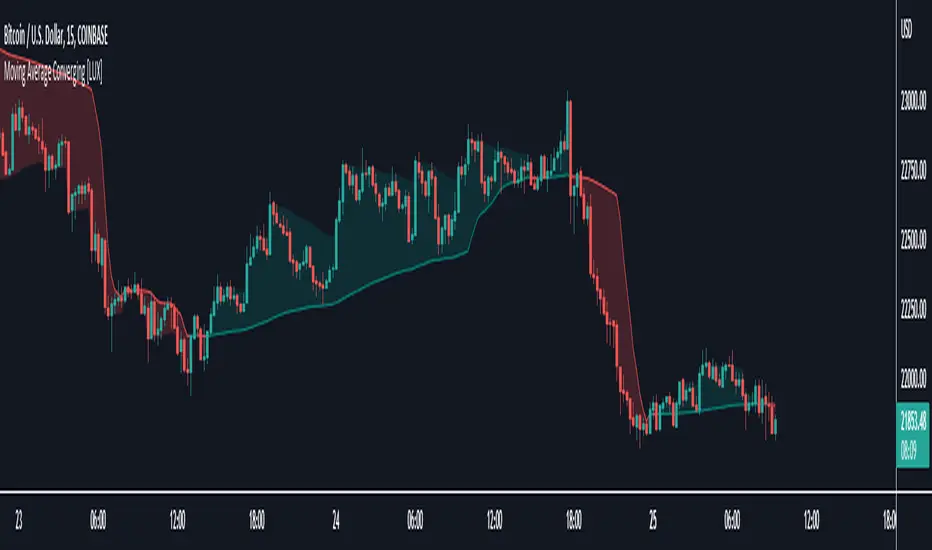
Moving Average Converging [LuxAlgo]This indicator returns a moving average converging toward the price the more a trend makes new higher-highs or lower-lows depending on the detected trend.
Settings
Length: Controls the initial moving average smoothing factor ( 2 / (Length + 1) ), as well as the period of rolling maximums/minimums.
Increment: Smoothing factor increment ( 2 / (Increment+ 1) ) for new higher-high/lower-low, lower values would return a faster converging moving average.
Fast: Fast moving average smoothing factor.
Usage
The proposed moving average can be used like most slow moving averages.
Having a moving average able to converge closer to the price the longer a trend lasts allows users to obtain more timely crosses. This practice can remind us of the Parabolic SAR or our TRAMA indicator:
Notice on the chart above how the moving average converges at an increasing rate with the occurrence of new high-highs/lower-lows.
Movingaveragecrossover
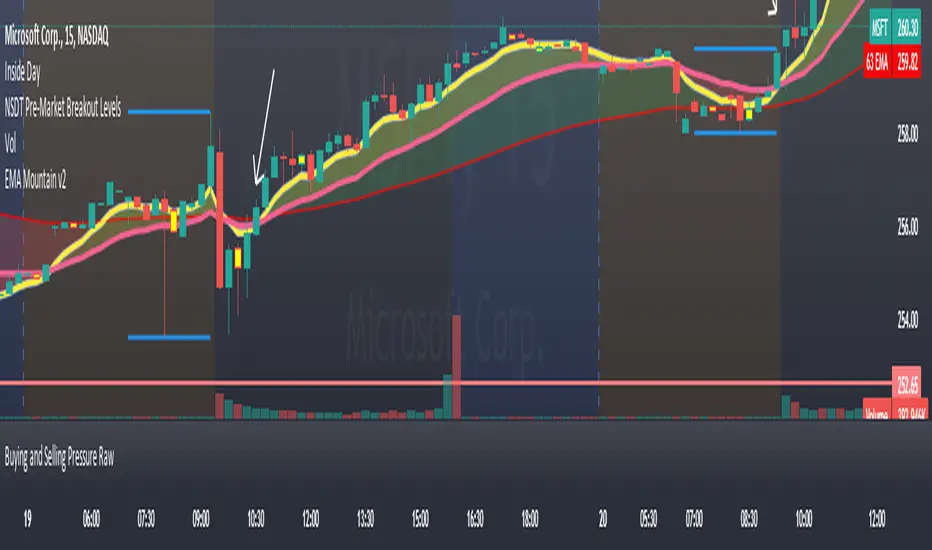
EMA Mountains Use this to track the daily moving avg's on the 15m chart.
by default it is set to be used on ext hours.
SweetSweetLucia: OnceADayA Typical Price Drummond Line, with a Floor Pivot Open Signal Line.
The Three Day Average, is not offset.
The crossing is significant in many strategies.
The circle is an intraday crossing.
The crosses are the signal openings.
Caution: divergence can cause a false positive.
This strategy is for Daily Bars Only!
Thanks.

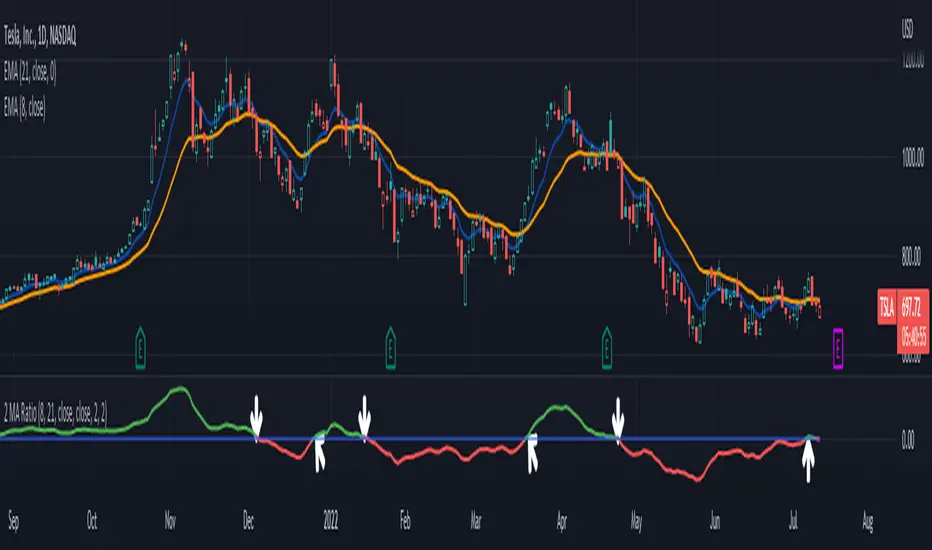
2 MA Ratio Can Help with Moving AveragesMany technical analysts use moving average crosses to assess trend changes. A faster-moving MA crossing above a slower-moving line may be viewed as a bullish signal. The opposite can apply to the downside.
While these methods may help analyze price direction, they can often force traders to wait until the cross occurs. Sometimes it may be useful to anticipate the event – or at least know it’s getting close.
That’s where the custom script 2 MA Ratio can be useful because it tracks the fast and slow moving averages. The fast MA is then shown as a percent of the slow MA. Positive readings indicate a bullish condition and vice versa for the negative.
It’s also color-coded to clearly illustrate when the crosses occur.
2 MA Ratio can handle simple moving averages (SMAs) and exponential moving averages (EMAs). It even lets you compare SMAs to EMAs. Users can choose between using open, high, low or closing prices as the inputs. (It defaults to Close.)
The chart above shows the short-term pair of the 8- and 21-day EMAs on Tesla (TSLA). The second chart below shows the same stock with the slower 50- and 200-day SMAs. Notice the “Golden Cross” last summer and the “Death Cross” in May:
TradeStation has, for decades, advanced the trading industry, providing access to stocks, options, futures and cryptocurrencies. See our Overview for more.
Important Information
TradeStation Securities, Inc., TradeStation Crypto, Inc., and TradeStation Technologies, Inc. are each wholly owned subsidiaries of TradeStation Group, Inc., all operating, and providing products and services, under the TradeStation brand and trademark. You Can Trade, Inc. is also a wholly owned subsidiary of TradeStation Group, Inc., operating under its own brand and trademarks. TradeStation Crypto, Inc. offers to self-directed investors and traders cryptocurrency brokerage services. It is neither licensed with the SEC or the CFTC nor is it a Member of NFA. When applying for, or purchasing, accounts, subscriptions, products, and services, it is important that you know which company you will be dealing with. Please click here for further important information explaining what this means.
This content is for informational and educational purposes only. This is not a recommendation regarding any investment or investment strategy. Any opinions expressed herein are those of the author and do not represent the views or opinions of TradeStation or any of its affiliates.
Investing involves risks. Past performance, whether actual or indicated by historical tests of strategies, is no guarantee of future performance or success. There is a possibility that you may sustain a loss equal to or greater than your entire investment regardless of which asset class you trade (equities, options, futures, or digital assets); therefore, you should not invest or risk money that you cannot afford to lose. Before trading any asset class, first read the relevant risk disclosure statements on the Important Documents page, found here: www.tradestation.com .
Weight Gain 4000 - (Adjustable Volume Weighted MA) - [mutantdog]Short Version:
This is a fairly self-contained system based upon a moving average crossover with several unique features. The most significant of these is the adjustable volume weighting system, allowing for transformations between standard and weighted versions of each included MA. With this feature it is possible to apply partial weighting which can help to improve responsiveness without dramatically altering shape. Included types are SMA, EMA, WMA, RMA, hSMA, DEMA and TEMA. Potentially more will be added in future (check updates below).
In addition there are a selection of alternative 'weighted' inputs, a pair of Bollinger-style deviation bands, a separate price tracker and a bunch of alert presets.
This can be used out-of-the-box or tweaked in multiple ways for unusual results. Default settings are a basic 8/21 EMA cross with partial volume weighting. Dev bands apply to MA2 and are based upon the type and the volume weighting. For standard Bollinger bands use SMA with length 20 and try adding a small amount of volume weighting.
A more detailed breakdown of the functionality follows.
Long Version:
ADJUSTABLE VOLUME WEIGHTING
In principle any moving average should have a volume weighted analogue, the standard VWMA is just an SMA with volume weighting for example. Actually, we can consider the SMA to be a special case where volume is a constant 1 per bar (the value is somewhat arbitrary, the important part is that it's constant). Similar principles apply to the 'elastic' EVWMA which is the volume weighted analogue of an RMA. In any case though, where we have standard and weighted variants it is possible to transform one into the other by gradually increasing or decreasing the weighting, which forms the basis of this system. This is not just a simple multiplier however, that would not work due to the relative proportions being the same when set at any non zero value. In order to create a meaningful transformation we need to use an exponent instead, eg: volume^x , where x is a variable determined in this case by the 'volume' parameter. When x=1, the full volume weighting applies and when x=0, the volume will be reduced to a constant 1. Values in between will result in the respective partial weighting, for example 0.5 will give the square root of the volume.
The obvious question here though is why would you want to do this? To answer that really it is best to actually try it. The advantages that volume weighting can bring to a moving average can sometimes come at the cost of unwanted or erratic behaviour. While it can tend towards much closer price tracking which may be desirable, sometimes it needs moderating especially in markets with lower liquidity. Here the adjustability can be useful, in many cases i have found that adding a small amount of volume weighting to a chosen MA can help to improve its responsiveness without overpowering it. Another possible use case would be to have two instances of the same MA with the same length but different weightings, the extent to which these diverge from each other can be a useful indicator of trend strength. Other uses will become apparent with experimentation and can vary from one market to another.
THE INCLUDED MODES
At the time of publication, there are 7 included moving average types with plans to add more in future. For now here is a brief explainer of what's on offer (continuing to use x as shorthand for the volume parameter), starting with the two most common types.
SMA: As mentioned above this is essentially a standard VWMA, calculated here as sma(source*volume^x,length)/sma(volume^x,length). In this case when x=0 then volume=1 and it reduces to a standard SMA.
RMA: Again mentioned above, this is an EVWMA (where E stands for elastic) with constant weighting. Without going into detail, this method takes the 1/length factor of an RMA and replaces it with volume^x/sum(volume^x,length). In this case again we can see that when x=0 then volume=1 and the original 1/length factor is restored.
EMA: This follows the same principle as the RMA where the standard 2/(length+1) factor is replaced with (2*volume^x)/(sum(volume^x,length)+volume^x). As with an RMA, when x=0 then volume=1 and this reduces back to the standard 2/(length+1).
DEMA: Just a standard Double EMA using the above.
TEMA: Likewise, a standard Triple EMA using the above.
hSMA: This is the same as the SMA except it uses harmonic mean calculations instead of arithmetic. In most cases the differences are negligible however they can become more pronounced when volume weighting is introduced. Furthermore, an argument can be made that harmonic mean calculations are better suited to downtrends or bear markets, in principle at least.
WMA: Probably the most contentious one included. Follows the same basic calculations as for the SMA except uses a WMA instead. Honestly, it makes little sense to combine both linear and volume weighting in this manner, included only for completeness and because it can easily be done. It may be the case that a superior composite could be created with some more complex calculations, in which case i may add that later. For now though this will do.
An additional 'volume filter' option is included, which applies a basic filter to the volume prior to calculation. For types based around the SMA/VWMA system, the volume filter is a WMA-4, for types based around the RMA/EVWMA system the filter is a RMA-2.
As and when i add more they will be listed in the updates at the bottom.
WEIGHTED INPUTS
The ohlc method of source calculations is really a leftover from a time when data was far more limited. Nevertheless it is still the method used in charting and for the most part is sufficient. Often the only important value is 'close' although sometimes 'high' and 'low' can be relevant also. Since we are volume weighting however, it can be useful to incorporate as much information as possible. To that end either 'hlc3' or 'hlcc4' tend to be the best of the defaults (in the case of 24/7 charting like crypto or intraday trading, 'ohlc4' should be avoided as it is effectively the same as a lagging version of 'hlcc4'). There are many other (infinitely many, in fact) possible combinations that can be created, i have included a few here.
The premise is fairly straightforward, by subtracting one value from another, the remaining difference can act as a kind of weight. In a simple case consider 'hl2' as simply the midrange ((high+low)/2), instead of this using 'high+low-open' would give more weight to the value furthest from the open, providing a good estimate of the median. An even better estimate can be achieved by combining that with 'high+low-close' to give the included result 'hl-oc2'. Similarly, 'hlc3' can be considered the basic mean of the three significant values, an included weighted version 'hlc2-o2' combines a sum with subtraction of open to give an estimated mean that may be more accurate. Finally we can apply a similar principle to the close, by subtracting the other values, this one potentially gets more complex so the included 'cc-ohlc4' is really the simplest. The result here is an overbias of the close in relation to the open and the midrange, while in most cases not as useful it can provide an estimate for the next bar assuming that the trend continues.
Of the three i've included, hlc2-o2 is in my opinion the most useful especially in this context, although it is perhaps best considered to be experimental in nature. For that reason, i've kept 'hlcc4' as the default for both MAs.
Additionally included is an 'aux input' which is the standard TV source menu and, where possible, can be set as outputs of other indicators.
THE SYSTEM
This one is fairly obvious and straightforward. It's just a moving average crossover with additional deviation (bollinger) bands. Not a lot to explain here as it should be apparent how it works.
Of the two, MA1 is considered to be the fast and MA2 is considered to be the slow. Both can be set with independent inputs, types and weighting. When MA1 is above, the colour of both is green and when it's below the colour of both is red. An additional gradient based fill is there and can be adjusted along with everything else in the visuals section at the bottom. Default alerts are available for crossover/crossunder conditions along with optional marker plots.
MA2 has the option for deviation bands, these are calculated based upon the MA type used and volume weighted according to the main parameter. In the case of a unweighted SMA being used they will be standard Bollinger bands.
An additional 'source direct' price tracker is included which can be used as the basis for an alert system for price crossings of bands or MAs, while taking advantage of the available weighted inputs. This is displayed as a stepped line on the chart so is also a good way to visualise the differences between input types.
That just about covers it then. The likelihood is that you've used some sort of moving average cross system before and are probably still using one or more. If so, then perhaps the additional functionality here will be of benefit.
Thanks for looking, I welcome any feedack

Pi Cycle Bottom IndicatorBack in June 2021, I was able to find two moving averages that crossed when Bitcoin reached it's cycle bottom, similar to Philip Swift's Pi-Cycle Top indicator.
The moving average pair used here was the x0.475 multiple of the 471 MA and the 150 EMA ( EMA to take into account of short term volatility ).
I have a more in-depth analysis and explanation of my findings on my medium page .
Trader Dončić.

Joe's Ultimate MA Ribbon (w/ Crossover Triggers)Tired of having to add multiple moving average indicators to your chart? Well, stop doing that.
Here's a sweet moving average ribbon (with 1-10 moving average lines!) that will make your charts look much cooler 😎.
Not only that, it also includes triggers for MA crossovers. So, yeah...you can pick which MA crossovers trigger for longs and shorts separately. Yup, you read that right.
Options:
Show/Hide MA Lines: Only show the lines you wanna see. No more. No less.
MA Type (can be different for each line!): EMA, SMA, SMMA (RMA), WMA, VWMA
MA Source (for each line): open, close, high, low, hl2, hlc3, ohlc4, hlcc4
MA Length (for each line): any number between 1 and 4999
Line Colors: Ooh, pretty.
Triggers: On or Off
Crossover Long Triggers: When _______ crosses over _______ on timeframe _______
Crossover Short Triggers: When _______ crosses over _______ on timeframe _______
Trigger Characters and Location

Moving Average Macro Trend FilterA simple indicator that adds a background fill to your chart based on a fast and slow moving average.
When the fast moving average is above the slow moving average, the background is green.
When the slow moving average is above the fast moving average, the background is red.
If the fast and slow moving average don't agree on direction, the background is yellow.
Pick between EMA, SMA, RMA, WMA
Select different timeframes for chart, slow MA, and fast MA

Moving Average Multitool CrossoverAs per request, this is a moving average crossover version of my original moving average multitool script .
It allows you to easily access and switch between different types of moving averages, without having to continuously add and remove different moving averages from your chart. This should make backtesting moving average crossovers much, much more easier. It also has the option to show buy and sell signals for the crossovers of the chosen moving averages.
It contains the following moving averages:
Exponential Moving Average (EMA)
Simple Moving Average (SMA)
Weighted Moving Average (WMA)
Double Exponential Moving Average (DEMA)
Triple Exponential Moving Average (TEMA)
Triangular Moving Average (TMA)
Volume-Weighted Moving Average (VWMA)
Smoothed Moving Average (SMMA)
Hull Moving Average (HMA)
Least Squares Moving Average (LSMA)
Kijun-Sen line from the Ichimoku Kinko-Hyo system (Kijun)
McGinley Dynamic (MD)
Rolling Moving Average (RMA)
Jurik Moving Average (JMA)
Arnaud Legoux Moving Average (ALMA)
Vector Autoregression Moving Average (VAR)
Welles Wilder Moving Average (WWMA)
Sine Weighted Moving Average (SWMA)
Leo Moving Average (LMA)
Variable Index Dynamic Average (VIDYA)
Fractal Adaptive Moving Average (FRAMA)
Variable Moving Average (VAR)
Geometric Mean Moving Average (GMMA)
Corrective Moving Average (CMA)
Moving Median (MM)
Quick Moving Average (QMA)
Kaufman's Adaptive Moving Average (KAMA)
Volatility-Adjusted Moving Average (VAMA)
Modular Filter (MF)

+ ALMA Trend DetectorHi, again. Here I have a nice moving average script designed to get you into trends and keep you in trends until the opportune moment comes to exit. And, as with any indicator, or suite of indicators, designed to get one into trends and keep him/her in a trend, they do not do so well in chop/ranging/mean reversion conditions, though I would say this one is better than most, otherwise I wouldn’t be fitting it into my trading system.
This is a huge improvement, in my opinion, over an indicator I found recently, and like quite a bit by samsmilesam, which you can find here: www.tradingview.com
In this adaptation of his script I changed a bunch of things, but kept the spirit of the indicator true.
This indicator utilizes three different length Arnaud Legoux moving averages, known for being extremely low lag, and incredibly adjustable (though I find the original authors settings excellent).
While he has buy and sell signals triggering regardless of the fast and slow ma’s position to the trending ma, I actually take the trending ma into account. Furthermore, I wouldn’t say I coded in signals indicating buying and selling, but that I coded in signs that answer the question “what kind of trend are we in?” as well as possible ideal trade exits (which couuuuuld also be taken as entries, but aren’t necessarily meant to).
So, the deets on this:
1) 5 period, 20 period, and 70 period ALMAs. Fast, slow and trend. All customizable independent of each other (unlike the sam’s). All three also change color based on their own individual trends.
2) Uptrends are identified when price is closing above the Trend ma, and both Fast and Slow ma’s are above the Trend ma, and vice versa for downtrends. There are in-between points when a trend is not identified, and this is when price closes above or below the Trend ma, but the other two ma’s have not crossed it. Background color is used to identify the trend.
3) Trade exits are based on closing price and Fast and Slow ma’s relative to the Trend ma, once again. To signal exiting an uptrend price must close below both Fast and Slow ma’s and both Fast and Slow ma’s must be above the Trend ma; and vice versa for exiting a down trend. Obviously there may be false signals, but there are fewer signals, and I think it’s a better strategy than most. I prefer to filter out as much noise as possible. There’s little worse in my opinion than an indicator that gives too many false signals, but obviously it’s impossible to remove them all. Some discretion is necessary on the part of the trader.
4) So what does this mean for trade entries? Well, you can certainly enter a trade on a signal for an exit (go long on a short exit signal) if the chart looks good for that. Or you can wait for trend confirmation with the background color, entering on a pullback to the ma’s perhaps. Or you can enter in the “no man’s land” in between trends. If you’ve exited and price continues on trending your best bet would be to wait for a pullback into the ma’s or a s/r level, or look for the next candle that closes beyond the Fast and Slow ma’s. These are just thoughts of mine.
5) Lastly, there are alert conditions set for uptrends, downtrends and both long and short exits!
Enjoy the indicator! I think with some sort of bands or channels for those times when the market is rangebound or in chop, you could really crush it with this.

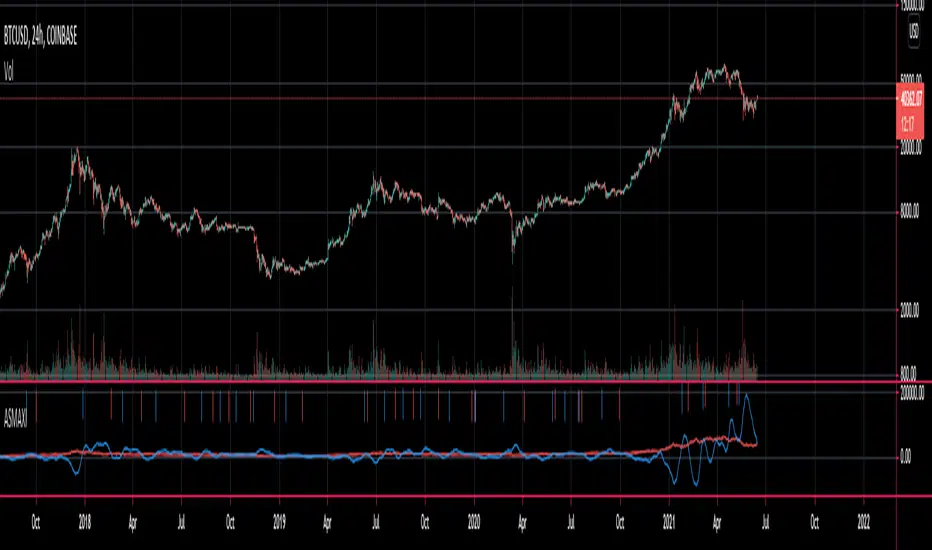
Relative strength DivergenceThe following indicator uses relative comparison of two assets by the formula n/s3, where n is the t asset on the screen while s3 the underlying assets it is being compared to. The usefulness of the indicator is to primarily compare the assets being traded like BTC (most prominent crypto with largest market cap), with some other crypto like TRX(this has a relatively smaller market cap). Since we get a broader market view through relative comparison of the two assets, the most important function is to find the edge through divergences. Just like RSI the divergences rules would be the same and most important trades would be trades in the direction of the trend along accompanies by divergences that are in line with the trend. Simple divergences work for the best trades with default settings. Although BTCUSD is the default asset to compare with it can be switched with any other asset as well, but it is very much preferred that one uses some type of index as the base asset for comparison. Other than that for simple trading the trend MA crossover can also be used as a signal for simple trend following.

Multiple Time Frames Moving Averages (x3)This indicator is a set of 3 moving averages for which you can configure the type of the moving averages , their length , and of course the time frame . The moving averages you can choose from are:
- Simple Moving Average ( SMA )
- Exponential Moving Average ( EMA )
- Weighted Moving Average ( WMA )
- Running Moving Average (RMA)
- Hull Moving Average ( HMA )
- Volume Weighted Moving Average ( VWMA )
- Arnaud Legoux Moving Average ( ALMA )
The time-frames you can choose from - minutes (1, 3, 5, 15, 45), hours (1, 2, 3, 4, 12), days (1, 3), weekly or monthly .
Overall, it is a minimalistic indicator. No major improvements or trading logic like some of my other indicators, but I did make it slightly easier to use and visually appealing. The MAs' colors change from light to dark green/blue/red depending on the trend - bullish or bearish respectively. Initially, those were changing from green to red (based on direction) but it became a bit confusing when they started crossing each other. Anyway, feel free to change those colors to whatever you like.
If you have suggestions on how to improve this indicator or ideas about new ones, please drop me a line. Thanks.

Anticipated Simple Moving Average Crossover IndicatorIntroducing the Anticipated Simple Moving Average Crossover Indicator
This is my Pinescript implementation of the Anticipated Simple Moving Average Crossover Indicator
Much respect to the original creator of this idea Dimitris Tsokakis
This indicator removes one bar of lag from simple moving average crossover signals with a high degree of accuracy to give a slight but very real edge.
Moving Averages
A moving average simplifies price data by smoothing it out by averaging closing prices and creating one flowing line which makes seeing the trend easier.
Moving averages can work well in strong trending conditions, but poorly in choppy or ranging conditions.
Adjusting the time frame can remedy this problem temporarily, although at some point, these issues are likely to occur regardless of the time frame chosen for the moving average(s).
While Exponential moving averages react quicker to price changes than simple moving averages. In some cases, this may be good, and in others, it may cause false signals.
Moving averages with a shorter look back period (20 days, for example) will also respond quicker to price changes than an average with a longer look back period (200 days).
Trading Strategies — Moving Average Crossovers
Moving average crossovers are a popular strategy for both entries and exits. MAs can also highlight areas of potential support or resistance.
The first type is a price crossover, which is when the price crosses above or below a moving average to signal a potential change in trend.
Another strategy is to apply two moving averages to a chart: one longer and one shorter.
When the shorter-term MA crosses above the longer-term MA, it's a buy signal, as it indicates that the trend is shifting up. This is known as a "golden cross."
Meanwhile, when the shorter-term MA crosses below the longer-term MA, it's a sell signal, as it indicates that the trend is shifting down. This is known as a "dead/death cross."
MA and MA Cross Strategy Disadvantages
Moving averages are calculated based on historical data, and while this may appear predictive nothing about the calculation is predictive in nature.
Moving averages are always based on historical data and simply show the average price over a certain time period.
Therefore, results using moving averages can be quite random.
At times, the market seems to respect MA support/resistance and trade signals, and at other times, it shows these indicators no respect.
One major problem is that, if the price action becomes choppy, the price may swing back and forth, generating multiple trend reversal or trade signals.
When this occurs, it's best to step aside or utilize another indicator to help clarify the trend.
The same thing can occur with MA crossovers when the MAs get "tangled up" for a period of time during periods of consolidation, triggering multiple losing trades.
Ensure you use a robust risk management system to avoid getting "Chopped Up" or "Whip Sawed" during these periods.
Variable Length Moving AverageThe Variable Length Moving Average was created by George R. Arrington Ph.D. (Stocks & Commodities V. 9:6 (219-223)) and I'm really loving this indicator. It is a great moving average that hugs the price very closely and it is fully adjustable to your needs. It detects signals extremely well and I have color coded the moving average line to make it very easy to interpret.
This is not to be confused with the Variable Moving Average created by Tushar S. Chande and as of now I haven't seen any other script for this moving average out there yet.
Please let me know if you would like me to write any other scripts for indicators you would like to see!

7EMA_5MA (G/D + Bias + 12/26 Signal)This script alow you to survey multiple crossing signals as Golden/Death cross (MA50/200), Institutional Bias (EMA9/18), or EMA 12/26 crossing. You can show/hide all EMAs/MAs and show/hide all signals. Default config displays EMA 50/100/200 and MA 20. Full script includes display of EMA 9/18/12/26/50/100/200 and MA 20/21/50/100/200.


