4HR JRSX Swing Bias (RB Trading)4HR JRSX Swing Bias (RB Trading)
The 4HR JRSX Swing Bias is a higher timeframe swing analysis script designed to evaluate directional pressure, momentum decay, and price acceptance on the four hour chart. It is built specifically for GBPUSD and EURUSD and is not intended for use on other markets or timeframes.
It highlights conditions where directional pressure weakens, rotates, and is then confirmed by price behavior.
Intended Use and Scope
• Timeframe: 4 hour only
• Markets: GBPUSD and EURUSD
• Style: Swing bias and rotation analysis
• Signal frequency: Intentionally low, typically 10 to 15 setups per year per pair
• Alerts: Available for confirmed setups
• Not designed for Asia session conditions
Core Framework
The script operates through a sequential three-stage process. A setup can only appear when all stages align.
Directional pressure evaluation
Momentum exhaustion and rotation
Candle-based price confirmation
This structure prevents signals from appearing during noise or low-quality market conditions.
Directional Pressure Evaluation
The first stage measures directional pressure across multiple four hour candles using a smoothed strength calculation. This step evaluates whether bullish or bearish participation is dominant over time rather than reacting to isolated price spikes.
When directional pressure is unclear or neutral, the script remains inactive.
Momentum Exhaustion and Rotation
Once directional pressure is established, the script monitors for loss of momentum. Exhaustion is identified when pressure fails to expand despite continued price movement.
This decay often appears near the later stages of a directional move and signals increased probability of rotation rather than continuation.
Price Acceptance and Confirmation
The final stage requires price to confirm the rotation through candle behavior. No intrabar logic is used.
• Buy confirmation requires either
– a bullish candle close following downside pressure exhaustion
– or a pinbar showing strong rejection of lower prices
• Sell confirmation requires either
– a bearish candle close following upside pressure exhaustion
– or a pinbar showing strong rejection of higher prices
A setup is only confirmed after the four hour candle has fully closed.
Stop and Target Reference Plotting
When a setup is confirmed, the script plots visual reference levels:
• A stop reference beyond the exhaustion zone where the setup would be invalidated
• A projected target reference calculated using a fixed 4R multiple relative to the stop distance
These levels are provided for structural planning and consistency. They do not represent predictions or guarantees.
Why the Four Hour Chart Is Required
The pressure and exhaustion calculations are tuned to higher-timeframe behavior. On lower timeframes, momentum cycles occur too rapidly and lead to frequent false rotations.
The four hour chart provides the balance required for meaningful pressure, decay, and acceptance to develop.
Session Considerations
The script is not intended for Asia session evaluation. Reduced liquidity during those hours can distort momentum behavior and reduce signal quality. Best evaluation occurs during or after London and New York participation.
Chart Presentation Guidelines
• Use the script on a clean chart
• Avoid stacking other oscillators or momentum tools
• If drawings are used, they should be limited to swing structure or key price levels
All visual elements should support understanding of the script output.
Important Notes
This script analyzes historical price behavior to identify structural swing conditions. It does not predict future price movement or ensure outcomes. Users should test the tool, understand its confirmation rules, and apply independent risk management.
Médias Móveis

Green AverageGA (Green Average) is used as a bias and context tool. The indicator is not an entry signal by itself,
but answers the question: Should I even be looking for longs or shorts right now?
1. What the indicator shows
• BP (green line): buying pressure – how much of the upward movement is driven by green
candles.
• SP (red line): selling pressure – how much of the downward movement is driven by red candles.
• GA % (box): proportion of candles that are green (frequency / flow).
2. Quick market read (3 seconds)
• BP above SP → bullish bias
• SP above BP → bearish bias
• Lines close together → chop / uncertain market
• Both lines spiking simultaneously → high energy / volatility
3. Core rules
• Bias first, entry second: trade only in the direction of dominant pressure.
• Crossovers indicate regime shifts, not automatic entries.
• GA % is context, not a buy/sell signal.
4. Entry models
A) Trend continuation
BP > SP with clear separation. Wait for a pullback (VWAP, support, MA) and enter on trend
resumption.
B) Regime shift after crossover
After a BP/SP crossover, wait for price confirmation (15m swing break or VWAP reclaim).
C) Mean reversion (range)
Only when both lines are low and cross frequently. Small targets, defensive sizing.
5. Common mistakes
• Taking every crossover as a trade
• Oversizing when lines are glued together
• Assuming high GA % guarantees upside
6. Day types
• Trend day: BP dominates, GA % often above 52–55.
• Chop day: BP ≈ SP, GA % around 50.
• Distribution: GA % high but SP takes control.
7. Default settings (ETH 5m)
• Window N = 24 (≈ 2 hours)
• BP/SP smoothing = 3
• GA used together with VWAP and price structure

Trend Fusion Indicator🎯 Trend Fusion Indicator🎯
Professional trading indicator combining EMA momentum with Supertrend volatility for high-probability signals.
📊KEY FEATURES:
• 9 EMA & Supertrend (10,3) crossover signals
• Visual trend direction with colored fills
• Buy/Sell arrows at crossover points
• Real-time trend tracking
• Clean, professional interface
⚡SIGNAL LOGIC:
✅ BUY: When EMA crosses ABOVE Supertrend
✅ SELL: When EMA crosses BELOW Supertrend
🎨VISUAL INDICATORS:
• Green Zone/Fill: Bullish trend (EMA > Supertrend)
• Red Zone/Fill: Bearish trend (EMA < Supertrend)
• Triangle Arrows: Entry signals
• Background Colors: Trend confirmation
⚙️CUSTOMIZABLE SETTINGS:
• EMA Length (Default: 9)
• Supertrend ATR Length (Default: 10)
• Supertrend Factor (Default: 3.0)
🔔ALERTS INCLUDED:
• Buy Alert: EMA crosses above Supertrend
• Sell Alert: EMA crosses below Supertrend
📈 BEST FOR:
• Swing Trading
• Day Trading
• Trend Following
• Market Reversals
⚠️ DISCLAIMER: This indicator is for educational purposes only.
Trading involves risk. Not financial advice. Use at your own risk.

Forexsebi - DAX Future Psychological Levels - TrendflowTrendflow is an advanced TradingView indicator combining psychological price levels with trend and multi-timeframe analysis.
The indicator automatically plots psychological levels in around the current price. Each level is visualized using horizontal lines and price zones (boxes) to clearly highlight potential support and resistance areas.
Psychological Levels – Trendflow ist ein fortschrittlicher TradingView-Indikator , der wichtige psychologische Preislevel mit einer klaren Trend- und Multi-Timeframe-Analyse kombiniert.
Trend Analysis with SMAs
SMA 50 & SMA 200 plotted directly on the chart
Individually toggleable
Clear color separation for fast trend recognition
Multi-Timeframe SMA Trend Table
Trend status (BULLISH / BEARISH / NEUTRAL) across:
5M, 15M, 1H, 4H, 1D
Logic: Price relative to SMA 50 & SMA 200
Color-coded, easy-to-read table
Info Box
Current Gold price
Nearest psychological level above and below price
Alert System
Alerts when price approaches a psychological level
User-defined alert distance

Forexsebi - NASDAQ Psychological Levels - TrendflowTrendflow is an advanced TradingView indicator combining psychological price levels with trend and multi-timeframe analysis.
The indicator automatically plots psychological levels in around the current price. Each level is visualized using horizontal lines and price zones (boxes) to clearly highlight potential support and resistance areas.
Psychological Levels – Trendflow ist ein fortschrittlicher TradingView-Indikator , der wichtige psychologische Preislevel mit einer klaren Trend- und Multi-Timeframe-Analyse kombiniert.
Trend Analysis with SMAs
SMA 50 & SMA 200 plotted directly on the chart
Individually toggleable
Clear color separation for fast trend recognition
Multi-Timeframe SMA Trend Table
Trend status (BULLISH / BEARISH / NEUTRAL) across:
5M, 15M, 1H, 4H, 1D
Logic: Price relative to SMA 50 & SMA 200
Color-coded, easy-to-read table
Info Box
Current Gold price
Nearest psychological level above and below price
Alert System
Alerts when price approaches a psychological level
User-defined alert distance

Forexsebi - GBPJPY Psychological Levels - TrendflowTrendflow is an advanced TradingView indicator combining psychological price levels with trend and multi-timeframe analysis.
The indicator automatically plots psychological levels in around the current price. Each level is visualized using horizontal lines and price zones (boxes) to clearly highlight potential support and resistance areas.
Psychological Levels – Trendflow ist ein fortschrittlicher TradingView-Indikator , der wichtige psychologische Preislevel mit einer klaren Trend- und Multi-Timeframe-Analyse kombiniert.
Trend Analysis with SMAs
SMA 50 & SMA 200 plotted directly on the chart
Individually toggleable
Clear color separation for fast trend recognition
Multi-Timeframe SMA Trend Table
Trend status (BULLISH / BEARISH / NEUTRAL) across:
5M, 15M, 1H, 4H, 1D
Logic: Price relative to SMA 50 & SMA 200
Color-coded, easy-to-read table
Info Box
Current Gold price
Nearest psychological level above and below price
Alert System
Alerts when price approaches a psychological level
User-defined alert distance

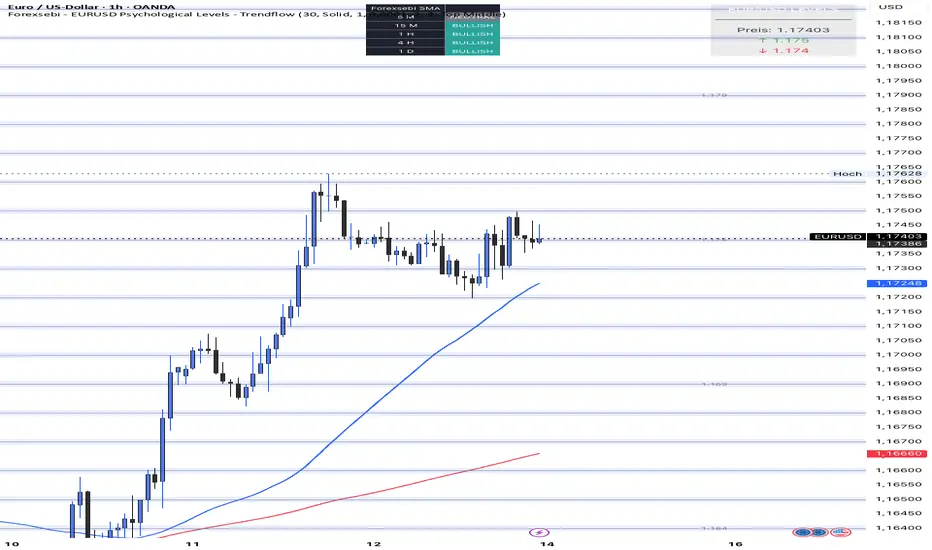
Forexsebi - EURUSD Psychological Levels - TrendflowTrendflow is an advanced TradingView indicator combining psychological price levels with trend and multi-timeframe analysis.
The indicator automatically plots psychological levels in around the current price. Each level is visualized using horizontal lines and price zones (boxes) to clearly highlight potential support and resistance areas.
Psychological Levels – Trendflow ist ein fortschrittlicher TradingView-Indikator , der wichtige psychologische Preislevel mit einer klaren Trend- und Multi-Timeframe-Analyse kombiniert.
Trend Analysis with SMAs
SMA 50 & SMA 200 plotted directly on the chart
Individually toggleable
Clear color separation for fast trend recognition
Multi-Timeframe SMA Trend Table
Trend status (BULLISH / BEARISH / NEUTRAL) across:
5M, 15M, 1H, 4H, 1D
Logic: Price relative to SMA 50 & SMA 200
Color-coded, easy-to-read table
Info Box
Current Gold price
Nearest psychological level above and below price
Alert System
Alerts when price approaches a psychological level
User-defined alert distance
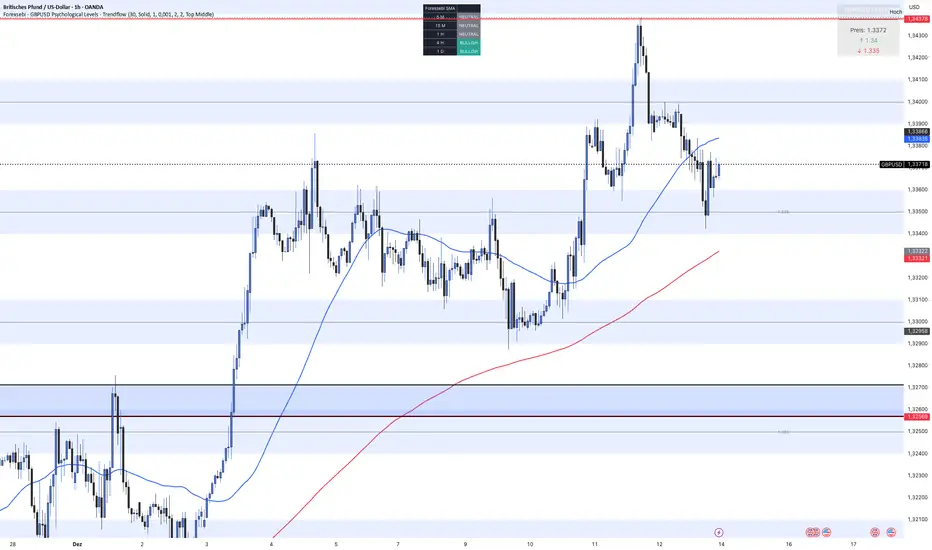
Forexsebi - GBPUSD Psychological Levels - TrendflowTrendflow is an advanced TradingView indicator combining psychological price levels with trend and multi-timeframe analysis.
The indicator automatically plots psychological levels in around the current price. Each level is visualized using horizontal lines and price zones (boxes) to clearly highlight potential support and resistance areas.
Psychological Levels – Trendflow ist ein fortschrittlicher TradingView-Indikator , der wichtige psychologische Preislevel mit einer klaren Trend- und Multi-Timeframe-Analyse kombiniert.
Trend Analysis with SMAs
SMA 50 & SMA 200 plotted directly on the chart
Individually toggleable
Clear color separation for fast trend recognition
Multi-Timeframe SMA Trend Table
Trend status (BULLISH / BEARISH / NEUTRAL) across:
5M, 15M, 1H, 4H, 1D
Logic: Price relative to SMA 50 & SMA 200
Color-coded, easy-to-read table
Info Box
Current Gold price
Nearest psychological level above and below price
Alert System
Alerts when price approaches a psychological level
User-defined alert distance
Forexsebi - GOLD Psychological Levels - TrendflowPsychological GOLD levels every $50 with clear zones, highlighted $100 & $500 levels, SMA 50 & 200, and a multi-timeframe trend table. Perfect for structure, trend, and rejection trading on XAUUSD.
Psychologische GOLD-Levels in 50-Dollar-Abständen mit klaren Zonen, 100- & 500-Dollar-Highlights, SMA 50 & 200 sowie einer Multi-Timeframe Trend-Tabelle. Ideal für Struktur-, Trend- und Rejection-Trading auf XAUUSD.
Key Features
Psychological Gold Levels
Automatic levels every $50
Adjustable number of levels above and below current price
Highlighted zones around each level for clearer reaction areas
Special Level Highlighting
$100 levels (xx00) highlighted for medium importance
$500 levels (x000 / x500) marked as major psychological levels
Different colors and stronger line thickness for key zones
Price Labels
Clean price labels displayed on the chart
Special symbols for 100 and 500 dollar levels
Trend Analysis with SMAs
SMA 50 & SMA 200 plotted directly on the chart
Individually toggleable
Clear color separation for fast trend recognition
Multi-Timeframe SMA Trend Table
Trend status (BULLISH / BEARISH / NEUTRAL) across:
5M, 15M, 1H, 4H, 1D
Logic: Price relative to SMA 50 & SMA 200
Color-coded, easy-to-read table
Displays the current trading session (Asia, Frankfurt, London, NY)
Info Box
Current Gold price
Nearest psychological level above and below price
Alert System
Alerts when price approaches a psychological level
User-defined alert distance
Distinction between normal, $100 and $500 levels

SB-VDEMA + PivotsBest use - Intraday Scalping ( 1 Mt, 3 Mts, 5 Mts )
Uses Volatility weighted DEMA for smoother and reliable signals.
One can use dynamic colour coding of VWDEMA for entering call or puts. VWAP and Henkin ashi Supertrend is also there but, i think VWDEMA is quite enogh for decision making.

SB - Ultimate Clean Trend Pro Uses dynamic Moving colour coding for spotting chage of bias. Use set up with keeping VWAP in reference.

VWAP Histogram with EMAsBased on VWAP and Moving Averages.
Bias turns +ve if dynamic colour of the moving averages turns green. All moving avaerages are customisable.

Stepped Multi Timeframe MAs with PDH PDL TDH TDL Dynamic Labels
Plots stepped (blocky) higher‑timeframe moving averages and VWAP on the current chart (HMA/EMA/VWMA/SMA/VWAP toggles).
Automatically switches MA source to the chart’s timeframe on Daily/Weekly/Monthly (e.g., Weekly chart shows weekly MAs), while intraday charts can use a user-selected higher timeframe.
Draws Previous Day High/Low (PDH/PDL) anchored from the exact candle that formed the level, then extends the line across the chart up to the latest bar.
Draws Today’s High/Low (TDH/TDL) the same way, and updates dynamically as new intraday highs/lows are made (the anchor shifts to the new wick candle).
Keeps labels readable by placing them above/below each line with no background and a clean grey style, and repositions label X based on the visible chart window (so labels stay at a consistent % from the right edge while you pan/zoom)

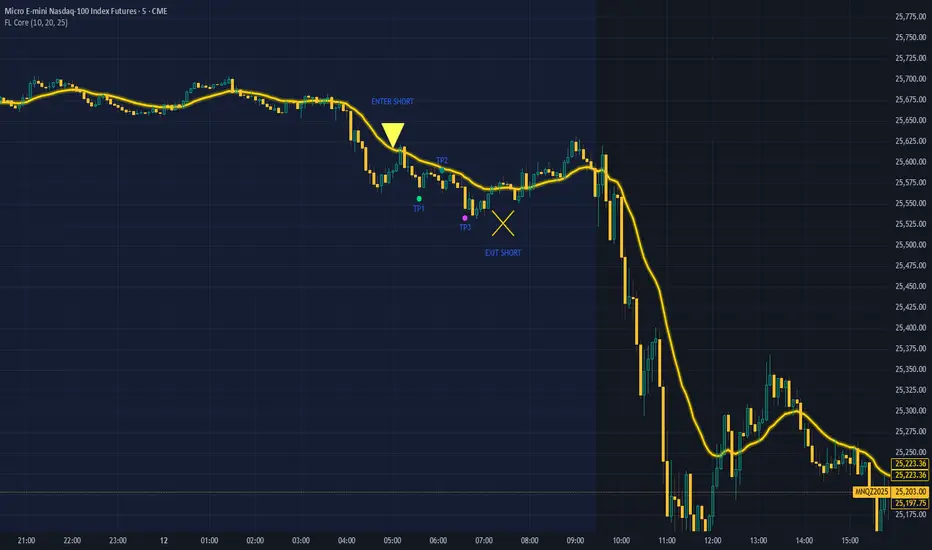
FL Core Signals Only FL Core shows only what matters: where to enter, where to exit, and where prof
No indicator noise — just confirmed decision points on a clean chart.
Designed for traders who value structure, patience, and clarity.
What FL Core Does
FL Core marks:
ENTER LONG
ENTER SHORT
AND
EXIT SHORT
TP1 / TP2 / TP3 profit targets
All signals are generated using a fixed, non-repainting ruleset and are confirmed only after candle close.
How It Trades (High Level)
Identifies momentum shifts using internal trend logic
Requires a full candle confirmation before signaling entries
Holds trades until momentum breaks, then signals exit
Tracks profit targets automatically in points
No guessing. No anticipation. No repainting.
Session Rules
FL Core is hard-wired to operate only between 4:00 AM and 4:00 PM (exchange time).
Signals outside of this window are intentionally ignored to avoid low-liquidity and overnight conditions.
Chart Design Philosophy
This version intentionally hides all underlying indicators and displays only:
Clean entry markers
Clean exit markers
Profit plate
A single gold Exit Rail that visually guides trade management
The focus stays on execution and decision-making, not indicator interpretation.
Profit Targets
Default profit targets are:
TP1: 25 points
TP2: 40 points
TP3: 60 p
Targets can be adjusted by the user.
Note: Default profit targets are optimized for NQ/MNQ, which was the primary instrument used during testing.
Traders using ES/MES should reduce target distances to better match volatility.
Important Notes
FL Core is an indicator, not an automated trading system
Stop-loss placement is handled manually according to your trading plan
Signals are designed to encourage discipline and patience, not over-trading
Marker placement (above/below bar) is intentional and should not be changed
Who This Is For
✔ Beginner traders
✔ Traders overwhelmed by indicators
✔ Traders who want clear structure and rules
✔ Traders focused on execution discipline
Who This Is NOT For
✘ Traders looking for fully automated execution
✘ Traders who want constant signals
✘ Traders who ignore risk management
Final Thought
FL Core does not try to predict the market.
It helps you wait for confirmation, execute cleanly, and manage trades with structure.
If you want fewer decisions, clearer trades, and a calmer trading experience — this is where you start.
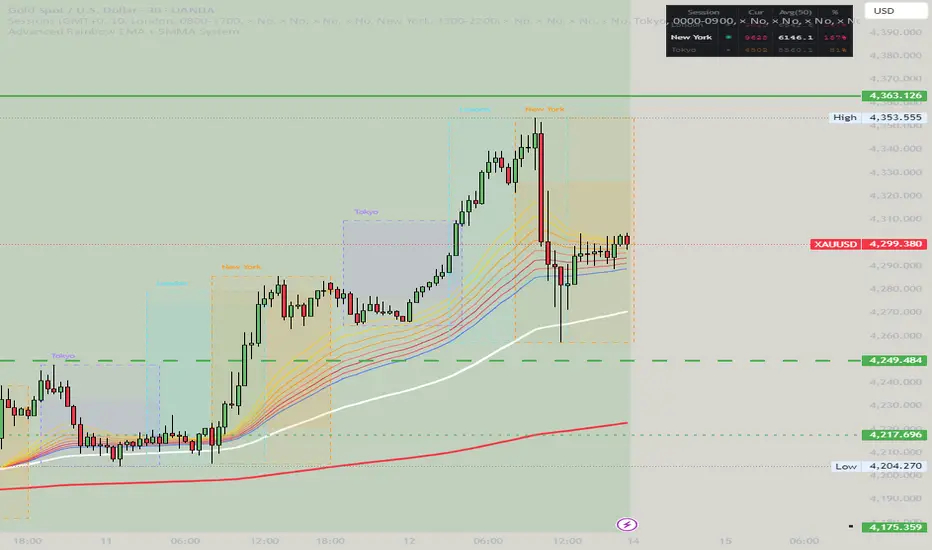
Advanced Rainbow EMA + SMMA System - VILLAGE PILOT Advanced Rainbow EMA + SMMA System
This custom indicator overlays eight rainbow‑colored EMAs (20, 25, 30, 35, 40, 45, 50, 55) together with two Smoothed Moving Averages (SMMA 50 in white, SMMA 200 in red).
Features:
🌈 Rainbow EMAs: Smooth gradient from yellow → gold → orange → dark orange → tomato → crimson → red → blue, showing short‑ to medium‑term momentum.
⚪🔴 Smoothed Moving Averages: Thick white SMMA (50) and thick red SMMA (200) for long‑term trend context.
🟩🟥 Background shading: Green when EMAs align bullish and SMMA 50 > SMMA 200, red when bearish.
📈📉 Signal arrows: “BUY” labels on Golden Cross (SMMA 50 crossing above SMMA 200), “SELL” labels on Death Cross (SMMA 50 crossing below SMMA 200).
🔔 Alerts: Built‑in TradingView alerts for Golden/Death Cross and for strong bullish/bearish EMA alignment.
Use case: This tool helps traders quickly visualize short‑term momentum against long‑term smoothed trend direction. It highlights strong trending conditions, potential reversals, and crossover signals, making it suitable for swing trading, trend following, and confirmation of entries/exits.
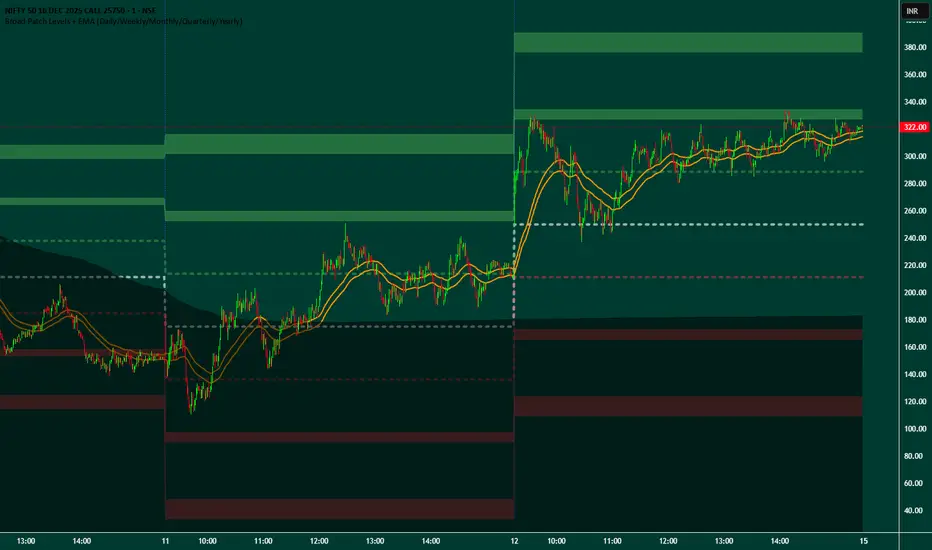
Broad Patch Levels + EMA (Daily/Weekly) with Directional AlertsThis indicator provides dynamic support and resistance levels along with trend guidance using EMA lines for daily or weekly timeframes. It is fully customizable, offering toggles for individual levels, trend lines, and alert notifications.
Key highlights:
Clearly visualize key market levels for potential trade entries and exits.
Monitor trend direction with EMA-based guidance.
Receive alerts when price interacts with important levels or trend zones.
Configurable visibility and alert options for a clean and personalized chart layout.
Ideal for professional traders looking for a structured, easy-to-read market perspective without exposing proprietary methods or calculations.
MNQ DP Levels and 1m high frequency HP+MP trading signalsidea to trade off QQQ DPs converted to NQ (dont ask me :) )on 1m chart focusing only on MP,HP triggers and scaling in down to a downside DP as an exit.
Disclaimer: This tool is for educational purposes only and does not constitute financial advice. Past performance does not guarantee future results.

BIGG CHIEFF RWB MASTER v2.0 (Indicator) [v1.0]Here is a **clean, professional TradingView indicator description** you can paste directly into the script description. It explains the *logic and philosophy* without exposing proprietary specifics, while still sounding robust and credible.
---
## 📊 Indicator Overview
This indicator is a **rule-based EMA crossover strategy built on price action, opening range structure, directional bias, and momentum confirmation**.
It is designed for intraday trading during the New York session and adapts to both time-based and tick-based charts.
The system focuses on **clarity, patience, and consistency**, filtering out low-quality conditions while aligning trades with higher-probability market structure.
---
## 🧭 Core Concepts
### Opening Range Structure
* The strategy uses the **first 15 minutes of the New York session** to define an Opening Range.
* This range establishes **key intraday structure**, including:
* High
* Low
* Midpoint
* The Opening Range remains visible for the entire session and resets each day.
* Trades are framed around **breaks, retests, and rejections** of this structure.
---
## 📈 Trend, Bias & Momentum
### Directional Bias
Bias is determined by:
* **EMA stacking order**
* **Price location relative to the Opening Range**
* Optional **higher-timeframe trend alignment**
Once bias is confirmed:
* Trades are only taken **in the direction of that bias**
* Opposing trades are locked out until structure meaningfully changes
This prevents overtrading and reduces whipsaws in choppy conditions.
---
### Higher-Timeframe Alignment (Optional)
A higher-timeframe trend filter can be enabled to:
* Keep trades aligned with the broader market direction
* Improve win rate during trending sessions
* Reduce countertrend entries
---
## ⚡ Volatility & Time Filters
To avoid low-quality trades, the system includes:
* **Volatility filtering** to prevent entries during compressed or dead markets
* **Session time windows** to focus on the most liquid trading hours
* Optional **no-trade time blocks** for news or known high-risk periods
---
## 💧 Liquidity Awareness
The indicator accounts for **key liquidity zones**, such as:
* Prior session highs and lows
* Overnight and premarket extremes
Trades are filtered to ensure there is **sufficient room for reward** before running into nearby liquidity, helping avoid premature exits.
---
## ✅ Entry Logic (Primary Mode)
Trades are based on **structure first, confirmation second**:
* Breakouts must be confirmed by **candle closes**, not wicks
* Entries occur on **retracements and rejection candles**, not chase candles
* Priority is given to cleaner retests closer to structure
* Optional controls allow limiting trades to **first-touch setups only**
This encourages patience and avoids emotional entries.
---
## 🛑 Risk Management & Trade Management
The system is built around **R-multiple consistency**, not fixed targets.
* Stops are volatility-based
* Multiple profit targets can be enabled
* Optional partial profits and trailing stop logic are included
* Trailing behavior can follow momentum or structure once price moves favorably
Everything is designed to **protect capital first and scale winners second**.
---
## 🧠 Philosophy
This indicator is not designed to predict the market.
It is designed to **react intelligently** to what price is already confirming.
It prioritizes:
* Structure over indicators
* Bias over impulse
* Confirmation over hope
* Risk management over win rate
Best results come from disciplined execution, patience, and respecting the filters.

Trading Dashboard + Daily SMAsThis indicator is an all-in-one workspace overlay designed for futures and intraday traders. It consolidates critical market internals, session statistics, and daily technical levels into a single, highly customizable dashboard.
The goal of this script is to reduce chart clutter by placing essential data into a clean table while overlaying key Daily Moving Averages onto your intraday timeframe.
Key Features:
1. Comprehensive Market Internals Dashboard Monitor the health of the broad market directly from your chart. The dashboard includes real-time data for:
VIX: Volatility Index.
TICK & TRIN: Sentiment and volume flow indicators.
Breadth Data: ADD, ADV, and DECL (Advance/Decline lines and volume).
Multi-Ticker Watch: Monitor 3 additional assets (Defaults: NQ, RTY, YM) with real-time price and % change.
2. Session Statistics & Probabilities Automated calculation of intraday statistics based on a user-defined lookback period (default 100 days):
RTH Data: Tracks Regular Trading Hours Open, Close, and Range.
Contextual ATR: Compares current RTH range to the 14-day ATR.
Probabilities: Displays historical probabilities for "Gap Fill," "Break of Yesterday's High," and "Break of Yesterday's Low."
3. Daily SMAs on Intraday Charts Plot key Daily Simple Moving Averages (21, 50, 200) directly on your lower timeframe charts (1m, 5m, etc.) without switching views.
Fully Customizable: Toggle each SMA on/off individually.
Color Control: Users can change the color of every SMA line to fit their theme.
4. "Dark Mode" Optimized The dashboard features a specific "Very Dark Grey" (#121212) background by default, designed to reduce eye strain and blend seamlessly with dark-themed trading setups.
Settings & Customization:
Session Times: Define your specific RTH start and end times.
Symbols: All ticker symbols (VIX, ADD, NQ, etc.) can be customized in the settings menu to match your data provider.
Visibility: Every element in the table and every SMA line has a toggle switch. You only see what you need.
Visuals: Change table position, text size, and line colors.
Author's Instructions: Configuration Guide
This script relies on specific ticker symbols to pull data for Market Internals (TICK, TRIN, ADD) and the Watchlist. Depending on your data subscription plan (CME, CBOE, etc.), you may need to adjust the default symbols to match what you have access to.
1. How to Change Symbols
Add the indicator to your chart.
Hover over the indicator name in the top-left corner and click the Settings (Gear Icon).
Scroll to the "Symbols" section.
Click inside the text box for the symbol you want to change.
2. Common Symbol Formats If the default symbols show "N/A" or "Error," try these alternatives based on your data feed:
TICK (NYSE Tick)
Default: USI:TICK (Requires specific data)
Alternative: TVC:TICK (General TradingView feed)
Alternative: TICK (Generic)
TRIN (Arms Index)
Default: USI:TRIN
Alternative: TVC:TRIN
Alternative: TRIN
Breadth (ADD/ADV/DECL)
ADD (Advance-Decline Line): Try USI:ADD, TVC:ADD, or ADD
ADV (Advancing Volume): Try USI:ADV, TVC:ADV, or UVOL (Up Volume)
DECL (Declining Volume): Try USI:DECL, TVC:DECL, or DVOL (Down Volume)
VIX
Standard: CBOE:VIX or TVC:VIX
3. Setting Up the Ticker Watchlist (Ticker 1, 2, 3) The script defaults to "Continuous Contracts" (indicated by the 1!), which automatically rolls to the front month.
Nasdaq: CME_MINI:NQ1!
S&P 500: CME_MINI:ES1!
Russell 2000: CME_MINI:RTY1!
Dow Jones: CBOT_MINI:YM1!
Note: If you want to watch a specific contract month (e.g., December 2025), enter the specific code like NQZ2025.
4. Troubleshooting "N/A" Data If a cell in the table is empty or says "N/A":
Verify you are not viewing the chart on a timeframe that excludes the data (though dynamic_requests=true usually handles this).
Ensure you have the correct data permission for that specific symbol.
Market Closed: Some internal data points only populate during the active NYSE session (09:30 - 16:00 ET).
Disclaimer: This tool is for informational purposes only and does not constitute financial advice. Past probabilities do not guarantee future results.

3 EMA with Alerts 2025This indicator plots three key EMAs (20, 50, and 200) directly on the chart, making it easy to track short-, medium-, and long-term trends. A color-coded table is displayed in the top-right corner for quick reference.
The script also includes smart alerts that trigger only when the state changes:
• 🔵 EMA 20 crossing above EMA 50 & EMA 200 → Bullish signal
• 🔴 EMA 20 crossing below EMA 50 & EMA 200 → Bearish signal
This tool is designed for traders who want clean visuals, reliable alerts, and simplified trend recognition in 2025 markets.

Index & Stock Options Reference Tool-(ISORT) [Arjo]The Index & Stock Options Reference Tool-(ISORT) is an indicator that helps users observe price trend direction together with commonly used option strike levels for selected indices and stocks in Indian market .
The indicator integrates a smoothed trend framework with structured option-related data to help users observe how price direction aligns with commonly referenced option strike levels .
It does not generate trading signals, does not provide buy or sell recommendations, and does not evaluate profitability .
Key Features
1. Trend Context Engine
Uses a Super-Smoother filter combined with EMA smoothing
Highlights directional context through color-based trend states
Designed to reduce short-term noise
2. Dynamic ATM & Strike Reference
Automatically computes ATM strike and offset strike levels to select OTM strike
Strike intervals adapt to the selected index or stock
Supports both NSE and BSE instruments, including SENSEX
3. Expiry Awareness
User-selectable expiry date inputs
Displays a visual warning if the selected expiry has already passed
Helps avoid referencing outdated option contracts
4. Option Price Reference Panel
Displays last observed CALL and PUT prices (when available)
Allows optional manual entry values for analytical comparison
All price values are shown strictly as references
5. Informational Table Overlay
Customizable on-chart table layout
Displays strike, timestamp, price reference, and arithmetic P&L values
Table values are informational only, not predictive or advisory
How to Use
1. Select the Underlying Instrument
Choose whether to reference the current chart symbol or a custom index/stock from the input settings
Supported instruments include major NSE indices, selected stocks, and SENSEX
2. Configure Expiry Parameters
Enter the option expiry date using the Day, Month, and Year inputs
If an expired date is selected, the indicator will display a visual warning
This helps ensure option references remain time-relevant
3. Observe Trend Context
The smoothed trend line provides directional context only
Color changes reflect shifts in price structure, not trade instructions
This trend is intended for contextual analysis, not timing entries
4. Review Strike References
The indicator automatically calculates ATM and offset strike levels
Strike spacing adjusts based on the selected index or stock
These values serve as reference levels commonly observed in options markets
5. Interpret the Information Table
The on-chart table displays:
Strike level
Timestamp of the most recent context change
Last observed option price (when available)
Arithmetic price difference values
All values are informational references only and do not represent performance or outcomes
6. Optional Manual Inputs
Manual price fields can be used to compare external reference values
These inputs do not trigger signals or automated calculations
Important Notes
This indicator is not a trading system
It does not generate buy or sell signals
It does not provide financial or trading advice
It is intended for learning, observation, and market study
Disclaimer
This script is provided for educational and analytical purposes only. It does not constitute investment advice, trading advice. The author assumes no responsibility for decisions made using this indicator.
Happy Trading (Arjo)

Kairos QX Indicator [v1.7]What’s New in v1.7?
Streak Analytics (Dashboard Expansion):
The dashboard now tracks Winning and Losing Streaks.
Max Consec. (TP / SL): Displays the highest number of wins and losses that occurred in a row (e.g., 5 / 3).
Avg Consec. (TP / SL): Calculates the average length of your winning and losing streaks (e.g., 2.4 / 1.8).
Updated Default "settings" for MNQ 5 MIN Candles
Full Script Description
This script is a professional-grade Mean Reversion & Trend Following Engine designed for automated execution. It acts as a bridge between discretionary chart analysis and algorithmic trading, allowing you to backtest complex ideas visually and then automate them via alerts without writing code.
1. Core Logic: The "Flip Switch" Strategy
Standard Mode (Mean Reversion):
The script identifies "exhaustion" points where price pierces the Bollinger Bands.
It bets on a reversal (e.g., Price > Upper Band = Short).
Inverse Mode (Trend Following - Default):
With the "Inverse Trades" box checked, the logic flips.
It identifies "breakout" points where price pierces the bands.
It bets on continuation (e.g., Price > Upper Band = Long).
2. Advanced Automation & Safety Features
This system is built to drive trading bots (like TradersPost or 3Commas) safely:
State-Aware Execution: It tracks its own trades (in_trade state). It will never fire a duplicate "Open" signal if a trade is already active, preventing accidental pyramiding.
No Trade Zone (Force Close): You can define a specific time window (default 15:10–17:00). If a trade is open when this time hits, the script immediately triggers a Close Alert, preventing overnight holds.
Signal Cooldown: Configurable "Signals to Skip" allows you to force a cooldown period after a trade closes to avoid over-trading in choppy conditions.
3. Real-Time Analytics Dashboard
The on-chart table provides a transparent, real-time backtest of your settings:
Equity Calculator: You can set a dollar value per point (e.g., $2 for MNQ). The dashboard calculates your estimated Net Profit/Loss based on the total points gained.
Streak Analysis: Shows both the Maximum and Average number of consecutive wins and losses, helping you understand the psychological difficulty of trading the strategy.
Data Integrity: It automatically detects "N/A" trades (candles that hit both SL and TP) and excludes them from the Win Rate calculation to ensure realistic statistics.
4. Modular "Recipe" Building
The strategy is highly customizable via the settings menu (no coding required). You can filter the Bollinger Band trigger with 10 different indicators:
Supported Filters: RSI, Stochastic, CCI, Williams %R, MFI, CMO, Fisher Transform, Ultimate Oscillator, and ROC.
Logic: All selected filters must agree with the main trigger for a trade to fire.
5. Visual Projection Engine
Glowing Outcomes: The script draws exact TP (Green) and SL (Red) boxes for past trades. These boxes glow to indicate the result, allowing for rapid visual verification of the strategy's performance.
Force Close Markers: Special gray markers appear on the chart where a trade was forced to close due to the "No Trade Zone" time limit.

FlexMAShadeThis provides a flexible moving average that can be changes with shading to indicate the direction of the general trend
