Close v Open Moving Averages Strategy (Variable) [divonn1994]This is a simple moving average based strategy that works well with a few different coin pairings. It takes the moving average 'opening' price and plots it, then takes the moving average 'closing' price and plots it, and then decides to enter a 'long' position or exit it based on whether the two lines have crossed each other. The reasoning is that it 'enters' a position when the average closing price is increasing. This could indicate upwards momentum in prices in the future. It then exits the position when the average closing price is decreasing. This could indicate downwards momentum in prices in the future. This is only speculative, though, but sometimes it can be a very good indicator/strategy to predict future action.
What I've found is that there are a lot of coins that respond very well when the appropriate combination of: 1) type of moving average is chosen (EMA, SMA, RMA, WMA or VWMA) & 2) number of previous bars averaged (typically 10 - 250 bars) are chosen.
Depending on the coin.. each combination of MA and Number of Bars averaged can have completely different levels of success.
Example of Usage:
An example would be that the VWMA works well for BTCUSD (BitStamp), but it has different successfulness based on the time frame. For the 12 hour bar timeframe, with the 66 bar average with the VWMA I found the most success. The next best successful combo I've found is for the 1 Day bar timeframe with the 35 bar average with the VWMA.. They both have a moving average that records about a month, but each have a different successfulness. Below are a few pair combos I think are noticeable because of the net profit, but there are also have a lot of potential coins with different combos:
It's interesting to see the strategy tester change as you change the settings. The below pairs are just some of the most interesting examples I've found, but there might be other combos I haven't even tried on different coin pairs..
Some strategy settings:
BTCUSD (BitStamp) 12 Hr Timeframe : 66 bars, VWMA=> 10,387x net profit
BTCUSD (BitStamp) 1 Day Timeframe : 35 bars, VWMA=> 7,805x net profit
BNBUSD (Binance) 12 Hr Timeframe : 27 bars, VWMA => 15,484x net profit
ETHUSD (BitStamp) 16 Hr Timeframe : 60 bars, SMA => 5,498x net profit
XRPUSD (BitStamp) 16 Hr Timeframe : 33 bars, SMA => 10,178x net profit
I only chose these coin/combos because of their insane net profit factors. There are far more coins with lower net profits but more reliable trade histories.
Also, usually when I want to see which of these strategies might work for a coin pairing I will check between the different Moving Average types, for example the EMA or the SMA, then I also check between the moving average lengths (the number of bars calculated) to see which is most profitable over time.
Features:
-You can choose your preferred moving average: SMA, EMA, WMA, RMA & VWMA.
-You can also adjust the previous number of calculated bars for each moving average.
-I made the background color Green when you're currently in a long position and Red when not. I made it so you can see when you'd be actively in a trade or not. The Red and Green background colors can be toggled on/off in order to see other indicators more clearly overlayed in the chart, or if you prefer a cleaner look on your charts.
-I also have a plot of the Open moving average and Close moving average together. The Opening moving average is Purple, the Closing moving average is White. White on top is a sign of a potential upswing and purple on top is a sign of a potential downswing. I've made this also able to be toggled on/off.
Please, comment interesting pairs below that you've found for everyone :) thank you!
I will post more pairs with my favorite settings as well. I'll also be considering the quality of the trades.. for example: net profit, total trades, percent profitable, profit factor, trade window and max drawdown.
*if anyone can figure out how to change the date range, I woul really appreciate the help. It confuses me -_- *
Médias Móveis

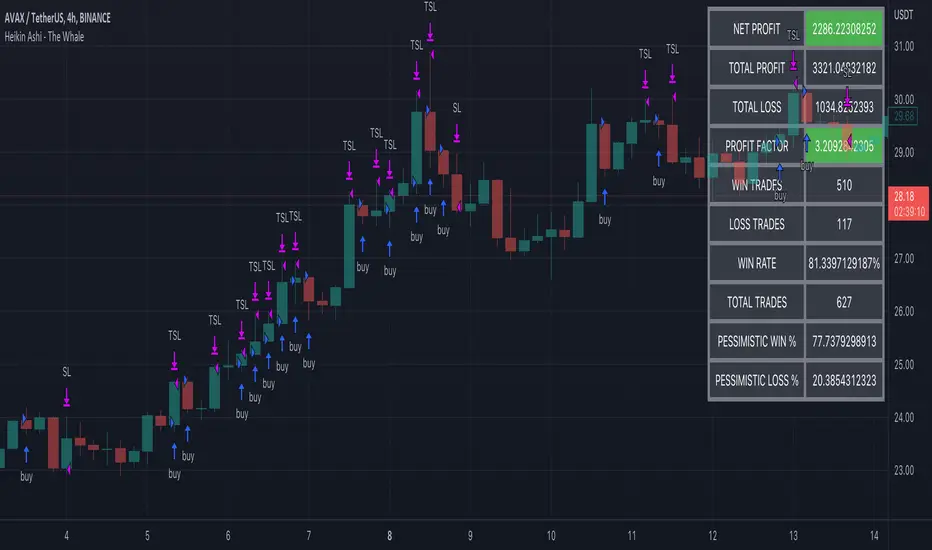
Heikin Ashi - The WhaleThe strategy is based on Heikin Ashi calculation, you do not need to switch the candle to HA.
The HA is used as a base entry, if a candle or two candles are bullish, then is valid to open a position, you can select the validation, one or two candles.
Also, the strategy mainly uses volume indicators as a confluence, you can select VWAP , VWMA , and Volume Oscillator, in addition to ADX which has two ways to validate the entry.
Base entry: One or two bullish HA candles (candles without a lower wick)
Confluence Indicators:
ADX: Will give a positive signal only if ADX is above the threshold, or if +DI is above -DI, or both.
VWAP: will give a positive signal if HA close is above VWAP.
VWMA: composite of 3 MA (20, 25, 50). There are multiple options to set it as confluence, the first option is to check if the short is bigger than the long and long is bigger than the base. The other options are to check the close status, which is bigger than which MA. You can find the description of each option in the strategy box
The sell is based on trailing stop loss (TSL), while the stop loss is based lowest X candle, the strategy will look back to the lowest number of the HA candles and set it as stop loss.
Stochastic Rsi+Ema - Auto Buy Scalper Scirpt v.0.3Simple concept for a scalping script, written for 5 minute candles, optimized for BTC.
1st script I've created from scratch, somewhat from scratch. Also part of the goal of this one is to hold coin as often as possible, whenever it's sideways or not dropping significantly.
Designed to buy on the stochastic bottoms (K>D and rising, and <17)
Then and sell after 1 of 3 conditions;
a. After the price goes back up at least 1 % and then 1-2 period ema reversal
b. After the rsi reversal (is dropping) and K

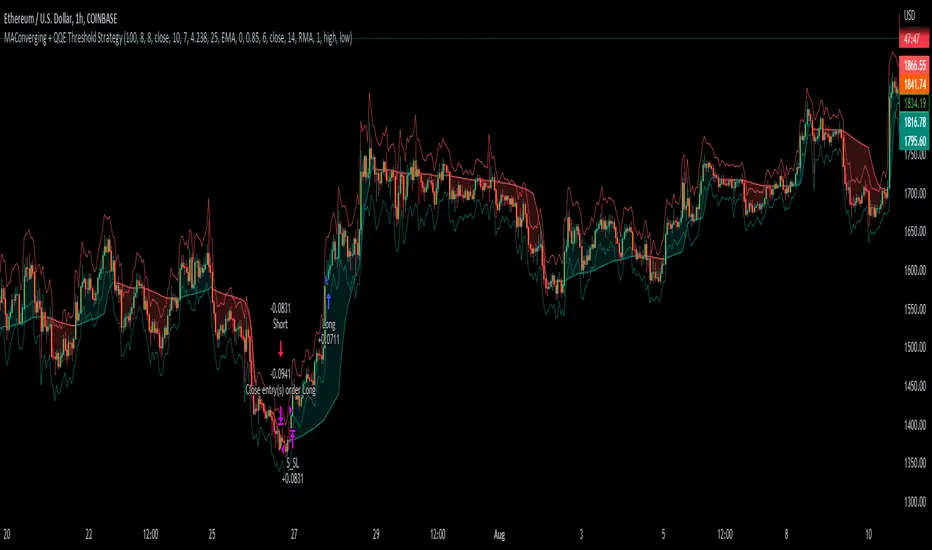
MAConverging + QQE Threshold This trading script is a trading strategy that is made up of 2 public indicators so credit goes to LuxAlgo and Jose5770. I have the 2 indicators listed below.
1) Moving Average Converging (LuxAlgo)
2) QQE Threshold (Jose5770)
This trading strategy is buying when the two indicators align, and then the take profit is the first red bar on the QQE Threshold histogram. It is not a set risk reward but instead a variable take profit strategy. I have the rules of the strategy listed below in order of how it works.
Long Position :
1. Wait for Moving Average Converging to be green
2. Candlestick is green from the QQE Threshold indicator
3. QQE Threshold histogram is green as well, then it enters the trade once we have these criteria met.
Take profit is the first red bar on the QQE Threshold histogram that appears and the trade will close.
Short Position :
1. Wait for Moving Average Converging to be red
2. Candlestick is red from the QQE Threshold indicator
3. QQE Threshold histogram is red as well, then it enters the trade once we have these criteria met.
Take profit is the first green bar on the QQE Threshold histogram that appears and the trade will close.
I hope everyone enjoys!
Mean Reverse Grid Algorithm - The Quant ScienceMean Reverse Grid Algorithm - The Quant Science™ is a dynamic grid algorithm that follows the trend and run a mean reverting strategy on average percentage yield variation.
DESCRIPTION
Trades on different price levels of the grid, following the trend. The grid consists of 10 levels, 5 higher and 5 lower. The grids together create a channel, this channel represents the total percentage change where the algorithm works. The channel also represents the average change yields of the asset, identified during analysis with the "Yield Trend Indicator".
The algorithm can be set long or short.
1. Long algorithm: opens long positions with 20% of the capital every time the price crossunder a lower grid, for a maximum total of 5 simultaneous trades. Trades are closed each time the price crossover a higher grid.
2. Short algorithm: opens short positions with 20% of the capital every time the price crossover a higher grid, for a maximum total of 5 simultaneous trades. Trades are closed each time the price crossunder a lower grid.
USER INTERFACE SETTING
The user configures the percentage value of each grid from the user interface.
AUTO TRADING COMPLIANT
With the user interface, the trader can easily set up this algorithm for automatic trading. Automating it is very simple, activate the alert functions and enter the links generated by your broker.
BACKTESTING INCLUDED
With the user interface, the trader can adjust the backtesting period of the strategy before putting it live. You can analyze large periods such as years or months or focus on short-term periods.
NO LIMIT TIMEFRAME
This algorithm can be used on all timeframes and is ideal for lower timeframes.
GENERAL FEATURES
Multi-strategy: the algorithm can apply either the long strategy or the short strategy.
Built-in alerts: the algorithm contains alerts that can be customized from the user interface.
Integrated grid: the grid indicator is included.
Backtesting included: automatic backtesting of the strategy is generated based on the values set.
Auto-trading compliant: functions for auto trading are included.
ABOUT BACKTESTING
Backtesting refers to the period 1 August 2022 - today, ticker: ETH/USDT, timeframe 1H.
Initial capital: $1000.00
Commission per trade: 0.03%

DCA Average Arbitrage - The Quant ScienceDCA Average Arbitrage - The Quant Science™ is a quantitative algorithm based on a DCA model that uses averaging to create a statistical arbitrage system.
DESCRIPTION
The algorithm can be set long or short.
1. Long algorithm: opens long positions with 100% of the capital every time the price deviates negatively for a certain percentage distance from the average.
2. Short algorithm: opens short positions with 100% of capital every time the price deviates positively for a certain percentage distance from the average.
The closing of positions depends on the parameters activated by the user. The user can set the closing on the reverse condition and/or add functions such as stop loss, take profit and closing after a certain bar period.
USER INTERFACE SETTING
The user chooses the long or short direction and sets the parameters for average as length, source and percent distance.
AUTO TRADING COMPLIANT
With the user interface, the trader can easily set up this algorithm for automatic trading. Automating it is very simple, activate the alert functions and enter the links generated by your broker.
BACKTESTING INCLUDED
With the user interface, the trader can adjust the backtesting period of the strategy before putting it live. You can analyze large periods such as years or months or focus on short-term periods.
NO LIMIT TIMEFRAME
This algorithm can be used on all timeframes and is ideal for lower timeframes.
GENERAL FEATURES
Multi-strategy: the algorithm can apply either the long strategy or the short strategy.
Built-in alerts: the algorithm contains alerts that can be customized from the user interface.
Integrated indicator: the quantity indicator is included.
Backtesting included: automatic backtesting of the strategy is generated based on the values set.
Auto-trading compliant: functions for auto trading are included.
ABOUT THE BACKTEST
Backtesting refers to the period 1 January 2022 - today, ticker: ICP/USDT, timeframe 5 minutes.
Initial capital: $1000.00
Commission per trade: 0.03%

The Impeccable by zyberalThis strategy works differently than others, it uses the IchimokuTenkan, Kijun, and Senkou periods to compute a general sense of market trend. Then I used the MACD fast, slow, and smooth with custom inputs to compute a optimum cross for finding macro bottoms and tops for any asset. This strategy doesn't trade on weekends and does not have a set TP (take profit) for each long or short.

Swing Trend StrategyThis script is a trend following system which uses a long term Moving Average to spot the trend in combination with the Average True Range to filter out Fakeouts, limiting the overall drawdown.
Default Settings and Calculation:
- The trend is detected using the Exponential Moving Average on 200 periods.
- The Average True Range is calculated on 10 periods.
- The Market is considered in an Uptrend when the price closes above the EMA + ATR.
- The Market is considered in a Downtrend when the price closes below the EMA - ATR.
- The strategy will open a LONG position when the market is in an Uptrend.
- The strategy will close its LONG positions when the price closes below the EMA.
- The strategy will open a SHORT position when the market is in a Downtrend.
- The strategy will close its SHORT positions when the price closes above the EMA.
This script is best suited for the 4h timeframe, and shows good results on BTC and ETH especially.
The options allow to modify the type of moving average to use, the period of the moving average, the ATR multiplier to add as well as the possibility to open short trades or not.

Gators Oscillator - Bitcoin Scalp Trader(T&M/e V3!!)Gator's Oscillator:
**For reference, all numbers, and settings displayed on the input screen are only what I HAVE FOUND to be profitable for my own strategy, Yours will differ. This is not financial advice and I am not a financial advisor. Please do your due diligence and own research before considering taking entries based on this strategy and indicator. I am not advertising investing, trading, or skills untaught, this is simply to help incorporate into your own strategy and improve your trading journey!**
INPUTS:
EV: This is an integer value set to default at 55. This value is equated to the lead value, volatility measurement, and standard deviation between averages
EV 2: This integer is used as the base value and is meant to always be GREATER THEN EV, the default is set at 163. There should be at least a 90+ integer difference between EVs for data accuracy.
EV TYPE & EV TYPE 2: This option only affects the output for the moving average histograms. (and data inserted for strategy)
Volatility Smoothing: This is the smoothness of the custom-made volatility oscillator. I have this default at 1 to show time-worthy-term (3.9%+) moves or significant trends to correspond with the standard deviation declination between EVMA and EVMA2.
Directional Length: This is the amount of data observed per candle in the bull versus bear indicator.
Take Profit: Pre-set takes profit level that is set to 4 but can be adjusted for user experience.
Style:
Base Length: Columns equated using a custom-made statistical equation derived from EV TYPE 2+EV2 to determine a range of differential in historic averages to a micro-scale.
Lead Length: Columns equated using a custom-made statistical equation derived from EV TYPE+EV to determine a range of differential in historic averages to a micro-scale.
Weighted EMA Differential: Equation expressing the differences between exponential and simple averages derived from EV+EV Type 2. Default is displaying none, but optional for use if found helpful.
Volatility: Represents volatility from multiple data sets spanning from Bollinger bands to HPV and translated through smoothing.
Bull Strength: The strength of Bulls in the current trend is derived from a DMI+RSI+MACD equation to represent where the trend lies.
Bear Strength: The strength of Bears in the current trend is derived from a DMI+RSI+MACD equation to represent where the trend lies.
(NEW) Standard Deviation between Moving Averages: Use this logarithmic indicator depicted as circles to help determine whether a move is a fake out or not. Compare the circles with the volatility line, if you see them deviating away, it is either a bull/bear trap or trend continuation is imminent until they correlate back together.
CHEAT CODE'S NOTES:
Do not use this indicator on high leverage. I have personally used this indicator for a week and faced a max of 8% drawdown, albeit painful I was on low leverage and still closed on my take profit level.
85% is not 100% do not overtrade using this indicator's entry conditions if you have made 4 consecutive profitable trades.
Mess around with the input values and let me know if you find an even BETTER hit rate, 30+ entries, and a good drawdown!!
V2 UPGRADES:
*Increased Opacity on Bull Bear Columns
*Removed the Stop Loss Input option
*Decreased EV2 to a default of 143 for accuracy
*Added additional disclaimers in the description
* Removed Bull/Bear offset values for accuracy
V3 UPGRADES:
*ADDED THE EMA DIFFERENTIAL FROM SMA STANDARD DEVIATION INDICATOR. REPRESENTED BY PURPLE BARS THAT PLOT BRIGHT AT EXTREME LEVELS (Translate this to the EMA's and SMA's are very far apart) This is a fantastic way to resolve volatility and momentum in one indicator!!
*Line Width increased for volatility
*plot's for Oversold Alma reduced to 3, also adjusted the plot shape to arrows corresponding to 'overbought/oversold values. Look for a cross-over from green/red plot to transparent for best signals.
*Histograms for bull/bear strength correspond to an increase or decrease in value
*Input screen converted into groups, with bull/bear color inline
*Converted base/lead length value's into areas with breaks. IF YOU SEE WHITE (Short/Lead Length), IT IS A SHORT TERM MOVE AND SCALPING OPPORTUNITY. IF YOU SEE BLUE(Long/Base Length) IT MEANS IT IS A MACRO MOVE, WHICH MAY LAST LONGER
-Cheat Code
BINANCE:BTCUSDT BYBIT:BTCUSDT COINBASE:BTCUSD

Bitcoin Scalping Strategy (Sampled with: PMARP+MADRID MA RIBBON)
DISCLAIMER:
THE CONTENT WITHIN THIS STRATEGY IS CREATED FROM TWO INDICATORS CREATED BY TWO PINESCRIPTER'S. THE STRATEGY WAS EXECUTED BY MYSELF AND REVERSE-ENGINEERED TO MEET THE CONDITIONS OF THE INTENDED STRATEGY REQUESTOR. I DO NOT TAKE CREDIT FOR THE CONTENT WITHIN THE ESTABLISHED LINES MADE CLEAR BY MYSELF.
The Sampled Scripts and creators:
PMAR/PMARP by @The_Caretaker Link to original script:
Madrid MA RIBBON BAR by @Madrid Link to original script:
Cheat Code's strategy notes:
This sampled strategy (Requested by @elemy_eth) is one combining previously created studies. I reverse-engineered the local scope for the Madrid moving average color plots and set entry and exit conditions for certain criteria met. This strategy is meant to deliver an extremely high hit rate on a daily time frame. This is made possible because of the very low take profit percentage, during the context of a macro downtrend it is made easier to hit 1-3% scalps which is made visible with the strategy using sampled scripts I created here.
How it works:
Entry Conditions:
-Enter Long's if the lime color conditions are met true using the script detailed by Marid's MA
- No re-entry into positions needs to be met true (this prevents pyramiding of orders due to conditions being met true) applicable to both long and short side entries.
- To increase hit rate and prevent traps both the parameters of rsi being sub 80 and no previously engulfing candles need to be met true to enter a long position.
- Enter Short's if the red color conditions of Madrid's moving average are met true.
- Closing Long positions are typically not met within this indicator, however, it still sometimes triggers if necessary. This consists of a pmarp sub 99 and a position size greater than 0.0
- Closing Short positions are typically not met within this indicator, however, it still sometimes triggers if necessary. This consists of a pmarp over 01 and a position size less than 0.0
- Stop Loss: 27.75% Take Profit: 1% (Which does not trigger on ticks over 1% so you will see average trade profits greater than 1%)
BYBIT:BTCUSDT BINANCE:BTCUSDT COINBASE:BTCUSD
Best Of Luck :)
-CheatCode1

RSI Mean Reversion StrategyThis is a scalping strategy designed to be used for crypto trading. It uses an Exponential Moving Average with a default length of 100 in order to identify the trend of the market. If the price is trading above 100, it will only take long trades, and vice versa for shorts. It places long orders when the RSI value closes below 40, and the price is also above the 100 EMA. It places short orders when the RSI value is above 60, and the price is below the 100 EMA.
*Note: for custom alert messages to be read, "{{strategy.order.alert_message}}" must be placed into the alert dialogue box when the alert is set.

VIDYA Trend StrategyOne of the most common messages I get is people reaching out asking for quantitative strategies that trade cryptocurrency. This has compelled me to write this script and article, to help provide a quantitative/technical perspective on why I believe most strategies people write for crypto fail catastrophically, and how one might build measures within their strategies that help reduce the risk of that happening. For those that don't trade crypto, know that these approaches are applicable to any market.
I will start off by qualifying up that I mainly trade stocks and ETFs, and I believe that if you trade crypto, you should only be playing with money you are okay with losing. Most published crypto strategies I have seen "work" when the market is going up, and fail catastrophically when it is not. There are far more people trying to sell you a strategy than there are people providing 5-10+ year backtest results on their strategies, with slippage and commissions included, showing how they generated alpha and beat buy/hold. I understand that this community has some really talented people that can create some really awesome things, but I am saying that the vast majority of what you find on the internet will not be strategies that create alpha over the long term.
So, why do so many of these strategies fail?
There is an assumption many people make that cryptocurrency will act just like stocks and ETFs, and it does not. ETF returns have more of a Gaussian probability distribution. Because of this, ETFs have a short term mean reverting behavior that can be capitalized on consistently. Many technical indicators are built to take advantage of this on the equities market. Many people apply them to crypto. Many of those people are drawn down 60-70% right now while there are mean reversion strategies up YTD on equities, even though the equities market is down. Crypto has many more "tail events" that occur 3-4+ standard deviations from the mean.
There is a correlation in many equities and ETF markets for how long an asset continues to do well when it is currently doing well. This is known as momentum, and that correlation and time-horizon is different for different assets. Many technical indicators are built based on this behavior, and then people apply them to cryptocurrency with little risk management assuming they behave the same and and on the same time horizon, without pulling in the statistics to verify if that is actually the case. They do not.
People do not take into account the brokerage commissions and slippage. Brokerage commissions are particularly high with cryptocurrency. The irony here isn't lost to me. When you factor in trading costs, it blows up most short-term trading strategies that might otherwise look profitable.
There is an assumption that it will "always come back" and that you "HODL" through the crash and "buy more." This is why Three Arrows Capital, a $10 billion dollar crypto hedge fund is now in bankruptcy, and no one can find the owners. This is also why many that trade crypto are drawn down 60-70% right now. There are bad risk practices in place, like thinking the martingale gambling strategy is the same as dollar cost averaging while also using those terms interchangeably. They are not the same. The 1st will blow up your trade account, and the 2nd will reduce timing risk. Many people are systematically blowing up their trade accounts/strategies by using martingale and calling it dollar cost averaging. The more risk you are exposing yourself too, the more important your risk management strategy is.
There is an odd assumption some have that you can buy anything and win with technical/quantitative analysis. Technical analysis does not tell you what you should buy, it just tells you when. If you are running a strategy that is going long on an asset that lost 80% of its value in the last year, then your strategy is probably down. That same strategy might be up on a different asset. One might consider a different methodology on choosing assets to trade.
Lastly, most strategies are over-fit, or curve-fit. The more complicated and more parameters/settings you have in your model, the more likely it is just fit to historical data and will not perform similar in live trading. This is one of the reasons why I like simple models with few parameters. They are less likely to be over-fit to historical data. If the strategy only works with 1 set of parameters, and there isn't a range of parameters around it that create alpha, then your strategy is over-fit and is probably not suitable for live trading.
So, what can I do about all of this!?
I created the VIDYA Trend Strategy to provide an example of how one might create a basic model with a basic risk management strategy that might generate long term alpha on a volatile asset, like cryptocurrency. This is one (of many) risk management strategies that can reduce the volatility of your returns when trading any asset. I chose the Variable Index Dynamic Average (VIDYA) for this example because it's calculation filters out some market noise by taking into account the volatility of the underlying asset. I chose a trend following strategy because regressions are capturing behaviors that are not just specific to the equities market.
The more volatile an asset, the more you have to back-off the short term price movement to effectively trend-follow it. Otherwise, you are constantly buying into short term trends that don't represent the trend of the asset, then they reverse and loose money. This is why I am applying a trend following strategy to a 4 hour chart and not a 4 minute chart. It is also important to note that following these long term trends on a volatile asset exposes you to additional risk. So, how might one mitigate some of that risk?
One of the ways of reducing timing risk is scaling into a trade. This is different from "doubling down" or "trippling down." It is really a basic application of dollar cost averaging to reduce timing risk, although DCA would typically happen over a longer time period. If it is really a trend you are following, it will probably still be a trend tomorrow. Trend following strategies have lower win rates because the beginning of a trend often reverses. The more volatile the asset, the more likely that is to happen. However, we can reduce risk of buying into a reversal by slowly scaling into the trend with a small % of equity per trade.
Our example "VIDYA Trend Strategy" executes this by looking at a medium-term, volatility adjusted trend on a 4 hour chart. The script scales into it with 4% of the account equity every 4-hours that the trend is still up. This means you become fully invested after 25 trades/bars. It also means that early in the trade, when you might be more likely to experience a reversal, most of your account equity is not invested and those losses are much smaller. The script sells 100% of the position when it detects a trend reversal. The slower you scale into a trade, the less volatile your equity curve will be. This model also includes slippage and commissions that you can adjust under the "settings" menu.
This fundamental concept of reducing timing risk by scaling into a trade can be applied to any market.
Disclaimer: This is not financial advice. Open-source scripts I publish in the community are largely meant to spark ideas that can be used as building blocks for part of a more robust trade management strategy. If you would like to implement a version of any script, I would recommend making significant additions/modifications to the strategy & risk management functions. If you don’t know how to program in Pine, then hire a Pine-coder. We can help!

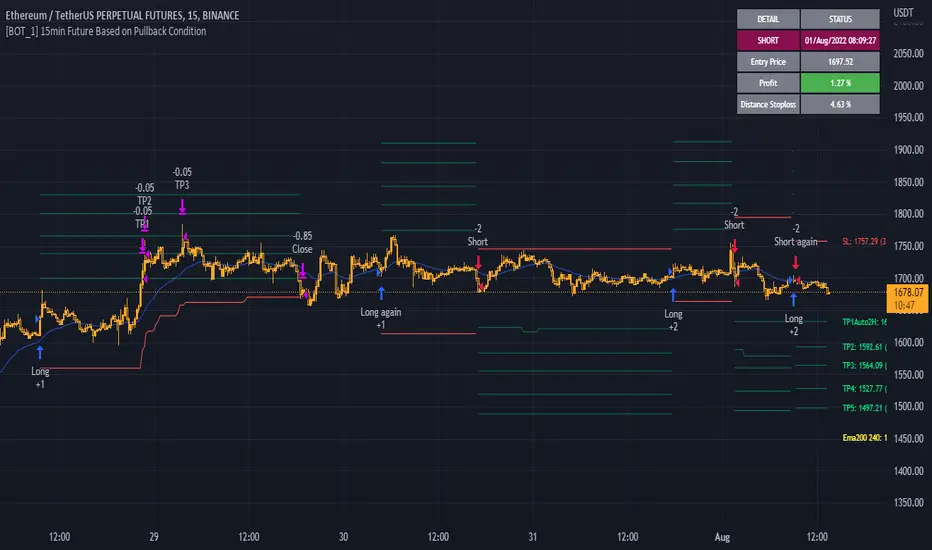
[B_1] 15min Future Based on Pullback Condition
GENERAL INTRODUCTION:
This scripts is a trend catcher strategy, looking for entry points based on pullback condition.
HOW IT WORKS:
Entry Long: when price close above 15m Supertrend and an EMA line trend, MACD (12,26,9) below MACD signal (12,26,9), RSI(14) >50 & <80 and SAR is positive.
Exit Long: when price hit TPs or touch Stoploss.
Entry Short: when price close below 15m Supertrend and an EMA line trend, MACD (12,26,9) above MACD signal (12,26,9), RSI(14) <50 & >25 and SAR is negative.
Exit Short: when price hit TPs or touch Stoploss.
HOW TO USE IT:
1. Setup comment Long/Short: this setting used for auto trading. You can fill text to alert then in alert box of Tradingview, using {{strategy.order.comment}}.
2. Setup Entry
+ EMA Length: the EMA period to filter the trend (default is 30).
+ Buy/Sell ETH follow BTC: open long/short ETHUSDTPERP when BTCUSDT touch and reject SuperTrend 1H/2H/4H.
+ Long/Short again: Allow re-entry when price hit all TP or SL.
3. Setup Exit
+ Multi profit: Take profit levels are set according to the fibonacci levels.
+ Auto find TP: If having resistants in higher timeframe near TP1, TP1 will auto set at that resistant.
+ Stoploss: you have two options: Stoploss based on percentage or ATR.
+ When price hit TP1, you have two options: only move Stoploss to entry or active trailing.
4. Custom tools
+ SuperTrend MTF: they used for take multiprofit (you can show or hide them).
+ Table result.
BACKTEST:
Currently, the strategy is optimized for: BINANCE:ETHUSDTPERP . However it can also run on some other coins like: BINANCE:RUNEUSDTPERP , BINANCE:FILUSDTPERP , ...
Parameters for BINANCE:ETHUSDTPERP:
+ 01/01/2022 to present.
+ Order size starting: 01 contract.
+ commission fee: 0.02%
+ No leverage.
=> 475 trades, ratio profit: loss is 5800: 400.
If you want access to this scripts, please inbox to me, you are always welcome.
Strategy Myth-Busting #1 - UT Bot+STC+Hull [MYN]This is part of a new series we are calling "Strategy Myth-Busting" where we take open public manual trading strategies and automate them. The goal is to not only validate the authenticity of the claims but to provide an automated version for traders who wish to trade autonomously.
Our first one is an automated version of the " The ULTIMATE Scalping Trading Strategy for 2022 " strategy from " My Trading Journey " who claims to have achieved not only profits but a 98.3% win rate. As you can see from the backtest results below, I was unable to substantiate anything close to that that claim on the same symbol (NVDA), timeframe (5m) with identical instrument settings that " My Trading Journey " was demonstrating with. Strategy Busted.
If you know of or have a strategy you want to see myth-busted or just have an idea for one, please feel free to message me.
This strategy uses a combination of 3 open-source public indicators:
UT Bot Alerts by QuantNomad
STC Indicator - A Better MACD By shayankm
Basic Hull Ma Pack tinkered by InSilico
Trading Rules:
5 min candles
Long
New Buy Signal from UT Bot Alerts Strategy
STC is green and below 25 and rising
Hull Suite is green
Short
New Sell Signal from UT Bot Alerts Strategy
STC is red and above 75 and falling
Hull Suite is red

issam miftah strategymon script est différent de ceux qui sont publiés avec la précision du tp et SL meme si un RR est bas mais le taux de réussite est bien trop élevé de 70% je conseille de l'utiliser sur le timeframe M15. et ca repaint pas les signaux vous pouvez l'utiliser en automatique. Courage les traders :)
Issam Miftah

T&M/E Wave V2Trend and Momentum With Exception Wave Indicator and Strategy:
This strategy is hand made and I have spent days and many hours making it. The strategy is meant to determine the power between buyers and sellers, match the current power with a historic trend (through a moving average statistical equation), and finally volatility (measured with a mix between standard deviation from Bollinger Bands and HPV). Below will be a list of how to determine the inputs for the indicator
**For reference, all numbers, and settings displayed on the input screen are only what I HAVE FOUND to be profitable for my own strategy, Yours will differ. This is not financial advice and I am not a financial advisor. Please do your due diligence and own research before considering taking entries based on this strategy and indicator. I am not advertising investing, trading, or skills untaught, this is simply to help incorporate into your own strategy and improve your trading journey!**
INPUTS:
EV: This is an integer value set to default at 55. This value is equated to the lead value, volatility measurement, and standard deviation between averages
EV 2: This integer is used as the base value and is meant to always be GREATER THEN EV, the default is set at 163. There should be at least a 90+ integer difference between EVs for data accuracy.
EV TYPE & EV TYPE 2: This option only affects the output for the moving average histograms. (and data inserted for strategy)
Volatility Smoothing: This is the smoothness of the custom-made volatility oscillator. I have this default at 1 to show time-worthy-term (3.9%+) moves or significant trends to correspond with the standard deviation declination between EVMA and EVMA2.
Directional Length: This is the amount of data observed per candle in the bull versus bear indicator.
Take Profit: Pre-set takes profit level that is set to 4 but can be adjusted for user experience.
Style:
Base Length: Columns equated using a custom-made statistical equation derived from EV TYPE 2+EV2 to determine a range of differential in historic averages to a micro-scale.
Lead Length: Columns equated using a custom-made statistical equation derived from EV TYPE+EV to determine a range of differential in historic averages to a micro-scale.
Weighted EMA Differential: Equation expressing the differences between exponential and simple averages derived from EV+EV Type 2. Default is displaying none, but optional for use if found helpful.
Volatility: Represents volatility from multiple data sets spanning from Bollinger bands to HPV and translated through smoothing.
Bull Strength: The strength of Bulls in the current trend is derived from a DMI+RSI+MACD equation to represent where the trend lies.
Bear Strength: The strength of Bears in the current trend is derived from a DMI+RSI+MACD equation to represent where the trend lies.
CHEAT CODE'S NOTES:
Do not use this indicator on high leverage. I have personally used this indicator for a week and faced a max of 8% drawdown, albeit painful I was on low leverage and still closed on my take profit level.
85% is not 100% do not overtrade using this indicator's entry conditions if you have made 4 consecutive profitable trades.
Mess around with the input values and let me know if you find an even BETTER hit rate, 30+ entries and a good drawdown!!
V2 UPGRADES:
*Increased Opacity on Bull Bear Columns
*Removed the Stop Loss Input option
*Decreased EV2 to a default of 143 for accuracy
*Added additional disclaimers in the description
* Removed Bull/Bear offset values for accuracy
-Cheat Code
BYBIT:BTCUSDT

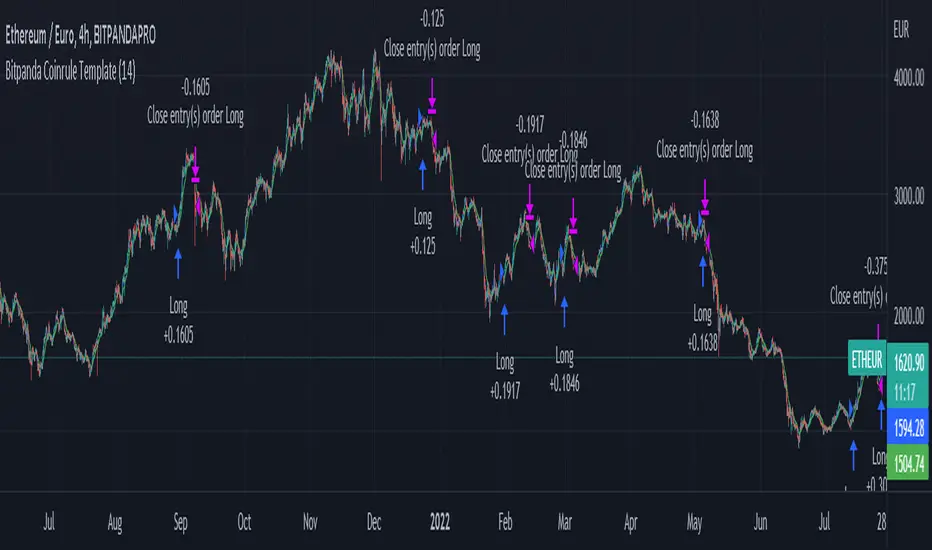
Bitpanda Coinrule TemplateThis strategy for Bitpanda on the Coinrule platform utilises 3 different conditions that have to be met to buy and 1 condition to sell. This strategy works best on the ETH/EUR pair on the 4 hour timescale.
In order for the strategy to enter the trade it must meet all of the conditions listed below.
ENTRY
RSI increases by 5
RSI is lower than 70
MA9 crosses above MA50
EXIT
MA50 crosses above MA9
This strategy works well on LINK/EUR on the 1 day timeframe, MIOTA/EUR on the 2 hour timeframe, BTC/EUR on the 4 hour timeframe and BEST/EUR on the 1 day timeframe (and 4h).
Back tested from 1 January 2020.
The strategy assumes each order is using 30% of the available coins to make the results more realistic and to simulate you only ran this strategy on 30% of your holdings. A trading fee of 0.1% is also taken into account and is aligned to the base fee applied on Binance.
Buy/Sell Signal Template/Boilerplate Strategy [MyTradingCoder]This script allows the user to connect an external indicator output/plot value to allow for a no-code solution to setup a simple buy/sell signal strategy. For those of you who do not know how to program, do not be intimidated as this is a very easy setup process.
Maybe you want to buy when the 'RSI' value drops below '30' and then sell when the 'RSI' value climbs above '70', but you don't want to code it. You can do that with this indicator along with thousands of others found on the free TradingView indicator library.
Step #1:
Put the strategy on the chart.
Step #2:
Apply a secondary indicator onto the chart, such as an RSI .
Step #3:
Open the strategy settings and change the source to the RSI
Step #4:
Change the 'Signal Settings' to match when you want a buy, or a sell. For example, if you want to get a buy signal when the RSI crosses above 50, and get a sell when it crosses below 50, set the 'buy value' to 50, and the 'buy type' to greater than, then set the 'sell value' to 50 and the 'sell type' to less than. BOOM! It works :)

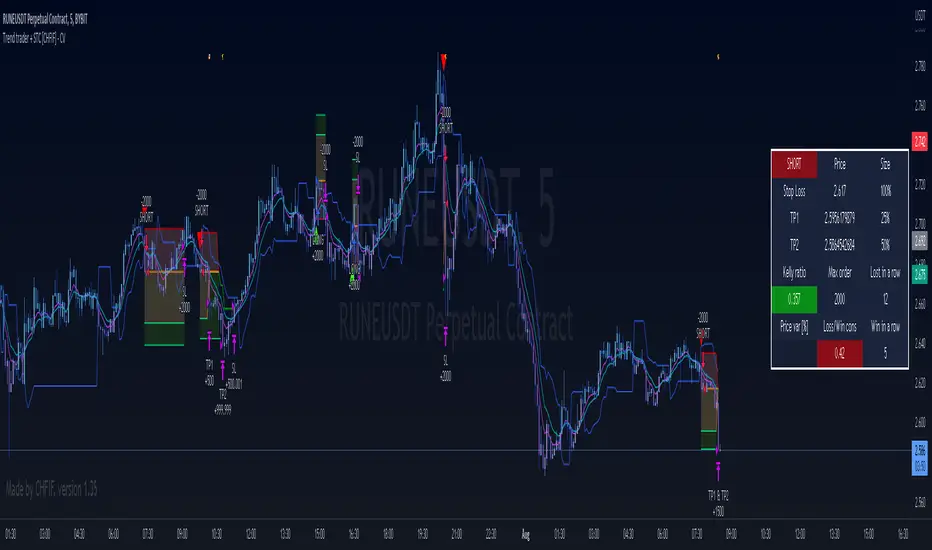
Trend trader + STC [CHFIF] - CV This script is my first strategy script coupling the Trend trader (indicator developed by Andrew Abraham in the Trading the Trend article of TASC September 1998.) and Schaff Trend Cycle . The STC indicator is widely used to identify trends and their directions. It is sometimes used by traders to predict trend reversals as well. Based on the movement of the Schaff Trend Cycle , buy or sell signals are generated, which are then used by traders to initiate either long or short positions.
Around I built a user interface to help you in creating a customized strategy to your need.
My idea behind doing this was to make customizable parameters and back testing easier than manually with a lot of flexibility and options. More possibility we have, more solutions we find right? So I started this script few weeks ago to be my first script (second in reality, but first to be published.)
Strategy it self is made out of 2 simple step:
1→ STC gives a Buy/Sell signal.
2→Price is closing above the TT (Buy) or below (Sell) and the signal is the same as given by the STC .
To complete your strategy in order to reach the best result, I added few options:
→ Money management: Define the type of risk you want to take (entry risk will always risk the same percentage of your portfolio disregarding the size of the SL, Fix amount of money, fix amount of the capital (portfolio). NOTE: Margin is not coded yet, target is to show liquidation price. Please keep an eye on the releases to know when it is released.
→ Stop loss and Take profit management: Define the type of target you want to use (ATR, fixed percentage, pivots points) and even customise different take profit level or activate the trailing. Each type of target is customizable via the menu
→ Moving average: You can also complete the strategy using different moving average. To draw it tick the box on the left, to use it in the calculation of the result, tick the box "Price>MA" in front of the needed EMA . You can select different type of MA ( SMA , EMA , DEMA , TEMA , RMA, HMA , WMA , VWAP , VWMA , etc...)
→ RSI: 4 possible approach to use the RSI to complement the strategy:
• OB/OS => short position will be taken only if RSI goes under the lower limit. Long if the RSI goes above the limit. Ticking confirmation will wait to cross back the limit to validate the condition
• Rev OB/OS => Short will be taken if RSI is below lower limit and stays below. Long will be taken if RSI is above upper limit and stays above.
• MA dominance => RSI has to be above MA for long, below for short. Confirmation box ticked requires 2 bars with the RSI on a side to validate signal.
• MA Dominance + limit => It is a combination of the requirement of the provious option and also Rev. OB/OS
→ Volume confirmation => This will consider the volume MA for entry confirmation. The volume will have to be above the MA define by the value entered in the field.
→ Waddah Attar explosion indicator can also be used as a filter for entries in this way:
• Explosion line > dead zone to validate entries
• Trend > dead zone to validate entry
• Both > dead zone is a compound of both rules above to get entry confirmation
→ ADX can also be used as a filter. I added 2 Threshold in order to have a minimum level of acceptance for valid entry but also a maximum level.
When your strategy is setup, you can setup alerts and I would recommend to setup the date range before doing the alerts. Why? Simply because the script do not cover pyramiding and will give a signal only if a trade is not ongoing.
In setting up the sessions at which you would want to trade, no signal within those range can be missed. You can setup 2 sessions, the days and also the global range of backtesting.
STD-Filterd, R-squared Adaptive T3 w/ Dynamic Zones BT [Loxx]STD-Filterd, R-squared Adaptive T3 w/ Dynamic Zones BT is the backtest strategy for "STD-Filterd, R-squared Adaptive T3 w/ Dynamic Zones " seen below:
Included:
This backtest uses a special implementation of ATR and ATR smoothing called "True Range Double" which is a range calculation that accounts for volatility skew.
You can set the backtest to 1-2 take profits with stop-loss
Signals can't exit on the same candle as the entry, this is coded in a way for 1-candle delay post entry
This should be coupled with the INDICATOR version linked above for the alerts and signals. Strategies won't paint the signal "L" or "S" until the entry actually happens, but indicators allow this, which is repainting on current candle, but this is an FYI if you want to get serious with Pinescript algorithmic botting
You can restrict the backtest by dates
It is advised that you understand what Heikin-Ashi candles do to strategies, the default settings for this backtest is NON Heikin-Ashi candles but you have the ability to change that in the source selection
This is a mathematically heavy, heavy-lifting strategy with multi-layered adaptivity. Make sure you do your own research so you understand what is happening here. This can be used as its own trading system without any other oscillators, moving average baselines, or volatility/momentum confirmation indicators.
What is the T3 moving average?
Better Moving Averages Tim Tillson
November 1, 1998
Tim Tillson is a software project manager at Hewlett-Packard, with degrees in Mathematics and Computer Science. He has privately traded options and equities for 15 years.
Introduction
"Digital filtering includes the process of smoothing, predicting, differentiating, integrating, separation of signals, and removal of noise from a signal. Thus many people who do such things are actually using digital filters without realizing that they are; being unacquainted with the theory, they neither understand what they have done nor the possibilities of what they might have done."
This quote from R. W. Hamming applies to the vast majority of indicators in technical analysis . Moving averages, be they simple, weighted, or exponential, are lowpass filters; low frequency components in the signal pass through with little attenuation, while high frequencies are severely reduced.
"Oscillator" type indicators (such as MACD , Momentum, Relative Strength Index ) are another type of digital filter called a differentiator.
Tushar Chande has observed that many popular oscillators are highly correlated, which is sensible because they are trying to measure the rate of change of the underlying time series, i.e., are trying to be the first and second derivatives we all learned about in Calculus.
We use moving averages (lowpass filters) in technical analysis to remove the random noise from a time series, to discern the underlying trend or to determine prices at which we will take action. A perfect moving average would have two attributes:
It would be smooth, not sensitive to random noise in the underlying time series. Another way of saying this is that its derivative would not spuriously alternate between positive and negative values.
It would not lag behind the time series it is computed from. Lag, of course, produces late buy or sell signals that kill profits.
The only way one can compute a perfect moving average is to have knowledge of the future, and if we had that, we would buy one lottery ticket a week rather than trade!
Having said this, we can still improve on the conventional simple, weighted, or exponential moving averages. Here's how:
Two Interesting Moving Averages
We will examine two benchmark moving averages based on Linear Regression analysis.
In both cases, a Linear Regression line of length n is fitted to price data.
I call the first moving average ILRS, which stands for Integral of Linear Regression Slope. One simply integrates the slope of a linear regression line as it is successively fitted in a moving window of length n across the data, with the constant of integration being a simple moving average of the first n points. Put another way, the derivative of ILRS is the linear regression slope. Note that ILRS is not the same as a SMA ( simple moving average ) of length n, which is actually the midpoint of the linear regression line as it moves across the data.
We can measure the lag of moving averages with respect to a linear trend by computing how they behave when the input is a line with unit slope. Both SMA (n) and ILRS(n) have lag of n/2, but ILRS is much smoother than SMA .
Our second benchmark moving average is well known, called EPMA or End Point Moving Average. It is the endpoint of the linear regression line of length n as it is fitted across the data. EPMA hugs the data more closely than a simple or exponential moving average of the same length. The price we pay for this is that it is much noisier (less smooth) than ILRS, and it also has the annoying property that it overshoots the data when linear trends are present.
However, EPMA has a lag of 0 with respect to linear input! This makes sense because a linear regression line will fit linear input perfectly, and the endpoint of the LR line will be on the input line.
These two moving averages frame the tradeoffs that we are facing. On one extreme we have ILRS, which is very smooth and has considerable phase lag. EPMA has 0 phase lag, but is too noisy and overshoots. We would like to construct a better moving average which is as smooth as ILRS, but runs closer to where EPMA lies, without the overshoot.
A easy way to attempt this is to split the difference, i.e. use (ILRS(n)+EPMA(n))/2. This will give us a moving average (call it IE /2) which runs in between the two, has phase lag of n/4 but still inherits considerable noise from EPMA. IE /2 is inspirational, however. Can we build something that is comparable, but smoother? Figure 1 shows ILRS, EPMA, and IE /2.
Filter Techniques
Any thoughtful student of filter theory (or resolute experimenter) will have noticed that you can improve the smoothness of a filter by running it through itself multiple times, at the cost of increasing phase lag.
There is a complementary technique (called twicing by J.W. Tukey) which can be used to improve phase lag. If L stands for the operation of running data through a low pass filter, then twicing can be described by:
L' = L(time series) + L(time series - L(time series))
That is, we add a moving average of the difference between the input and the moving average to the moving average. This is algebraically equivalent to:
2L-L(L)
This is the Double Exponential Moving Average or DEMA , popularized by Patrick Mulloy in TASAC (January/February 1994).
In our taxonomy, DEMA has some phase lag (although it exponentially approaches 0) and is somewhat noisy, comparable to IE /2 indicator.
We will use these two techniques to construct our better moving average, after we explore the first one a little more closely.
Fixing Overshoot
An n-day EMA has smoothing constant alpha=2/(n+1) and a lag of (n-1)/2.
Thus EMA (3) has lag 1, and EMA (11) has lag 5. Figure 2 shows that, if I am willing to incur 5 days of lag, I get a smoother moving average if I run EMA (3) through itself 5 times than if I just take EMA (11) once.
This suggests that if EPMA and DEMA have 0 or low lag, why not run fast versions (eg DEMA (3)) through themselves many times to achieve a smooth result? The problem is that multiple runs though these filters increase their tendency to overshoot the data, giving an unusable result. This is because the amplitude response of DEMA and EPMA is greater than 1 at certain frequencies, giving a gain of much greater than 1 at these frequencies when run though themselves multiple times. Figure 3 shows DEMA (7) and EPMA(7) run through themselves 3 times. DEMA^3 has serious overshoot, and EPMA^3 is terrible.
The solution to the overshoot problem is to recall what we are doing with twicing:
DEMA (n) = EMA (n) + EMA (time series - EMA (n))
The second term is adding, in effect, a smooth version of the derivative to the EMA to achieve DEMA . The derivative term determines how hot the moving average's response to linear trends will be. We need to simply turn down the volume to achieve our basic building block:
EMA (n) + EMA (time series - EMA (n))*.7;
This is algebraically the same as:
EMA (n)*1.7-EMA( EMA (n))*.7;
I have chosen .7 as my volume factor, but the general formula (which I call "Generalized Dema") is:
GD (n,v) = EMA (n)*(1+v)-EMA( EMA (n))*v,
Where v ranges between 0 and 1. When v=0, GD is just an EMA , and when v=1, GD is DEMA . In between, GD is a cooler DEMA . By using a value for v less than 1 (I like .7), we cure the multiple DEMA overshoot problem, at the cost of accepting some additional phase delay. Now we can run GD through itself multiple times to define a new, smoother moving average T3 that does not overshoot the data:
T3(n) = GD ( GD ( GD (n)))
In filter theory parlance, T3 is a six-pole non-linear Kalman filter. Kalman filters are ones which use the error (in this case (time series - EMA (n)) to correct themselves. In Technical Analysis , these are called Adaptive Moving Averages; they track the time series more aggressively when it is making large moves.
What is R-squared Adaptive?
One tool available in forecasting the trendiness of the breakout is the coefficient of determination ( R-squared ), a statistical measurement.
The R-squared indicates linear strength between the security's price (the Y - axis) and time (the X - axis). The R-squared is the percentage of squared error that the linear regression can eliminate if it were used as the predictor instead of the mean value. If the R-squared were 0.99, then the linear regression would eliminate 99% of the error for prediction versus predicting closing prices using a simple moving average .
R-squared is used here to derive a T3 factor used to modify price before passing price through a six-pole non-linear Kalman filter.
What are Dynamic Zones?
As explained in "Stocks & Commodities V15:7 (306-310): Dynamic Zones by Leo Zamansky, Ph .D., and David Stendahl"
Most indicators use a fixed zone for buy and sell signals. Here’ s a concept based on zones that are responsive to past levels of the indicator.
One approach to active investing employs the use of oscillators to exploit tradable market trends. This investing style follows a very simple form of logic: Enter the market only when an oscillator has moved far above or below traditional trading lev- els. However, these oscillator- driven systems lack the ability to evolve with the market because they use fixed buy and sell zones. Traders typically use one set of buy and sell zones for a bull market and substantially different zones for a bear market. And therein lies the problem.
Once traders begin introducing their market opinions into trading equations, by changing the zones, they negate the system’s mechanical nature. The objective is to have a system automatically define its own buy and sell zones and thereby profitably trade in any market — bull or bear. Dynamic zones offer a solution to the problem of fixed buy and sell zones for any oscillator-driven system.
An indicator’s extreme levels can be quantified using statistical methods. These extreme levels are calculated for a certain period and serve as the buy and sell zones for a trading system. The repetition of this statistical process for every value of the indicator creates values that become the dynamic zones. The zones are calculated in such a way that the probability of the indicator value rising above, or falling below, the dynamic zones is equal to a given probability input set by the trader.
To better understand dynamic zones, let's first describe them mathematically and then explain their use. The dynamic zones definition:
Find V such that:
For dynamic zone buy: P{X <= V}=P1
For dynamic zone sell: P{X >= V}=P2
where P1 and P2 are the probabilities set by the trader, X is the value of the indicator for the selected period and V represents the value of the dynamic zone.
The probability input P1 and P2 can be adjusted by the trader to encompass as much or as little data as the trader would like. The smaller the probability, the fewer data values above and below the dynamic zones. This translates into a wider range between the buy and sell zones. If a 10% probability is used for P1 and P2, only those data values that make up the top 10% and bottom 10% for an indicator are used in the construction of the zones. Of the values, 80% will fall between the two extreme levels. Because dynamic zone levels are penetrated so infrequently, when this happens, traders know that the market has truly moved into overbought or oversold territory.
Calculating the Dynamic Zones
The algorithm for the dynamic zones is a series of steps. First, decide the value of the lookback period t. Next, decide the value of the probability Pbuy for buy zone and value of the probability Psell for the sell zone.
For i=1, to the last lookback period, build the distribution f(x) of the price during the lookback period i. Then find the value Vi1 such that the probability of the price less than or equal to Vi1 during the lookback period i is equal to Pbuy. Find the value Vi2 such that the probability of the price greater or equal to Vi2 during the lookback period i is equal to Psell. The sequence of Vi1 for all periods gives the buy zone. The sequence of Vi2 for all periods gives the sell zone.
In the algorithm description, we have: Build the distribution f(x) of the price during the lookback period i. The distribution here is empirical namely, how many times a given value of x appeared during the lookback period. The problem is to find such x that the probability of a price being greater or equal to x will be equal to a probability selected by the user. Probability is the area under the distribution curve. The task is to find such value of x that the area under the distribution curve to the right of x will be equal to the probability selected by the user. That x is the dynamic zone.
Included:
Bar coloring
Signals
Alerts
Loxx's Expanded Source Types

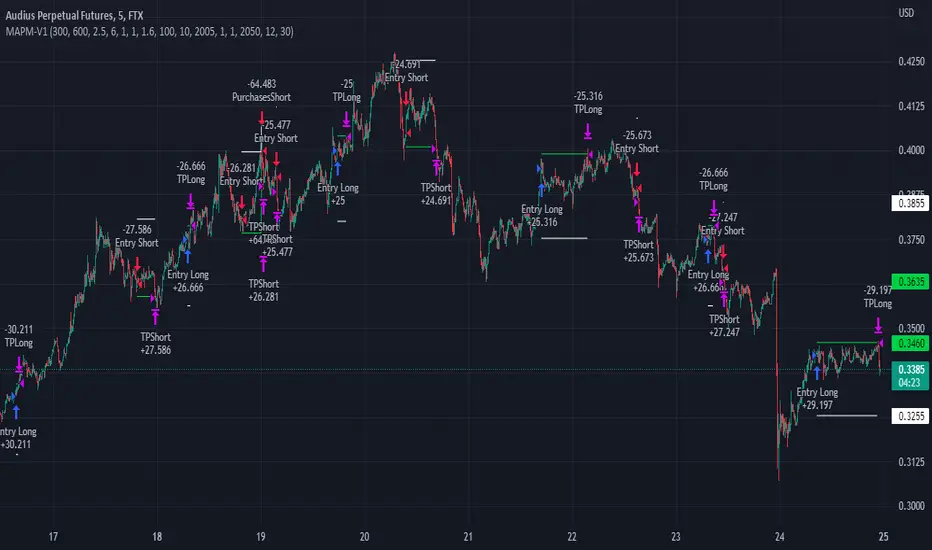
MAPM-V1Greetings dear traders!
I would like to introduce you the script for testing the strategy by crossing two signal EMAs based on the MACD indicator.
In the strategy itself:
The entry is made as a percentage of the deposit by EMA crossings.
There are additional purchases, they are set from the entry price for a given percentage in the opposite direction of the transaction.
The distance in percentage from the entry price, on which the additional purchase is exposed, is set in the StepAddPurchases parameter.
The Martingale parameter increases the initially purchased amount of the base traded cryptocurrency in each additional purchase.
The essence of the strategy is to trade a large number of pairs in order to diversify risks and obtain a stable income.
It is desirable to enter each trading pair with a small percentage of the deposit.
The optimization result shows the trading result for the period of 5000 bars (the platform does not give more history) on 10% of the deposit for the first transaction, the addition will also take place on initially bought amount of base traded cryptocurrency, multiplied by the martingale parameter, raised by the number of addition.
The strategy will still be updated, so see you soon!
3C Crossover with TTP & TSLThis is not a set and forget strategy. It needs constant tweaking to maintain a high winrate. Also what works on one pair can be horrible on another.
This strategy works best on the 1 min or 5 min TF but also works well on the 15 min. Haven't done any testing in higher TF's as im only interested in scalping.
If enabled you can retrive data for the filters on any TF.
The strategy do not repaint.
You do not need a 3c subscription to run this strategy as the bot turns on and off the bot itself.
Instructions for the 3commas connector:
1. First, you need to prepare 3commas Long/Short bots that will only listen to custom TV signals.
2. Inputs for the 3commas bot can be found at the end of the user inputs.
3. Once you have entered the required details into the inputs, turn on 3commas comments. They should appear on the chart (looks messy).
4. Now you can add the alert where you should paste the 3commas Webhook URL: 3commas.io
5. For the alert message text insert the placeholder {{strategy.order.comment}} and delete the rest. 6. Once the alert is saved, you can turn off those 3commas comments to have a clearer chart.
7. With a new alert, the bot and trade should launch.
Long or Short trades are determined with a crossing of the fast MA over the slow MA for Long and the opposite for Short. By checking Close position on MA cross the deal will close on a crossover/under of the 2 MA's
You can select from various different MA's and of course lenghts. You can add both EMA filter on any lenght aswell as ATR to determine to go long or short.
Using the MA gap can help you to not enter trades in a low volatile ranging market.
The RSI filter, sets the maximum RSI threshold for a long position and the minimum for a short. By default and what i recomend is that you enter Longs when RSI is above 50 and shorts when RSI are below 50.
-You can set confirmation of the trade direction with RSI , i.e. for Long the RSI must rise a specified number of bars back, vice versa for Short.
Enabling the pullback filter is great to avoid Longing tops and Shorting bottoms.
Stop loss can be set be either a fixed percentage or by using ATR
Take profit can be set by using percentage, ATR or RiskReward ratio(RR). if you use ATR as a stoploss i recomend using RR as the TP.
Yu can choose to trail the TP with either Percentage or ATR
Whats ahead. I really want to incorporate RSI divergencies, but haven't figured out how yet. Any other ideas would be greatly appreciated.
Have a look at my other strategies. They are similar to this but works abit differently.

3C MACD & RSI Scalper no repaintThis is not a set and forget strategy. It needs constant tweaking to maintain a high winrate. Also what works on one pair can be horrible on another.
This strategy works best on the 1 min or 5 min TF but also works well on the 15 min. Haven't done any testing in higher TF's as im only interested in scalping.
If enabled you can retrive data on the MACD and RSI from any timeframe.
The strategy do not repaint.
You can filter on sessions as well as days. Often trading during say only the EU times and not trading during weekends yields better results. This is because weekeds and eg. the Asia Sessions are alot less volatile.
You do not need a 3c subscription to run this strategy as the bot turns on and off the bot itself.
Instructions for the 3commas connector:
1. First, you need to prepare 3commas Long/Short bots that will only listen to custom TV signals.
2. Inputs for the 3commas bot can be found at the end of the user inputs.
3. Once you have entered the required details into the inputs, turn on 3commas comments. They should appear on the chart (looks messy).
4. Now you can add the alert where you should paste the 3commas Webhook URL: 3commas.io
5. For the alert message text insert the placeholder {{strategy.order.comment}} and delete the rest. 6. Once the alert is saved, you can turn off those 3commas comments to have a clearer chart.
7. With a new alert, the bot and trade should launch.
Long or Short trades are determined with a crossing of the fast MA over the slow MA for Long and the opposite for Short. Trades should only happen close to the crossovers.
You can select from various different MA's and of course lenghts. I often find that using HEMA as the fast MA and DEMA as the slow give more trades while also maintaining a high winrate.
Then for Long we use the MACD indicator where we look for high peaks in negative values for Long and vice versa for Shorts. These should be significantly higher than other peaks (or if you will lower peaks for a Long).
The key is to detect high peaks on the histogram, which we will try to achieve by checking if the last 2 values were higher than X bars back. If you want to make it even more specific, then you can turn on the additional checkbox which compares the current value to the average value of X bars back, and if it is greater than, say, 72% the value of the average then it's ok to enter the trade.
The RSI filter, sets the maximum RSI threshold for a long position and the minimum for a short. By default and what i recomend is that you enter Longs when RSI is above 50 and shorts when RSI are below 50.
-You can set confirmation of the trade direction with RSI, i.e. for Long the RSI must rise a specified number of bars back, vice versa for Short.
Enabling the pullback filter is great to avoid Longing tops and Shorting bottoms.
Whats ahead. I really want to incorporate RSI divergencies, but haven't figured out how yet. Any other ideas would be greatly appreciated.
Have a look at my other strategies. They are similar to this but works abit differently.
The 3 strike line and the engulfing candles are not something that has an impact on the script yet, and might never be. But i do like to turn them on for a visual to see if the trade the strategy opened is a good one.
