Key-Levels - D/W/M High-Low + Fib + MA🧭 Key-Levels – D/W/M High-Low + Fibonacci + Moving Averages
A complete multi-timeframe analysis toolkit that combines Daily, Weekly, and Monthly high/low levels, Fibonacci retracements, and customizable moving averages — all in one clean, efficient display.
Ideal for traders who want to identify key reaction zones, retracement levels, and trend alignment across multiple timeframes.
🔹 Features
1. Prior High/Low Levels
Plots Daily (PDH/PDL), Weekly (PWH/PWL), and Monthly (PMH/PML) key levels
Adjustable colors, styles (Solid / Dashed / Dotted), and line widths
Optional midline display for each timeframe
Displays live labels with price values and % difference from current close
Extend lines rightward to project future price interactions
2. Fibonacci Retracement
Auto-detects swing highs/lows using configurable pivot lengths
Smart pivot logic prioritizes major swings based on % span
Auto-orients retracements depending on trend direction
Customizable visibility and color for each Fibonacci level
Supports 0.236 → 1.618 levels, with optional auto-extension in uptrend scenarios
Displays ratio + price for each level label
3. Pivot Labels
Optionally show pivot high/low labels with customizable text and background colors
Independent control of left/right length and label style
4. Moving Averages
Up to three customizable MAs (default: 8 EMA, 21 EMA, 50 SMA)
Choose between EMA or SMA for each
Toggle individual or all moving averages
Adjustable lengths, colors, and line widths
5. Alerts
Built-in alert condition for price crossing a user-defined level
Clean alert message format with ticker symbol and live price
⚙️ Customization
Flexible style controls for lines, labels, and colors
Adjustable right-extension length for projecting levels
Font size and visibility toggles for all elements
Smart grouping for intuitive settings management
📈 Ideal For
Identifying key reversal or breakout zones
Spotting Fibonacci confluence between retracements and prior highs/lows
Tracking trend structure via multi-timeframe MAs
Swing traders, intraday traders, and technical analysts
💡 Summary
Key-Levels – D/W/M High-Low + Fib + MA is a professional-grade indicator designed to simplify complex multi-timeframe analysis.
It helps you see the bigger picture, find actionable zones, and trade with confidence.
🧩 Compatible with any market and timeframe.
Médias Móveis

Differenza Close - SMA200 con MM9 dinamicaDifferenza Close - SMA200 con MM9 dinamica
distanza tra i prezzi e la sua media di lungo periodo.

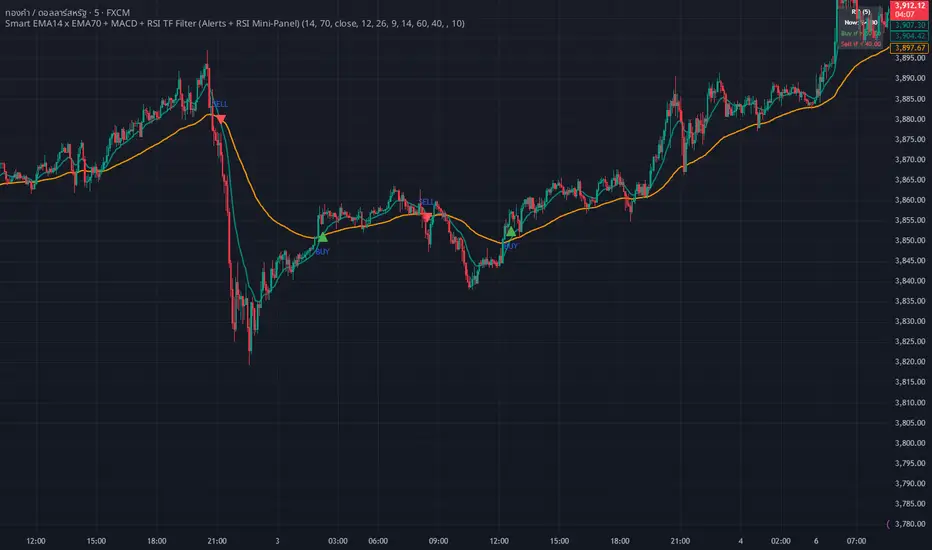
WHANG EMA-MACD🔥 Smart EMA14 x EMA70 + MACD Trend Alert System
Description:
Tired of chasing false signals?
This simple but powerful indicator helps you catch real trend moves — not the noise.
When EMA14 crosses EMA70 with MACD confirmation, and both EMAs point the same way, you’ll get a clean Buy or Sell alert right on your chart.
No messy settings, no guessing — just clear signals in strong trends.
✨ Features:
🔔 Real-time alerts via “Any alert() function call”
🟢 Buy when EMA14 crosses above EMA70 + MACD > 0
🔴 Sell when EMA14 crosses below EMA70 + MACD < 0
📈 Trades only when both EMAs slope in the same direction
⚙️ Customizable inputs for any market or timeframe
How to use:
Add the indicator to your chart
Create an alert → choose Any alert() function call
Relax and wait for your signals — no need to watch every candle!
Perfect for traders who want to follow the trend, avoid sideways traps, and get early alerts when momentum kicks in 🚀
Elipli5648This indicator displays two moving averages on the same chart — the 9-period and 200-period simple moving averages (SMA).
Both lines are customizable in color and line width directly from the settings menu.
Useful for identifying short-term vs long-term trend direction.
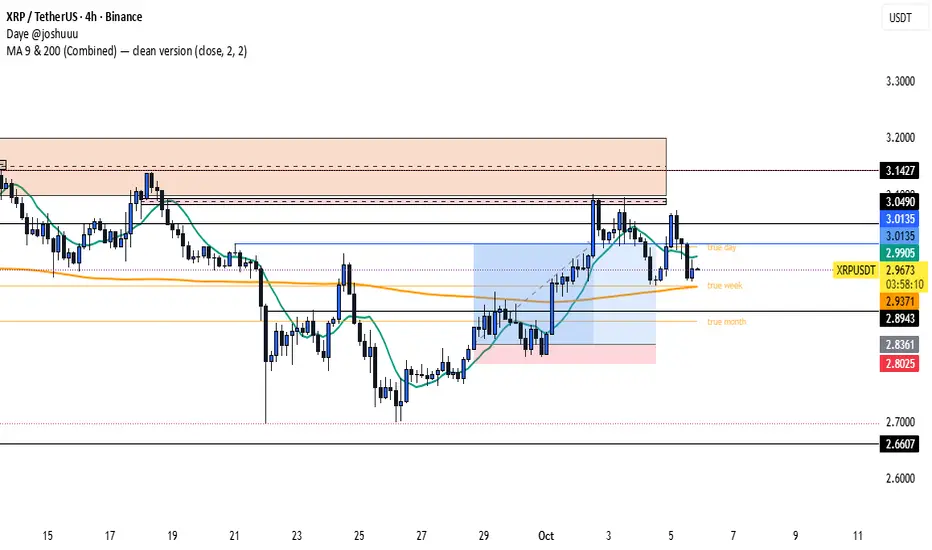
elipli5648 , MA 9 & 200 (Combined) — clean versionThis indicator displays two moving averages on the same chart — the 9-period and 200-period simple moving averages (SMA).
Both lines are customizable in color and line width directly from the settings menu.
Useful for identifying short-term vs long-term trend direction.
10/21 EMA + 50/200 Daily SMAAll four relevant moving averages in one script to allow you to add move indicators.

Volume-Confirmed Reversal Engine [AlgoPoint]Volume-Confirmed Reversal Engine v2.0
Overview
A price pattern alone is not enough to signal a high-probability reversal. True market turning points—moments of capitulation or euphoria—are almost always confirmed by a significant spike in volume.
The Volume-Confirmed Reversal Engine is designed to identify these exact moments. It filters out low-conviction price movements and focuses only on reversal patterns that are backed by meaningful volume activity.
How It Works
The indicator's logic is based on a sequential confirmation process:
- High-Volume Anchor Candle: The engine first scans for an "Anchor Candle"—a candle that makes a new high or low over a user-defined look_back period. Critically, this candle's volume must also be significantly higher than the recent average. Low-volume breakouts are ignored.
- Setup Activation & Visualization: When a valid Anchor Candle is detected, the indicator enters a "setup" phase. It visually marks this on your chart by drawing a Setup Box around the high and low of the Anchor Candle, extending it forward for the duration of the confirm_in window.
- Confirmation & Signal: A final signal is only triggered if the price breaks out of the opposite side of the Setup Box within the confirmation window. This action, combined with the initial volume spike, confirms the reversal.
- Setup Box Visualization: See exactly which candle the indicator is watching and the key price levels (the box boundaries) that need to be broken for a signal.
Signal Strength Score (1-4): Every signal now comes with a score, providing insight into its quality based on four factors:
- The base price pattern is met.
- The initial Anchor Candle had high volume.
- The final Confirmation Candle also had high volume.
- The signal is aligned with the long-term macro trend (e.g., a BUY signal above the 200 EMA).
Status Dashboard: A simple panel on your chart tells you what the indicator is doing in real-time ("Scanning for Setups," "Watching Bullish Setup," etc.) and displays a countdown for how many bars are left for a confirmation.
How to Interpret & Use
- The Box: When a colored box appears, it's an early warning that a reversal setup is active. Watch the boundaries of the box for a potential breakout.
- The Score: Use the score to gauge the quality of a signal. A 3/4 or 4/4 score represents a very high-conviction setup where multiple technical factors are aligned.
- The Dashboard: Use the panel to understand the indicator's current state and the time-sensitivity of an active setup.
- The BUY/SELL Labels: These are the final, actionable triggers, appearing only after the full price and volume confirmation process is complete.

RED RICHI EMA 34&55This indicator displays two exponential moving averages (EMA 34 & EMA 55) to identify mid-term trend direction.
It also marks crossover points with green and red circles for bullish and bearish trend shifts.

TGFA Flexible Alerts Multi-MA CrossoversTGFA Flexible Alerts, Multi-MA Crossovers
Description
Flexible MA crossovers with BUY/SELL alerts, customizable candle colors, and an info box for ATR/volatility insights. Supports EMA/SMA/HMA/VWAP on any chart.
Overview
TGFA Flexible Alerts is a versatile Pine Script indicator for traders seeking customizable moving average (MA) crossovers, visual signals, and quick-reference metrics. It overlays crossover lines (e.g., fast EMA over slow SMA), generates BUY/SELL labels and alerts, colors candles based on themes, and includes an optional info box with ATR bands, support/resistance, and trend projections. Built for any symbol and timeframe (optimized for 1H intraday), it auto-detects Heikin Ashi charts and handles mixed MA types like responsive HMA with lagging EMAs. All logic uses built-in TA functions for reliability—no repainting on confirmed bars.
Key Features
MA Crossover Engine: Configurable lines (EMA, SMA, HMA, VWAP) with dynamic colors (HMA tints green/red based on slope). Enable/disable via inputs.
Invert Signals Toggle: Flips BUY/SELL logic for mixed MA setups (e.g., HMA as fast line over EMA).
Reasoning: Traditional crossovers assume a fast line (low lag) crossing above a slow line (high lag) for buys. HMA's hull design makes it ultra-responsive, so it may "lead" too aggressively—causing premature signals. Inverting aligns it with user intuition (e.g., HMA dipping below then recovering signals strength), reducing false positives in trending markets. Test on your pairs!
Visual Alerts: BUY/SELL labels at crossover price (with optional price display and offset adjustment).
Single MA Overlays: Independent plots for EMA/SMA/HMA/VWAP (length 0 to hide).
Info Box: Real-time table with current price, ±1/2 ATR bands, median price (over lookback), trend (SMA50 slope), volatility % (ATR normalized), support/resistance (recent highs/lows), and reversal projections (tied to SMA50 pivot for up/down bias).
Candle Coloring: 20+ themes (dark/light canvases) for bull/bear/reversal/low-volume bars—e.g., Emerald Blaze greens uptrends, dims on low vol. Toggle off for no changes.
Chart Source Flexibility: Auto-switches to Heikin Ashi if detected; manual override for Regular/HA.
Alerts fire on crossovers/crossunders (custom messages with ticker/interval). Open-source for forking.
How to Use
Add to Chart: Search in TradingView's public library, apply to any symbol (e.g., stocks, forex). Best on 1H for intraday, but works on daily/weekly too.
Setup Crossovers: Choose Line 1/2 types/lengths (e.g., HMA 9 over SMA 20). Enable "Invert Signals" if using HMA—prevents lag mismatches in volatile assets.
Alerts & Labels: Toggle labels for visuals; set TradingView alerts on "Buy"/"Sell" conditions. Use offset for crowded charts.
Info Box Insights: Enable for quick scans—e.g., enter long near support if trend is bullish and price > median. Adjust ATR length (default 14) for sensitivity.
Candle Themes: Pick a scheme (e.g., Neon Pulse for dark mode); it overrides bar colors without altering data.
Customization Tip: For HMA-heavy setups, invert + short lengths (5-9) catch turns early; pair with volume filter in alerts.
Limitations & Disclaimers - Designed for overlay on price charts; may overlap in tight ranges—adjust transparency via styles.
HMA can repaint intra-bar; signals confirm on close. Not back tested for all assets—validate with strategy tester.
Info box projections use SMA(50) as a trend pivot (same for up/down as reference); customize via code for advanced calcs. Candle colors are cosmetic only.
This is an analysis tool, not advice. Trading involves risk; combine with fundamentals/news. Past performance isn't indicative of future results. No liability for losses.
I'm still a newbie, so feedback encouraged!
Thank you!!
ThisGirl

ATR Horizontal Lines from EMA and SMA with TableHow it works:
The script calculates ATR levels (of your choosing)
Instead of plotting curves, it creates horizontal lines
The lines are deleted and recreated on each bar to show current levels
Lines extend to the right or can be limited to a certain width
Customization options:
Line width (1-10 pixels)
Individual colors for each of the 4 lines
All the original parameters (EMA/SMA lengths, ATR length, multipliers)
The horizontal lines will now show the current ATR-based support/resistance levels and move dynamically as the EMAs, SMA, and ATR values change with new price data.

Multiple EMA/SMA v6This indicator plots up to eight Exponential Moving Averages (EMAs) and six Simple Moving Averages (SMAs) on the same chart.
Each moving average can be individually customized or disabled by setting its length to 0.
It’s designed for traders who want to visually compare multiple EMAs and SMAs with consistent styling and color-coding.
Key features:
Displays up to 14 customizable EMAs/SMAs.
Adjustable line width and source (e.g., close, open, hlc3).
Simple and performance-optimized structure.
Clean color scheme for quick trend identification.
Usage:
Set any moving average length to 0 to hide it, or adjust lengths and colors to match your strategy.
Ideal for identifying short-, mid-, and long-term trend alignments.

Smooth Cloud + ZigZag VPOC CORE v6📌 Description
The Smooth Cloud + ZigZag VPOC indicator is designed to help traders visualize market structure and potential confluence zones.
Smooth Cloud: Built from smoothed moving averages (EMA, RMA, or HMA), this cloud highlights the underlying short-term trend by shading bullish and bearish phases.
Pivots (ZigZag style): Marks confirmed swing highs and lows, helping to identify support/resistance and breakout areas without repainting.
VPOC (Volume Point of Control): Plots the price level with the highest traded volume, either from a rolling lookback or anchored to a custom date. This often acts as a magnet or reaction level.
ATR Bands: Optional dynamic bands based on volatility to frame potential extension zones.
Signals & Alerts: Generates long/short labels when price breaks pivot levels in line with trend filters, with optional confluence from HTF trend, VPOC, and ATR.
This tool combines trend context, structure, and volume confluence in a single view to support decision-making.
✅ Notes
This script is intended for technical analysis and educational use only.
It does not provide financial advice or guaranteed outcomes.
Signals are purely analytical and should be combined with independent risk management.

BanditExperimental %R and Moving Average Bands. This is just for fun :)
Comment below if you spot a good pattern to trade.

% Change & Range (With SMA)- Calculates the % range and change for each candle
- uses SMA over "n" bars to show the average % range and the average % change for green days and red days
- optional standard deviation line (k bands)

Tchwella Stocks Custom WatermarkThis Pine Script v5 indicator adds a customizable watermark to TradingView charts, displaying key stock information while allowing for flexible positioning and formatting.
📌 Features & Functionality:
✅ Custom Positioning:
• Fixed to the top-left corner.
• Adjustable spacing ensures the text is properly aligned.
✅ Displayed Information (Configurable):
• Company Name & Market Cap (Optional: Shows dynamically calculated market cap)
• Stock Ticker & Timeframe
• Industry & Sector
✅ Customization Options:
• Font Size: Huge, Large, Normal, Small
• Text Color & Transparency: Adjustable
• Proper Left Alignment for a clean, structured display
• Vertical Offset Tweaks to move text down for better visibility
✅ Optimized Table Layout:
• Uses table.new() for persistent placement.
• Added an empty row to fine-tune positioning, ensuring the watermark doesn’t overlap key chart areas.
🔧 Use Case:
Designed for traders who want a clear, customizable stock watermark to enhance their charting experience without obstructing price action.
Feb 1
Release Notes
Updated version: now you can decide your location for the watermark
Micha Stocks Custom Watermark (MSWM) – TradingView Script
This Pine Script v5 indicator adds a customizable watermark to TradingView charts, displaying key stock information while allowing for flexible positioning and formatting.
📌 Features & Functionality:
✅ Custom Positioning:
• Fixed to the top-left corner.
• Adjustable spacing ensures the text is properly aligned.
✅ Displayed Information (Configurable):
• Company Name & Market Cap (Optional: Shows dynamically calculated market cap)
• Stock Ticker & Timeframe
• Industry & Sector
✅ Customization Options:
• Font Size: Huge, Large, Normal, Small
• Text Color & Transparency: Adjustable
• Proper Left Alignment for a clean, structured display
• Vertical Offset Tweaks to move text down for better visibility
✅ Optimized Table Layout:
• Uses table.new() for persistent placement.
• Added an empty row to fine-tune positioning, ensuring the watermark doesn’t overlap key chart areas.
🔧 Use Case:
Designed for traders who want a clear, customizable stock watermark to enhance their charting experience without obstructing price action.
Feb 7
Release Notes
Micha Stocks Custom Watermark – Updated Version 🚀
This updated Micha Stocks Custom Watermark script enhances your TradingView experience by adding an ATR-based volatility signal alongside the existing customizable stock watermark.
🆕 New Features & Improvements:
✅ ATR (14-Day) with Dynamic Volatility Indicator
• Displays the ATR value and its percentage relative to price.
• Includes a color-coded volatility signal:
• 🔴 High Volatility (Above user-defined Red Threshold)
• 🟡 Moderate Volatility (Between Red & Yellow Thresholds)
• 🟢 Low Volatility (Below user-defined Yellow Threshold)
✅ Fully Customizable ATR Thresholds
• Users can set their own ATR % levels for Red, Yellow, and Green signals.
✅ Improved Watermark Customization
• Users can still adjust the position, size, and color of the watermark.
• Includes Company Name, Ticker, Market Cap, Industry, and Sector.
• ATR can be turned on/off in settings for flexibility.
🔧 How to Use:
1️⃣ Go to Indicator Settings → Enable or Disable ATR Display
2️⃣ Adjust ATR % Thresholds to fit your volatility preference
3️⃣ Customize Text Position, Color, and Size to match your chart setup
This update makes it easier to quickly assess market volatility while keeping a clean and professional chart layout.
💡 Why Use This Indicator?
• Effortlessly track key stock info without cluttering your chart.
• Quickly identify volatile conditions using ATR percentage signals.
• Adjust settings on the fly to match your trading strategy.
📢 Update Now & Enjoy a Smarter Charting Experience!

MACD cu RSI 7 Fibonacci color levelsMACD with RSI info
The RSI is display as value with changing color as Fibonacci levels.
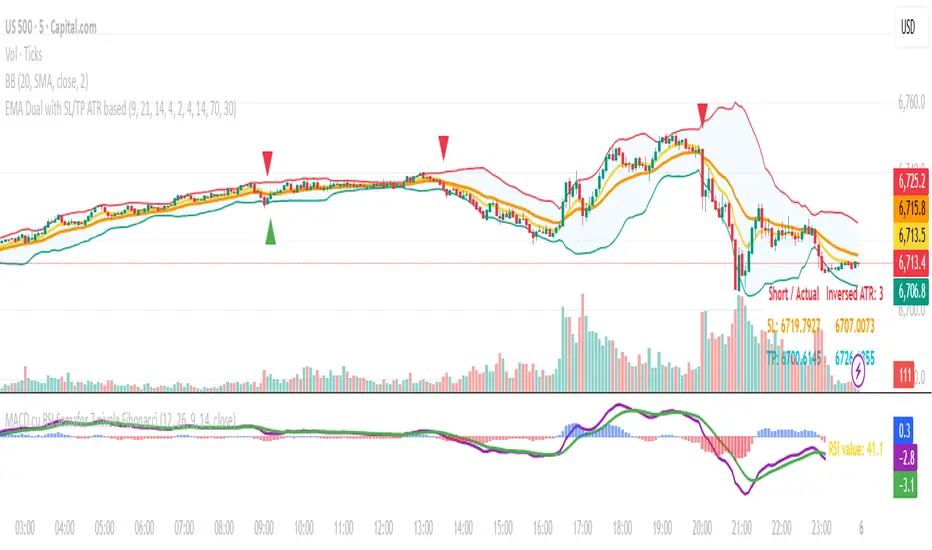
MACD with RSI color 7 Fibonacci levelsMACD that contain RSI info
The color of RSI is change accordingly with Fibonacci levels, from red till green

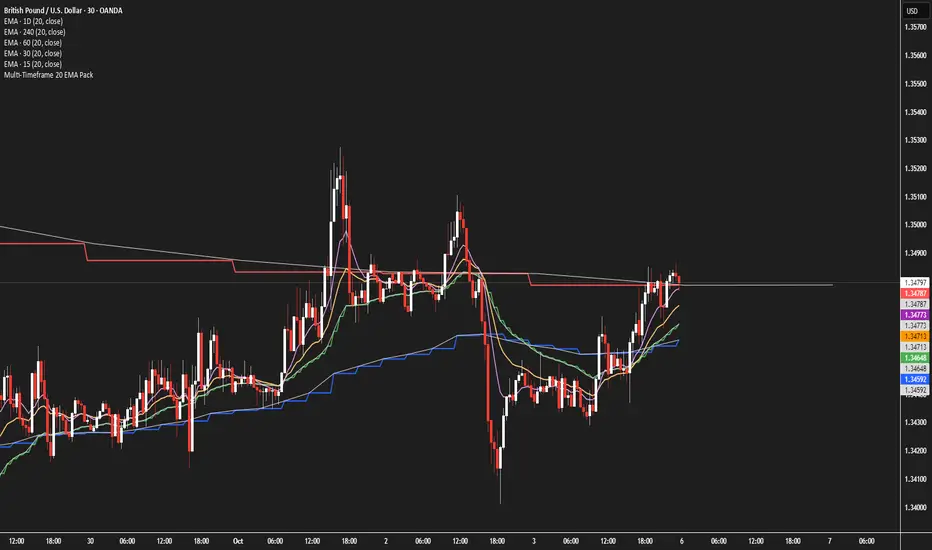
Multi-Timeframe 20 EMA PackMultiple 20 EMA's, each for a different time frame but all on the same chart.
This will help you make sure that the 20EMA has been crossed on all time frames before taking action.
Tunç ŞatıroğluTunç Şatıroğlu's Technical Analysis Suite
Description:
This comprehensive Pine Script indicator, inspired by the technical analysis teachings of Tunç Şatıroğlu, integrates six powerful TradingView indicators into a single, user-friendly suite for robust trend, momentum, and divergence analysis. Each component has been carefully selected and enhanced by beytun to improve functionality, performance, and visual clarity, aligning with Şatıroğlu's approach to technical analysis. The default configuration is meticulously set to match the exact settings of the individual indicators as used by Tunç Şatıroğlu in his training, ensuring authenticity and ease of use for followers of his methodology. Whether you're a beginner or an experienced trader, this suite provides a versatile toolkit for analyzing markets across multiple timeframes.
Included Indicators:
1. WaveTrend with Crosses (by LazyBear, modified): A momentum oscillator that identifies overbought/oversold conditions and trend reversals with clear buy/sell signals via crosses and bar color highlights.
2. Kaufman Adaptive Moving Average (KAMA) (by HPotter, modified): A dynamic moving average that adapts to market volatility, offering a smoother trend-following signal.
3. SuperTrend (by Alex Orekhov, modified): A trend-following indicator that plots dynamic support/resistance levels with buy/sell signals and optional wicks for enhanced accuracy.
4. Nadaraya-Watson Envelope (by LuxAlgo, modified): A non-linear envelope that highlights potential reversals with customizable repainting options for smoother outputs.
5. Divergence for Many Indicators v4 (by LonesomeTheBlue, modified): Detects regular and hidden divergences across multiple indicators (MACD, RSI, Stochastic, CCI, Momentum, OBV, VWMA, CMF, MFI, and more) for early reversal signals.
6. Ichimoku Cloud (TradingView built-in, modified): A multi-faceted indicator for trend direction, support/resistance, and momentum, with enhanced visuals for the Kumo Cloud.
Key Features:
- Authentic Default Settings : Pre-configured to mirror the exact parameters used by Tunç Şatıroğlu for each indicator, ensuring alignment with his proven technical analysis approach.
- Customizable Settings : Enable/disable individual indicators and fine-tune parameters to suit your trading style while retaining the option to revert to Şatıroğlu’s defaults.
- Enhanced User Experience : Modifications improve visual clarity, performance, and usability, with options like repainting smoothing for Nadaraya-Watson and adjustable Ichimoku projection periods.
- Multi-Timeframe Analysis : Combines trend-following, momentum, and divergence tools for a holistic view of market dynamics.
- Alert Conditions : Built-in alerts for SuperTrend direction changes, buy/sell signals, and divergence detections to keep you informed.
- Visual Clarity : Overlays (KAMA, SuperTrend, Nadaraya-Watson, Ichimoku) and pane-based indicators (WaveTrend, Divergences) are clearly distinguished, with customizable colors and styles.
Notes:
- The Nadaraya-Watson Envelope and Ichimoku Cloud may repaint in their default modes. Use the "Repainting Smoothing" option for Nadaraya-Watson or adjust Ichimoku settings to mitigate repainting if preferred.
- Published under the MIT License, with components licensed under GPL-3.0 (SuperTrend), CC BY-NC-SA 4.0 (Nadaraya-Watson), MPL 2.0 (Divergence), and TradingView's terms (Ichimoku Cloud).
Usage:
Add this indicator to your TradingView chart to leverage Tunç Şatıroğlu’s exact indicator configurations out of the box. Customize settings as needed to align with your strategy, and use the combined signals to identify trends, reversals, and divergences. Ideal for traders following Şatıroğlu’s methodologies or anyone seeking a powerful, all-in-one technical analysis tool.
Credits:
Original authors: LazyBear, HPotter, Alex Orekhov, LuxAlgo, LonesomeTheBlue, and TradingView.
Modifications and integration by beytun .
License:
Published under the MIT License, incorporating code under GPL-3.0, CC BY-NC-SA 4.0, MPL 2.0, and TradingView’s terms where applicable.

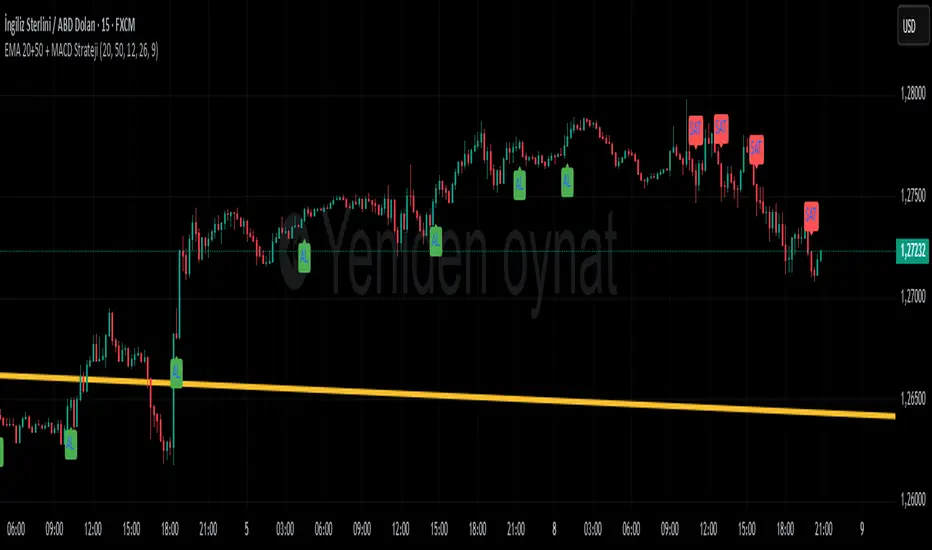
EMA 20+50 + MACD Strateji ( omerprıme)EASY BUY-SELL basitçe al -sat yapabileceğiniz macd indikatörü ve ema kullanılmış bir indikatördür unutmayın ki ne kadar basit o kadar verimli.
Moving Averages) to generate trading signals and trend confirmation.
Trend Identification with EMA
Two EMAs are used to determine the overall market trend (commonly a short-term EMA and a long-term EMA).
When the short EMA crosses above the long EMA, it indicates an uptrend.
When the short EMA crosses below the long EMA, it signals a downtrend.
Signal Confirmation with MACD
The MACD line and Signal line are analyzed to detect momentum shifts.
A bullish signal occurs when the MACD line crosses above the Signal line, especially if the EMAs confirm an uptrend.
A bearish signal occurs when the MACD line crosses below the Signal line, especially if the EMAs confirm a downtrend.
Trading Logic
Buy signals appear only when both the EMA trend is bullish and the MACD confirms momentum to the upside.
Sell signals appear only when both the EMA trend is bearish and the MACD confirms momentum to the downside.
AutoDay MA (Session-Normalized)📊 AutoDay MA (Session-Normalized Moving Average)
⚡ Daily power, intraday precision.
AutoDay MA automatically converts any N-day moving average into the exact equivalent on your current intraday timeframe.
💡 Concept inspired by Brian Shannon (Alphatrends) – mapping daily MAs onto intraday charts by normalizing session minutes.
🛠 How it works
Set Days (N) (e.g., 5, 10, 20).
Define Session Minutes per Day (⏱ 390 = US RTH, 🌍 1440 = 24h).
The indicator detects your chart’s timeframe and computes:
Length = (Days × SessionMinutes) / BarMinutes
Applies your chosen MA type (📐 SMA / EMA / RMA / WMA) with rounding (nearest, up, down).
Displays all details in a clear corner info panel.
✅ Why use it
Consistency 🔄: Same 5-day smoothing across all intraday charts.
Session-aware 🕒: Works for equities, futures, FX, crypto.
Transparency 🔍: Always shows the math & final MA length.
Alerts built-in 🔔: Cross up/down vs. price.
📈 Examples
5-Day on 1m → 1950-period MA
5-Day on 15m → 130-period MA
5-Day on 65m → 30-period MA
10-Day on 24h/15m (crypto) → 960-period MA

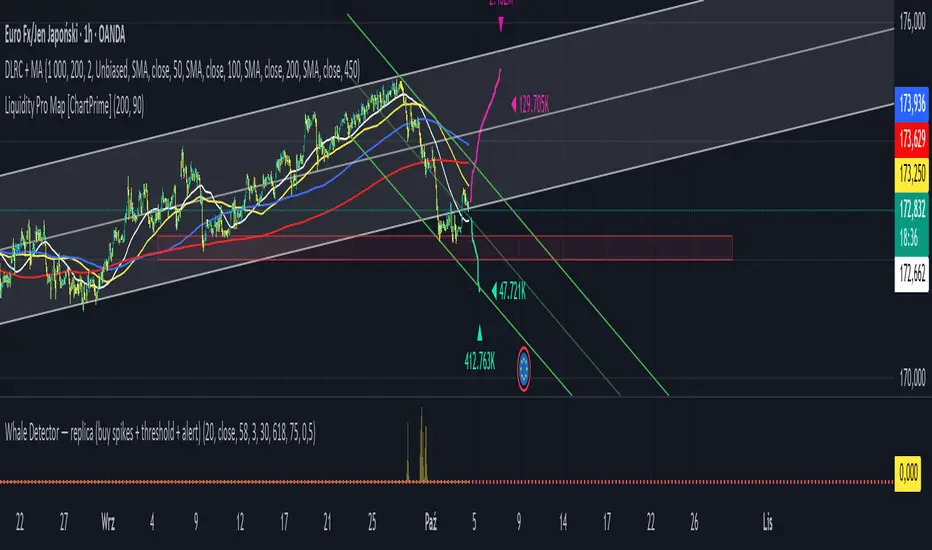
Jarass regression linesDouble Linear Regression Ultimate + MA Ribbon (DLRC + MA)
The DLRC + MA indicator is an advanced technical analysis tool that combines double linear regression channels with a moving average ribbon (MA Ribbon). Designed for traders who want to simultaneously track trend, volatility, and potential support/resistance levels.
Key Features:
1. Double Linear Regression Channels:
• Inner Channel – shorter period, more sensitive to recent price movements.
• Outer Channel – longer period, reflects the long-term trend.
• Both channels display upper and lower boundaries and a midline.
• Optional logarithmic scale for price adjustment.
• Real-time R² values to assess regression accuracy.
2. MA Ribbon:
• Up to 4 different moving averages simultaneously.
• Supports SMA, EMA, SMMA (RMA), WMA, VWMA.
• Each MA can be individually enabled/disabled, with customizable period, source, and color.
• Helps identify trend direction and dynamic support/resistance levels.
3. Visualization:
• Channels are filled with semi-transparent colors for clarity.
• Midline for quick trend direction assessment.
• Label displays R² values of the channels in real time.
4. Suitable For:
• Short-term and long-term traders seeking a combination of linear regression analysis and classic trend-following tools.
• Useful for identifying overbought/oversold zones and potential trend reversal points.
Summary:
DLRC + MA combines statistical precision of linear regression with intuitive trend visualization via a MA ribbon. It provides quick insight into market direction, volatility, and potential turning points, all in one chart overlay.
自定义均线(多色 & 分级线宽)Title: Multi-Color Moving Average Suite (MA5…MA4320) — Pine v6
Summary (1–2 lines):
An overlay indicator that plots a full ladder of SMA lines from MA5 up to MA4320. Each MA has a unique color, and line width scales with period (short = thin, mid = medium, long = thick) to make trend structure easy to read at a glance.
What it does
• Plots 16 simple moving averages: 5, 10, 20, 30, 60, 120, 160, 240, 480, 720, 960, 1440, 1750, 2880, 4320.
• Distinct colors for every MA to avoid confusion when lines cluster.
• Period-based thickness:
• Short-term (<60) = thin,
• Mid-term (60–160) = medium,
• Long-term (≥240) = thick (capped; no unlimited growth).
• Designed for quick trend reading across intraday to multi-year cycles (especially useful for 24/7 markets like crypto).
How to use
1. Add the indicator to any chart (works on all symbols/timeframes).
2. Use the thin/medium/thick visual hierarchy to identify short-/mid-/long-term bias and crossovers.
3. On very low timeframes, consider hiding some ultra-long MAs if your chart has insufficient history.
Notes
• Built with Pine Script v6; uses ta.sma(close, length) only (no repainting).
• Very long MAs (e.g., 2880/4320) require enough bars; they will display na until sufficient history loads.
• No inputs/alerts by default—kept intentionally simple for clarity. (Easy to extend with toggles, custom colors, EMA/WMA options, alerts, etc.)
Credits
Author: TraderFinsher (customized multi-MA visualization with color and thickness hierarchy).
⸻
标题: 多色均线系统(MA5…MA4320)— Pine v6
摘要(1–2 句):
这是一个叠加在价格上的 SMA 均线组,从 MA5 到 MA4320。为每条均线设置了 独立颜色,并按 周期长度分级线宽(短=细、中=中等、长=较粗),让趋势结构一眼可读。
功能说明
• 绘制 16 条简单移动平均线:5、10、20、30、60、120、160、240、480、720、960、1440、1750、2880、4320。
• 全部不同颜色,避免密集时混淆。
• 线宽随周期分级:
• 短期(<60)= 细,
• 中期(60–160)= 中等,
• 长期(≥240)= 粗(封顶,不再无限加粗)。
• 适合从日内到多年周期的 趋势快速判读(对加密等 24/7 市场尤为友好)。
使用建议
1. 将指标添加到任意品种/周期。
2. 结合细/中/粗的视觉层级,判断短/中/长趋势与均线交叉。
3. 在较低周期下,如果历史数据不足,可隐藏部分超长均线。
注意事项
• 使用 Pine v6,仅调用 ta.sma(close, length),不重绘。
• 超长均线需要足够历史数据,未满足前会显示 na。
• 默认不含参数和告警,追求简洁清晰(后续可扩展开关、自定义颜色/线宽、EMA/WMA 选项与告警等)。
致谢
作者:TraderFinsher(基于颜色与线宽层级的多均线可视化)。
