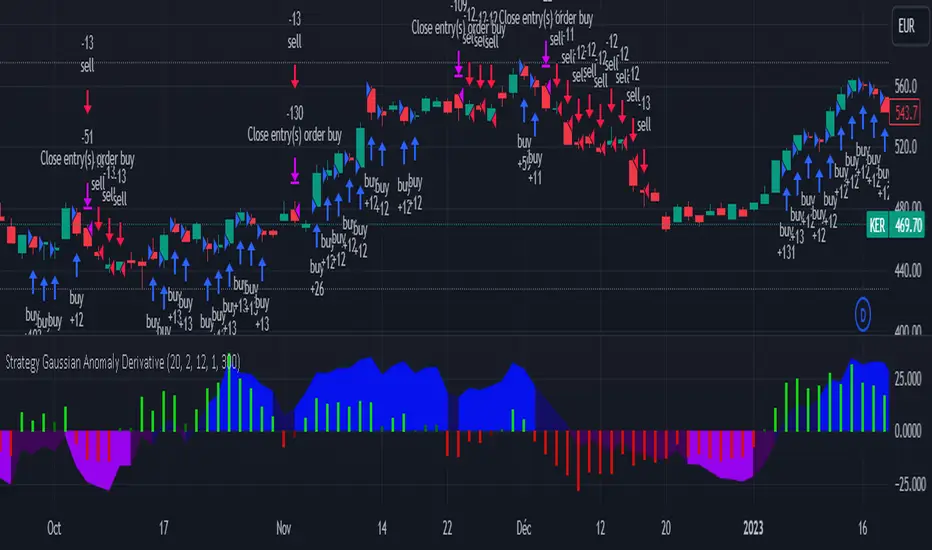
Strategy Gaussian Anomaly DerivativeConcept behind this Strategy :
Considering a normal "buy/sell" situation, an asset would be bought in average at the median price following a Gaussian like concept. A higher or lower average trend would significate that the current perceived value is respectively higher or lower than the current median price, which mean that the buyers are evaluating the price underpriced or overpriced.
This behaviour would be even more relevent depending on its derivative evolution.
Therefore, this Strategy setup is based on this Gaussian like concept anomaly of average close positionning compare to high-low average derivative, such as the derivative of the following ploted basic signal : 1-(high+low)/(2*close).
This Strategy can actually be used like a trend change and continuation strength indicator aswell.
In the Setup Signal part :
You can define the filtering of the basis signal "1-(high+low)/(2*close)" on EMA or SMA as you wish.
You can define the corresponding period and the threathold as a mutiply of the average 1/3 of all time value of the basis signal.
You can define the SMA filtering period of the Derivative signal and the corresponding threathold on the same mutiply of the average 1/3 of all time value of the derivative.
In the Setup Strategy part :
You can set up your strategy assesment based on Long and/or Short. You can also define the considered period.
The most successful tuned strategies I did were based on the derivative indicator with periods on the basis signal and the derivative under 30, can be 1 to 3 of te derivative and 7 to 21 for the basis signal. The threathold depends on the asset volatility aswell, 1 is usually the most efficient but 0 to 10 can be relevent depending on the situation I met. You can find an example of tuning for this strategy based on Kering's case hereafter.
I hoping that you will enjoy using this Strategy, don't hesitate to comment, to question, to correct or complete it ! I would be very curious about similar famous approaches that would have already been made.
Thank to you !
Médias Móveis
3kilos BTC 15mThe "3kilos BTC 15m" is a comprehensive trading strategy designed to work on a 15-minute timeframe for Bitcoin (BTC) or other cryptocurrencies. This strategy combines multiple indicators, including Triple Exponential Moving Averages (TEMA), Average True Range (ATR), and Heikin-Ashi candlesticks, to generate buy and sell signals. It also incorporates risk management features like take profit and stop loss.
Indicators
Triple Exponential Moving Averages (TEMA): Three TEMA lines are used with different lengths and sources:
Short TEMA (Red) based on highs
Long TEMA 1 (Blue) based on lows
Long TEMA 2 (Green) based on closing prices
Average True Range (ATR): Custom ATR calculation with EMA smoothing is used for volatility measurement.
Supertrend: Calculated using ATR and a multiplier to determine the trend direction.
Simple Moving Average (SMA): Applied to the short TEMA to smooth out its values.
Heikin-Ashi Close: Used for additional trend confirmation.
Entry & Exit Conditions
Long Entry: Triggered when the short TEMA is above both long TEMA lines, the Supertrend is bullish, the short TEMA is above its SMA, and the Heikin-Ashi close is higher than the previous close.
Short Entry: Triggered when the short TEMA is below both long TEMA lines, the Supertrend is bearish, the short TEMA is below its SMA, and the Heikin-Ashi close is lower than the previous close.
Take Profit and Stop Loss: Both are calculated as a percentage of the entry price, and they are set for both long and short positions.
Risk Management
Take Profit: Set at 1% above the entry price for long positions and 1% below for short positions.
Stop Loss: Set at 3% below the entry price for long positions and 3% above for short positions.
Commission and Pyramiding
Commission: A 0.07% commission is accounted for in the strategy.
Pyramiding: The strategy does not allow pyramiding.
Note
This strategy is designed for educational purposes and should not be considered as financial advice. Always do your own research and consider consulting a financial advisor before engaging in trading.

Trend Confirmation StrategyThe profitability and uniqueness of a trading strategy depend on various factors including market conditions, risk management, and the strategy's ability to capitalize on price movements. I'll describe the strategy provided and highlight its potential benefits and differences compared to other strategies:
Strategy Overview:
The provided strategy combines three technical indicators: Supertrend, MACD, and VWAP. It aims to identify potential entry and exit points by confirming trend direction and considering the proximity to the VWAP level. The strategy also incorporates stop-loss and take-profit mechanisms, as well as a trailing stop.
Unique Aspects and Potential Benefits:
Trend Confirmation: The strategy uses both Supertrend and MACD to confirm the trend direction. This dual confirmation can increase the likelihood of accurate trend identification and filter out false signals.
VWAP Confirmation: The strategy considers the proximity of the price to the VWAP level. This dynamic level can act as a support or resistance and provide additional context for entry decisions.
Adaptive Stop Loss: The strategy sets a stop-loss range, which helps provide some tolerance for minor price fluctuations. This adaptive approach considers market volatility and helps prevent premature stop-loss triggers.
Trailing Stop: The strategy incorporates a trailing stop mechanism to lock in profits as the trade moves in the desired direction. This can potentially enhance profitability during strong trends.
Partial Profit Booking: While not explicitly implemented in the provided code, you could consider booking partial profits when the MACD shows a crossover in the opposite direction. This aspect could help secure gains while still keeping exposure to potential further price movements.
Key Differences from Other Strategies:
Dual Indicator Confirmation: The combination of Supertrend and MACD for trend confirmation is a unique aspect of this strategy. It adds an extra layer of filtering to enhance the accuracy of entry signals.
Dynamic VWAP: Incorporating the VWAP level into the decision-making process adds a dynamic element to the strategy. VWAP is often used by institutional traders, and its inclusion can provide insights into the market sentiment.
Adaptive Stop Loss and Trailing: The strategy's use of an adaptive stop-loss range and a trailing stop can help manage risk and protect profits more effectively during changing market conditions.
Partial Profit Booking: The suggestion to consider partial profit booking upon MACD crossovers in the opposite direction is a practical approach to secure gains while staying in the trade.
Caution and Considerations:
Backtesting: Before deploying any strategy in real trading, it's crucial to thoroughly backtest it on historical data to understand its performance under various market conditions.
Risk Management: While the strategy has built-in risk management mechanisms, it's essential to carefully manage position sizes and overall portfolio risk.
Market Conditions: No strategy works well in all market conditions. It's important to be flexible and adjust the strategy or refrain from trading during particularly volatile or unpredictable periods.
Continuous Monitoring: Even though the strategy includes automated components, continuous monitoring of the trades and market conditions is necessary.
Adaptability: Markets can change over time. Traders need to be prepared to adapt the strategy as necessary to stay aligned with evolving market dynamics.

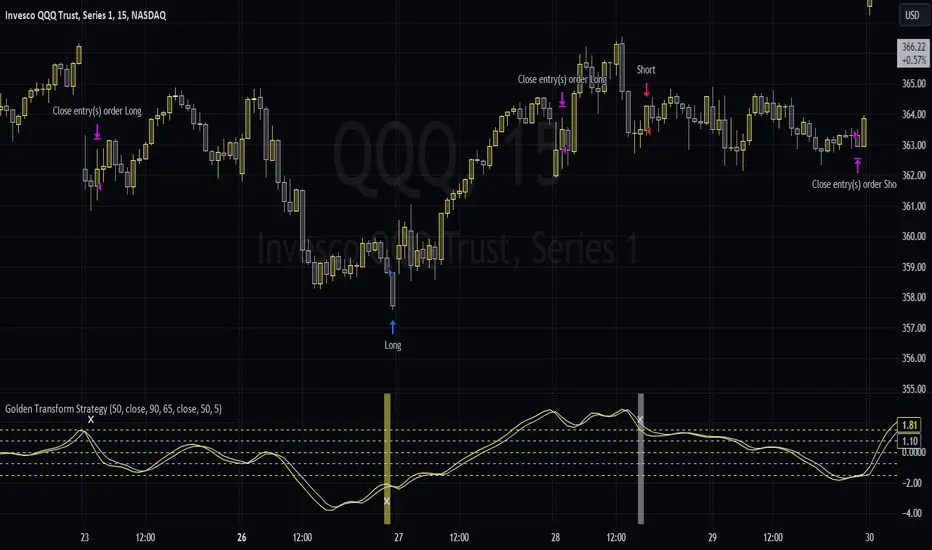
Golden Transform The Golden Transform Oscillator contains multiple technical indicators and conditions for making buy and sell decisions. Here's a breakdown of its components and what it's trying to achieve:
Strategy Setup:
The GT is designed to be plotted on the chart without overlaying other indicators.
Rate of Change (ROC) Calculation:
The Rate of Change (ROC) indicator is calculated with a specified period ("Rate of Change Length").
The ROC measures the percentage change in price over the specified period.
Hull Modified TRIX Calculation:
The Hull Modified TRIX indicator is calculated with a specified period ("Hull TRIX Length").
The Hull MA (Moving Average) formula, a modified WMA, is used to calculate a modified TRIX indicator, which is a momentum oscillator.
Hull MA Calculation:
A Hull Moving Average (Hull MA) is calculated as an entry filter.
Fisher Transform Calculation:
The Fisher Transform indicator is calculated to serve as a preemptive exit filter.
It involves mathematical transformations of price data to create an oscillator that can help identify potential reversals. The Fisher Transform is further smoothed using a Hull Moving Average (HMA).
Conditions and Signals:
Long conditions are determined based on crossovers between ROC and TRIX, as well as price relative the the MA. Short conditions are inversed.
Exit Conditions:
Exit conditions are defined for both long and short positions.
For long positions, the strategy exits if ROC crosses under TRIX, or if the smoothed Fisher Transform crosses above a threshold and declines. Once again, short conditions are the inverse.
Visualization and Plotting:
The script uses background colors for entry and shapes for exits to highlight different levels and conditions for the ROC/TRIX correlation.
It plots the Fisher Transform values and a lag trigger on the chart.
Overall, this script is a complex algorithm that combines multiple technical indicators and conditions to generate trading signals and manage positions in the financial markets. It aims to identify potential entry and exit points based on the interplay of the mentioned indicators and conditions.
Gaussian Detrended ReversionThis strategy, titled "Gaussian Detrended Reversion Strategy," aims to identify potential price reversals using the customized Gaussian Detrended Price Oscillator (GDPO) in combination with smoothed price cycles.
Key Elements of the Strategy:
GDPO Calculation: The strategy first calculates the Detrended Price Oscillator (DPO) by comparing the close price to an Exponential Moving Average (EMA) of a specified period. This calculation helps identify short-term price cycles by detrending the price data.
Gaussian Smoothing: The DPO values are then smoothed using the Arnaud Legoux Moving Average (ALMA), applying a Gaussian smoothing technique. This smoothed version of the DPO is intended to filter out noise and provide a clearer picture of price trends.
Entry and Exit Conditions: The strategy defines conditions for both long and short entry points as well as exit points. It looks for specific crossover events between the smoothed GDPO and its lagged version. The strategy enters a long position when the smoothed GDPO crosses above the lag and is negative, and exits the long position when the smoothed GDPO crosses below the lag or the zero line. Similarly, the strategy enters a short position when the smoothed GDPO crosses below the lag and is positive, and exits the short position when the smoothed GDPO crosses above the lag or the zero line.
Visualization: The smoothed GDPO and its lag are plotted on the chart using distinct colors. The zero line is also displayed as a reference point. Additionally, the chart background changes color when the strategy enters a long or short position. Cross markers are also plotted at the crossover points as exit cues.
Overall, this strategy aims to capture potential price reversals using the GDPO and Gaussian smoothing, with specific entry and exit conditions to guide trading decisions.
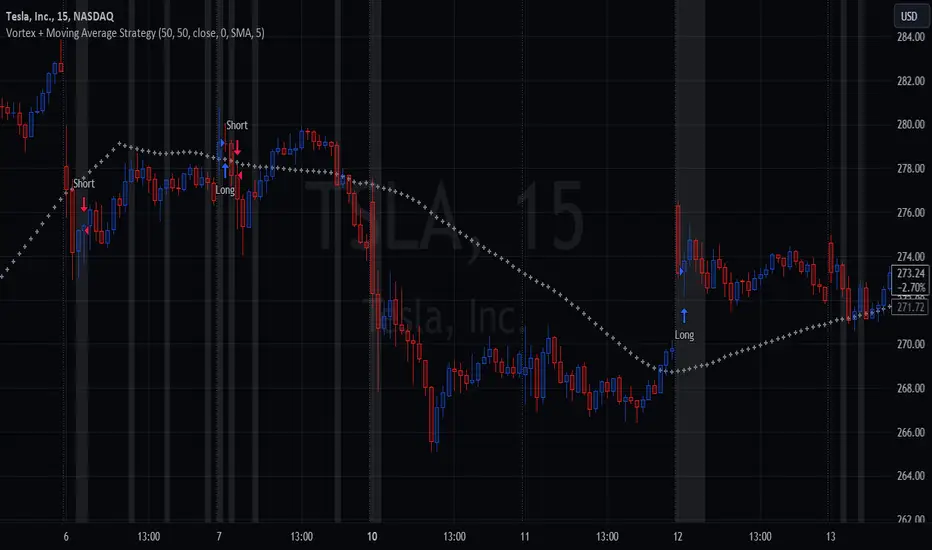
Vortex Cross w/MA ConfirmationThis script is a trading strategy that combines the Vortex Indicator and a Moving Average (MA) to generate potential entry signals for long and short positions.
1. Vortex Indicator:
The Vortex Indicator consists of two lines: Vortex Positive (VIP) and Vortex Negative (VIM). It is designed to identify trend direction and measure the strength of a trend.
2. Moving Average (MA):
The script uses a chosen type of Moving Average (SMA, EMA, SMMA, WMA, or VWMA) to smooth the price data. The smoothed line is referred to as the "Smoothing Line."
3. Determine Long and Short Conditions:
The script looks for potential long entry signals when VIP crosses above VIM, highlighting each crossover on the chart, and the closing price is above the Smoothing Line. It searches for short entry signals when VIM crosses above VIP, with the closing price is below the Smoothing Line. When the long or short conditions are met, the strategy enters either a long or short position accordingly.
Potential Usage:
The strategy can be utilized in trending markets, where the Vortex Indicator helps identify trend direction and strength, and the Moving Average smooths the price data to filter out some noise. It aims to capture trends and ride them while avoiding false signals during choppy or sideways markets.
Crunchster's Turtle and Trend SystemThis is a combination of two popular systematic trading strategies - in the trend following category.
The strategy is designed for use on the daily timeframe. Specific features of this system are outlined below:
1. Two different strategies to choose from, "Trend" which is a volatility adjusted Exponential Moving Average (EMA) crossover strategy and "Breakout" which is my adaptation of the well documented "Turtle Strategy"
2. Uses advanced position sizing and risk management, usually reserved for institutional portfolio management, a proven technique utilised by Commodity Trading Advisors and Managed Futures funds (Algo/Quant funds).
"Trend" uses a fast (user defined) and slow EMA crossover, where the slow length is 5 times the fast length. The resulting signal is adjusted for the volatility of returns over a 252 lookback period, which helps to normalise the signal across different assets. The system goes long or short when it detects a new trend has formed.
"Break" uses the highest high or lowest low over a user defined lookback period to define the recent range. This is converted into a price normalised signal to allow the system to detect when a breakout occurs. The system goes long or short based off the breakout signal.
Position sizing is based on recent price volatility and the user defined annualised risk target. In essence positions are inverse volatility weighted, so larger size is opened during lower volatility and smaller size during increased volatility. Recent volatility is calculated as the standard deviation of returns with 14 period lookback, then extrapolated into an annualised volatility of expected returns. Annualised recent volatility is then referenced to the risk target set by the user to adjust the position size. The default settings are a conservative 15% annual risk target/volatility. Initial capital should be set as the maximum risk capital per trade (ie if $10,000 total capital and 10% risk per trade, initial capital should be $1000). Maximum leverage per position can be set independently, to facilitate hitting risk targets that are greater than the natural volatility of the traded asset, and to accommodate low volatility conditions, whilst maintaining overall risk controls. Direction (long or short) is at the user's discretion.
Hard stop losses are based on multiples of the average true range of recent price (14 period lookback), user configurable.
Strategy trailing stops are based off recent highest highs or lowest lows (user defined lookback) to cut the position if the trend or momentum is lost.
Although both strategies can be run simultaneously, optimal diversification will be achieved if ran separately/individually to avoid masking of entries.

CCI+EMA Strategy with Percentage or ATR TP/SL [Alifer]This is a momentum strategy based on the Commodity Channel Index (CCI), with the aim of entering long trades in oversold conditions and short trades in overbought conditions.
Optionally, you can enable an Exponential Moving Average (EMA) to only allow trading in the direction of the larger trend. Please note that the strategy will not plot the EMA. If you want, for visual confirmation, you can add to the chart an Exponential Moving Average as a second indicator, with the same settings used in the strategy’s built-in EMA.
The strategy also allows you to set internal Stop Loss and Take Profit levels, with the option to choose between Percentage-based TP/SL or ATR-based TP/SL.
The strategy can be adapted to multiple assets and timeframes:
Pick an asset and a timeframe
Zoom back as far as possible to identify meaningful positive and negative peaks of the CCI
Set Overbought and Oversold at a rough average of the peaks you identified
Adjust TP/SL according to your risk management strategy
Like the strategy? Give it a boost!
Have any questions? Leave a comment or drop me a message.
CAUTIONARY WARNING
Please note that this is a complex trading strategy that involves several inputs and conditions. Before using it in live trading, it is highly recommended to thoroughly test it on historical data and use risk management techniques to safeguard your capital. After backtesting, it's also highly recommended to perform a first live test with a small amount. Additionally, it's essential to have a good understanding of the strategy's behavior and potential risks. Only risk what you can afford to lose .
USED INDICATORS
1 — COMMODITY CHANNEL INDEX (CCI)
The Commodity Channel Index (CCI) is a technical analysis indicator used to measure the momentum of an asset. It was developed by Donald Lambert and first published in Commodities magazine (now Futures) in 1980. Despite its name, the CCI can be used in any market and is not just for commodities. The CCI compares current price to average price over a specific time period. The indicator fluctuates above or below zero, moving into positive or negative territory. While most values, approximately 75%, fall between -100 and +100, about 25% of the values fall outside this range, indicating a lot of weakness or strength in the price movement.
The CCI was originally developed to spot long-term trend changes but has been adapted by traders for use on all markets or timeframes. Trading with multiple timeframes provides more buy or sell signals for active traders. Traders often use the CCI on the longer-term chart to establish the dominant trend and on the shorter-term chart to isolate pullbacks and generate trade signals.
CCI is calculated with the following formula:
(Typical Price - Simple Moving Average) / (0.015 x Mean Deviation)
Some trading strategies based on CCI can produce multiple false signals or losing trades when conditions turn choppy. Implementing a stop-loss strategy can help cap risk, and testing the CCI strategy for profitability on your market and timeframe is a worthy first step before initiating trades.
2 — AVERAGE TRUE RANGE (ATR)
The Average True Range (ATR) is a technical analysis indicator that measures market volatility by calculating the average range of price movements in a financial asset over a specific period of time. The ATR was developed by J. Welles Wilder Jr. and introduced in his book “New Concepts in Technical Trading Systems” in 1978.
The ATR is calculated by taking the average of the true range over a specified period. The true range is the greatest of the following:
The difference between the current high and the current low.
The difference between the previous close and the current high.
The difference between the previous close and the current low.
The ATR can be used to set stop-loss orders. One way to use ATR for stop-loss orders is to multiply the ATR by a factor (such as 2 or 3) and subtract it from the entry price for long positions or add it to the entry price for short positions. This can help traders set stop-loss orders that are more adaptive to market volatility.
3 — EXPONENTIAL MOVING AVERAGE (EMA)
The Exponential Moving Average (EMA) is a type of moving average (MA) that places a greater weight and significance on the most recent data points.
The EMA is calculated by taking the average of the true range over a specified period. The true range is the greatest of the following:
The difference between the current high and the current low.
The difference between the previous close and the current high.
The difference between the previous close and the current low.
The EMA can be used by traders to produce buy and sell signals based on crossovers and divergences from the historical average. Traders often use several different EMA lengths, such as 10-day, 50-day, and 200-day moving averages.
The formula for calculating EMA is as follows:
Compute the Simple Moving Average (SMA).
Calculate the multiplier for weighting the EMA.
Calculate the current EMA using the following formula:
EMA = Closing price x multiplier + EMA (previous day) x (1-multiplier)
STRATEGY EXPLANATION
1 — INPUTS AND PARAMETERS
The strategy uses the Commodity Channel Index (CCI) with additional options for an Exponential Moving Average (EMA), Take Profit (TP) and Stop Loss (SL).
length : The period length for the CCI calculation.
overbought : The overbought level for the CCI. When CCI crosses above this level, it may signal a potential short entry.
oversold : The oversold level for the CCI. When CCI crosses below this level, it may signal a potential long entry.
useEMA : A boolean input to enable or disable the use of Exponential Moving Average (EMA) as a filter for long and short entries.
emaLength : The period length for the EMA if it is used.
2 — CCI CALCULATION
The CCI indicator is calculated using the following formula:
(src - ma) / (0.015 * ta.dev(src, length))
src is the typical price (average of high, low, and close) and ma is the Simple Moving Average (SMA) of src over the specified length.
3 — EMA CALCULATION
If the useEMA option is enabled, an EMA is calculated with the given emaLength .
4 — TAKE PROFIT AND STOP LOSS METHODS
The strategy offers two methods for TP and SL calculations: percentage-based and ATR-based.
tpSlMethod_percentage : A boolean input to choose the percentage-based method.
tpSlMethod_atr : A boolean input to choose the ATR-based method.
5 — PERCENTAGE-BASED TP AND SL
If tpSlMethod_percentage is chosen, the strategy calculates the TP and SL levels based on a percentage of the average entry price.
tp_percentage : The percentage value for Take Profit.
sl_percentage : The percentage value for Stop Loss.
6 — ATR-BASED TP AND SL
If tpSlMethod_atr is chosen, the strategy calculates the TP and SL levels based on Average True Range (ATR).
atrLength : The period length for the ATR calculation.
atrMultiplier : A multiplier applied to the ATR to set the SL level.
riskRewardRatio : The risk-reward ratio used to calculate the TP level.
7 — ENTRY CONDITIONS
The strategy defines two conditions for entering long and short positions based on CCI and, optionally, EMA.
Long Entry: CCI crosses below the oversold level, and if useEMA is enabled, the closing price should be above the EMA.
Short Entry: CCI crosses above the overbought level, and if useEMA is enabled, the closing price should be below the EMA.
8 — TP AND SL LEVELS
The strategy calculates the TP and SL levels based on the chosen method and updates them dynamically.
For the percentage-based method, the TP and SL levels are calculated as a percentage of the average entry price.
For the ATR-based method, the TP and SL levels are calculated using the ATR value and the specified multipliers.
9 — EXIT CONDITIONS
The strategy defines exit conditions for both long and short positions.
If there is a long position, it will be closed either at TP or SL levels based on the chosen method.
If there is a short position, it will be closed either at TP or SL levels based on the chosen method.
Additionally, positions will be closed if CCI crosses back above oversold in long positions or below overbought in short positions.
10 — PLOTTING
The script plots the CCI line along with overbought and oversold levels as horizontal lines.
The CCI line is colored red when above the overbought level, green when below the oversold level, and white otherwise.
The shaded region between the overbought and oversold levels is plotted as well.

CC Trend strategy 2- Downtrend ShortTrend Strategy #2
Indicators:
1. EMA(s)
2. Fibonacci retracement with a mutable lookback period
Strategy:
1. Short Only
2. No preset Stop Loss/Take Profit
3. 0.01% commission
4. When in a profit and a closure above the 200ema, the position takes a profit.
5. The position is stopped When a closure over the (0.764) Fibonacci ratio occurs.
* NO IMMEDIATE RE-ENTRIES EVER!*
How to use it and what makes it unique:
This strategy will enter often and stop quickly. The goal with this strategy is to take losses often but catch the big move to the downside when it occurs through the Silvercross/Fibonacci combination. This is a unique strategy because it uses a programmed Fibonacci ratio that can be used within the strategy and on any program. You can manipulate the stats by changing the lookback period of the Fibonacci retracement and looking at different assets/timeframes.
This description tells the indicators combined to create a new strategy, with commissions and take profit/stop loss conditions included, and the process of strategy execution with a description of how to use it. If you have any questions feel free to PM me and boost if you found it helpful. Thank you, pineUSERS!
CHEATCODE1

Quantitative Trend Strategy- Uptrend longTrend Strategy #1
Indicators:
1. SMA
2. Pivot high/low functions derived from SMA
3. Step lines to plot support and resistance based on the pivot points
4. If the close is over the resistance line, green arrows plot above, and vice versa for red arrows below support.
Strategy:
1. Long Only
2. Mutable 2% TP/1.5% SL
3. 0.01% commission
4. When the close is greater than the pivot point of the sma pivot high, and the close is greater than the resistance step line, a long position is opened.
*At times, the 2% take profit may not trigger IF; the conditions for reentry are met at the time of candle closure + no exit conditions have been triggered.
5. If the position is in the green and the support step line crosses over the resistance step line, positions are exited.
How to use it and what makes it unique:
Use this strategy to trade an up-trending market using a simple moving average to determine the trend. This strategy is meant to capture a good risk/reward in a bullish market while staying active in an appropriate fashion. This strategy is unique due to it's inclusion of the step line function with statistics derived from myself.
This description tells the indicators combined to create a new strategy, with commissions and take profit/stop loss conditions included, and the process of strategy execution with a description on how to use it. If you have any questions feel free to PM me and boost if you enjoyed it. Thank you, pineUSERS!

Volume ValueWhen VelocityTitle: Volume ValueWhen Velocity Trading Strategy
▶ Introduction:
The " Volume ValueWhen Velocity " trading strategy is designed to generate long position signals based on various technical conditions, including volume thresholds, RSI (Relative Strength Index), and price action relative to the Simple Moving Average (SMA). The strategy aims to identify potential buy opportunities when specific criteria are met, helping traders capitalize on potential bullish movements.
▶ How to use and conditions
★ Important : Only on Spot Binance BINANCE:BTCUSDT
Name: Volume ValueWhen Velocity
Operating mode: Long on Spot BINANCE BINANCE:BTCUSDT
Timeframe: Only one hour
Market: Crypto
currency: Bitcoin only
Signal type: Medium or short term
Entry: All sections in the Technical Indicators and Conditions section must be saved to enter (This is explained below)
Exit: Based on loss limit and profit limit It is removed in the settings section
Backtesting:
⁃ Exchange: BINANCE BINANCE:BTCUSDT
⁃ Pair: BTCUSDT
⁃ Timeframe:1h
⁃ Fee: 0.1%
- Initial Capital: 1,000 USDT
- Position sizing: 500 usdt
-Trading Range: 2022-07-01 11:30 ___ 2023-07-21 14:30
▶ Strategy Settings and Parameters:
1. `strategy(title='Volume ValueWhen Velocity', ...`: Sets the strategy title, initial capital, default quantity type, default quantity value, commission value, and trading currency.
↬ Stop-Loss and Take-Profit Settings:
1. long_stoploss_value and long_stoploss_percentage : Define the stop-loss percentage for long positions.
2. long_takeprofit_value and long_takeprofit_percentage : Define the take-profit percentage for long positions.
↬ ValueWhen Occurrence Parameters:
1. occurrence_ValueWhen_1 and occurrence_ValueWhen_2 : Control the occurrences of value events.
2. `distance_value`: Specifies the minimum distance between occurrences of ValueWhen 1 and ValueWhen 2.
↬ RSI Settings:
1. rsi_over_sold and rsi_length : Define the oversold level and RSI length for RSI calculations.
↬ Volume Thresholds:
1. volume_threshold1 , volume_threshold2 , and volume_threshold3 : Set the volume thresholds for multiple volume conditions.
↬ ATR (Average True Range) Settings:
1. atr_small and atr_big : Specify the periods used to calculate the Average True Range.
▶ Date Range for Back-Testing:
1. start_date, end_date, start_month, end_month, start_year, and end_year : Define the date range for back-testing the strategy.
▶ Technical Indicators and Conditions:
1. rsi: Calculates the Relative Strength Index (RSI) based on the defined RSI length and the closing prices.
2. was_over_sold: Checks if the RSI was oversold in the last 10 bars.
3. getVolume and getVolume2 : Custom functions to retrieve volume data for specific bars.
4. firstCandleColor : Evaluates the color of the first candle based on different timeframes.
5. sma : Calculates the Simple Moving Average (SMA) of the closing price over 13 periods.
6. numCandles : Counts the number of candles since the close price crossed above the SMA.
7. atr1 : Checks if the ATR_small is less than ATR_big for the specified security and timeframe.
8. prevClose, prevCloseBarsAgo, and prevCloseChange : ValueWhen functions to calculate the change in the close price between specific occurrences.
9. atrval: A condition based on the ATR_value3.
▶ Buy Signal Condition:
Condition: A combination of multiple volume conditions.
buy_signal: The final buy signal condition that considers various technical conditions and their interactions.
▶ Long Strategy Execution:
1. The strategy will enter a long position (buy) when the buy_signal condition is met and within the specified date range.
2. A stop-loss and take-profit will be set for the long position to manage risk and potential profits.
▶ Conclusion:
The " Volume ValueWhen Velocity " trading strategy is designed to identify long position opportunities based on a combination of volume conditions, RSI, and price action. The strategy aims to capitalize on potential bullish movements and utilizes a stop-loss and take-profit mechanism to manage risk and optimize potential returns. Traders can use this strategy as a starting point for their own trading systems or further customize it to suit their preferences and risk appetite. It is crucial to thoroughly back-test and validate any trading strategy before deploying it in live markets.
↯ Disclaimer:
Risk Management is crucial, so adjust stop loss to your comfort level. A tight stop loss can help minimise potential losses. Use at your own risk.
How you or we can improve? Source code is open so share your ideas!
Leave a comment and smash the boost button!

Buy Only Strategy with Dynamic Re-Entry and ExitThe strategy aims to create a simple buy-only trading system based on moving average crossovers and the Weekly Commodity Channel Index (CCI) or Weekly Average Directional Index (ADX). It generates buy signals when the fast-moving average crosses above the slow-moving average and when the Weekly CCI and or Weekly ADX meet the specified conditions.
The strategy also allows for dynamic re-entry, which means it can open new long positions if the price goes above the three moving averages after an exit. However, the strategy will exit the long position if the price closes below the third moving average.
ENTRY CONDITIONS
The script defines the conditions for generating buy signals. It checks for two conditions for a valid buy signal:
• If the fast-moving average crosses above the slow-moving average -THERE IS Dynamic Re-Entry also
• If the user chooses HE OR SHE CAN FILTER TRADES BY USING CCI OR ADX
Dynamic Re-Entry:
the script allows for dynamic re-entry. If there is no active long position and the price is above all three moving averages a new long position is opened.
Exit Conditions
The script defines the exit condition for closing a long position. If the price closes below the third moving average, the script closes the long position.
IMPORTANT NOTICE
ONLY DAILY TIME FRAME
THERE WOULD BE WHIPSAW USE YOUR OWN ACCUMEN TO MINIMISE THEM
ITS ONLY BUY STRATEGY
EXIT CAN BE STRATEGY BASED OR SET PROFIT AND TARGETS AS PER RISK APETITE /RISK MANAGEMENT
DONT TRADE OPTIONS ON THIS
SUITABLE FOR STOCKS OF USA AND INDIAN MARKETS
ALWAYS REMEMBER TO DO YOUR OWN RESEARCH BEFORE TRADING AND INVESTING

Crunchster's Normalised Trend StrategyThis is a unique rules-based, systematic trading strategy - in the trend following category.
The strategy is designed for use on the daily timeframe. Specific features of this strategy are outlined below:
1. Uses a transformed price series (which I dub "real price") to generate signals rather than ticker price
2. Uses advanced position sizing and risk management, usually reserved for institutional portfolio management, a proven technique utilised by Commodity Trading Advisors and Managed Futures funds (Algo/Quant funds).
"Real Price" is a transformed price series derived from the sum of volatility adjusted (daily) returns, over the entire price series of an asset. The lookback period of the volatility adjustment is user defined.
A Hull moving average (HMA) is derived from the real price, and used as the main trend determinant. The lookback period of the HMA is user defined. Default lookback of 100 periods (days) ensures a responsive trend indicator, but without leading to over-trading from frequent crossovers (average holding period 14 days on BTC).
The core strategy is very simple, go long when real price crosses over HMA, go short when real price crosses under HMA. New position triggers automatically close open positions in the counter direction.
Position sizing is based on recent price volatility and the user defined annualised risk target. In essence positions are inverse volatility weighted, so larger size is opened during lower volatility and smaller size during increased volatility. Recent volatility is calculated as the standard deviation of returns with 14 period lookback, then extrapolated into an annualised volatility of expected returns. Annualised recent volatility is then referenced to the risk target set by the user to adjust the position size. The default settings are a very conservative 10% annual risk target. Initial capital should be set as the maximum risk capital per trade (ie if $10,000 total capital and 10% risk per trade, initial capital should be $1000). Maximum leverage per position can be set independently, to facilitate hitting risk targets that are greater than the natural volatility of the traded asset, and to accommodate low volatility conditions, whilst maintaining overall risk controls.
Hard stop losses are based on multiples of the average true range of recent price (14 period lookback), user configurable.
Please leave comments regarding further features or refinements. I plan to develop further adding alternative moving average selections and the ability to select/deselect long and short strategies.
3 hours ago
Release Notes:
Added option to compound profits versus using a fixed position capital. Be mindful that compounding will potentially increase profits, but also increase drawdowns and overall risk. Leverage will still cap overall exposure with compounding and therefore provides an additional layer of risk control.
2 hours ago
Release Notes:
Added function to toggle long/short strategy legs on and off.

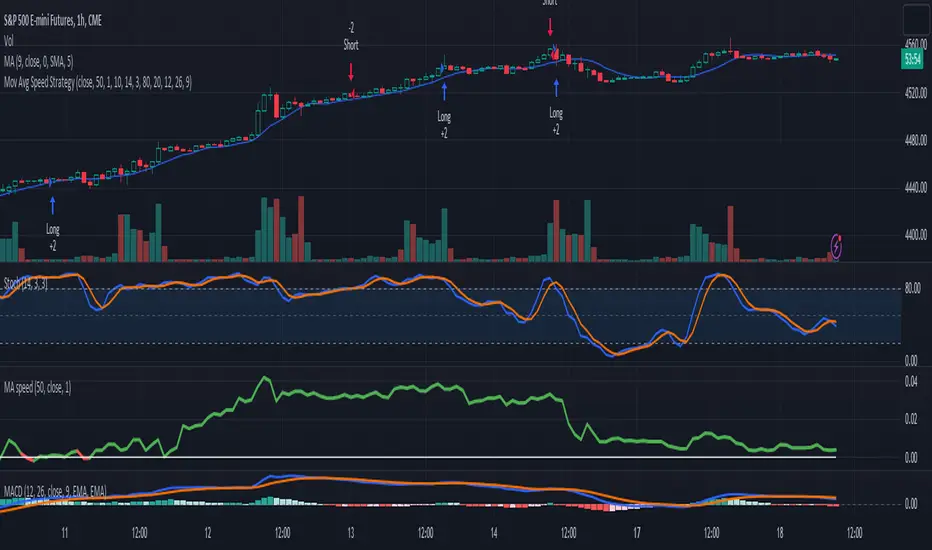
3-Signal Directional Trend Strategy for E-MinisThis is a conceptual strategy intended for E-mini S&P 500 futures with hourly bars.
It uses three signals, going long or short when two or more change in the same direction.
First is MACD. A positive oscillator is considered a bullish signal and a falling oscillator is interpreted bearishly.
Next, stochastics are used as an overbought/oversold indicator. Overbought conditions are considered bearish and oversold readings are viewed as bullish.
Third is a custom indicator based on our Moving Average Speed script. It takes the rate of change of the 50-hour simple moving average (SMA), and then smooths it using a 10-period average. This provides a directional signal.
Traders may want to experiment with different settings for moving average speed.
Note: This is intended for use with stock index futures, which have round-the clock price data to populate the data in the indicators. It may not yield good results with stocks or ETFs.
TradeStation has, for decades, advanced the trading industry, providing access to stocks, options, futures and cryptocurrencies. See our Overview for more.
Important Information
TradeStation Securities, Inc., TradeStation Crypto, Inc., and TradeStation Technologies, Inc. are each wholly owned subsidiaries of TradeStation Group, Inc., all operating, and providing products and services, under the TradeStation brand and trademark. TradeStation Crypto, Inc. offers to self-directed investors and traders cryptocurrency brokerage services. It is neither licensed with the SEC or the CFTC nor is it a Member of NFA. When applying for, or purchasing, accounts, subscriptions, products, and services, it is important that you know which company you will be dealing with. Please click here for further important information explaining what this means.
This content is for informational and educational purposes only. This is not a recommendation regarding any investment or investment strategy. Any opinions expressed herein are those of the author and do not represent the views or opinions of TradeStation or any of its affiliates.
Investing involves risks. Past performance, whether actual or indicated by historical tests of strategies, is no guarantee of future performance or success. There is a possibility that you may sustain a loss equal to or greater than your entire investment regardless of which asset class you trade (equities, options, futures, or digital assets); therefore, you should not invest or risk money that you cannot afford to lose. Before trading any asset class, first read the relevant risk disclosure statements on the Important Documents page, found here: www.tradestation.com .
Yesterday's High v.17.07Yesterday’s High Breakout it is a trading system based on the analysis of yesterday's highs, it works in trend-following mode therefore it opens a long position at the breakout of yesterday's highs even if they occur several times in one day.
There are several methods for exiting a trade, each with its own unique strategy. The first method involves setting Take-Profit and Stop-Loss percentages, while the second utilizes a trailing-stop with a specified offset value. The third method calls for a conditional exit when the candle closes below a reference EMA.
Additionally, operational filters can be applied based on the volatility of the currency pair, such as calculating the percentage change from the opening or incorporating a gap to the previous day's high levels. These filters help to anticipate or delay entry into the market, mitigating the risk of false breakouts.
In the specific case of INJ, a 12% Take-Profit and a 1.5% Stop-Loss were set, with an activated trailing-stop percentage, TRL 1 and OFF 0.5.
To postpone entry and avoid false breakouts, a 1% gap was added to the price of yesterday's highs.
Name: Yesterday's High Breakout - Trend Follower Strategy
Author: @tumiza999
Category: Trend Follower, Breakout of Yesterday's High.
Operating mode: Spot or Futures (only long).
Trade duration: Intraday.
Timeframe: 30M, 1H, 2H, 4H
Market: Crypto
Suggested usage: Short-term trading, when the market is in trend and it is showing high volatility.
Entry: When there is a breakout of Yesterday's High.
Exit: Profit target or Trailing stop, Stop loss or Crossunder EMA.
Configuration:
- Gap to anticipate or postpone the entry before or after the identified level
- Rate of Change for Entry Condition
- Take Profit, Stop Loss and Trailing Stop
- EMA length
Backtesting:
⁃ Exchange: BINANCE
⁃ Pair: INJUSDT
⁃ Timeframe: 4H
- Treshold: 1
- Gap%: 1
- SL: 1.5
- TP:12
- TRL: 1
- OFF-TRL: 0.5
⁃ Fee: 0.075%
⁃ Slippage: 1
- Initial Capital: 10000 USDT
- Position sizing: 10% of Equity
- Start : 2018-07-26 (Out Of Sample from 2022-12-23)
- Bar magnifier: on
Credits: LucF for Pine Coders (f_security function to avoid repainting using security)
Disclaimer: Risk Management is crucial, so adjust stop loss to your comfort level. A tight stop loss can help minimise potential losses. Use at your own risk.
How you or we can improve? Source code is open so share your ideas!
Leave a comment and smash the boost button!
Thanks for your attention, happy to support the TradingView community.

Master Trend ReversalThe 'Master Trend Reversal' strategy is an innovative approach to detecting trend reversals in the market. This strategy harnesses the power of 'Pin Bars', a specific type of candlestick, to pinpoint potential trading opportunities.
Based on the properties of Pin Bars, this strategy identifies scenarios where the market is likely to reverse its trend. In particular, it seeks out Pin Bars that are significantly longer than their surrounding candles, a length determined by the 'Pin Bar Size (%)' parameter.
When a bullish Pin Bar is detected (i.e., the closing price is lower than the opening price, and the gap between the opening and low prices exceeds the specified Pin Bar size), the strategy goes long. Conversely, upon identifying a bearish Pin Bar (the closing price is higher than the opening price, and the difference between the high and opening prices is greater than the specified Pin Bar size), the strategy goes short.
Furthermore, 'Master Trend Reversal' incorporates an efficient risk management mechanism via stop-loss orders. The stop-loss level is calculated based on the average price of the position and the 'Stop Loss Percentage (%)' as specified by the user.
Hence, the 'Master Trend Reversal' strategy offers a unique approach to capitalize on market trend reversals while limiting potential losses through the use of stop-loss orders. This combination of precise trend reversal detection and robust risk management makes this strategy particularly useful for traders seeking to maximize their profits while effectively controlling their risk exposure.
Please remember that, like any trading strategy, 'Master Trend Reversal' does not guarantee success and should be used as part of a holistic risk management approach in the markets.

Moving Average Rainbow (Stormer)This strategy is based and shown by trader and investor Alexandre Wolwacz "Stormer".
Overview
The strategy uses 12 moving averages (default EMA) to identify trends and generate trading signals opening positions.
Allowing to select the type of moving average and length to be used.
The conditions includes relationship between moving averages, the position of the current price relative to the moving averages, and the occurrence of certain price patterns.
Calculation
The mean moving averages is calculated by adding all the 12 moving averages and dividing by 12, the value is used to help to identify trend and possible condition to open position.
The 12 moving averages is spliced by 3 ranges, initial range (moving average lines 1 to 4), middle range (moving average lines 5 to 8) and end range (moving average lines 9 to 12). These ranges helps to identify potential trend and market turn over.
The moving average touch price is a relationship between the low price (uptrend) or high price (downtrend) with the moving average lines, it identifies where the price (low/high) has reached the the moving average line. Fetching the value to help for opening position, set stop loss and take profit.
Since the stop loss is based and set from the previous moving average touch price value, when position is about to be open and setting the stop loss value, there is a verification to check both current and previous moving average touch price to recalculate the stop loss value.
The turnover trend checks for a possible market turnover event, setting up a new profit target, this setting when enabled is to be helpful when a turnover occurs against the position to exit position with some profit based on highest high price if long or lowest low price if short.
The turnover signal is similar to turnover trend. The difference is that when this setting is enabled and it triggers, it simply exit the current position and opens up a reverse position, long goes short and short goes long. And there is an complement optional that checks current price exit profitable.
Entry Position
Long Position:
Price is higher than the mean moving averages. Meaning possible uptrend.
The lines of the middle range from the moving averages are in increasing order. Meaning possible uptrend.
The current high pierced up previous high.
Fetch the previous value of the moving average touch price. Meaning the low price has touched one of the moving average lines, which that value is conditioning to open position.
Short Position:
Price is lower than the mean moving averages. Meaning possible downtrend.
The lines of the middle range from the moving averages are in decreasing order. Meaning possible downtrend.
The current low pierced down previous low.
Fetch the previous value of the moving average touch price. Meaning the high price has touched one of the moving average lines, which that value is conditioning to open position.
Risk Management
Stop Loss:
The stop loss is based from the previous moving average touch price value, high price for short and low price for long or occurs an verification to check for both current and previous moving average touch price value and a recalculation is done to set the stop loss.
Take Profit:
According to the author, the profit target should be at least 1:1.6 the risk, so to have the strategy mathematically positive.
The profit target is configured input, can be increased or decreased.
It calculates the take profit based on the price of the stop loss with the profit target input.
Turnover Trend
Long Position:
The moving averages initial range lines signals a possible market turnover. Meaning long might be going short.
Fetches the highest high hit since the opening of the position, setting that value to the new profit target.
Short Position:
The moving averages initial range lines signals a possible market turnover. Meaning short might be going long.
Fetches the lowest low hit since the opening of the position, setting that value to the new profit target.

Bollinger Bands Modified (Stormer)This strategy is based and shown by trader and investor Alexandre Wolwacz "Stormer".
Overview
The strategy uses two indicators Bollinger Bands and EMA (optional for EMA).
Calculates Bollinger Bands, EMA, highest high, and lowest low values based on the input parameters, evaluating the conditions to determine potential long and short entry signals.
The conditions include checks for crossovers and crossunders of the price with the upper and lower Bollinger Bands, as well as the position of the price relative to the EMA.
The script also incorporates the option to add an inside bar pattern check for additional information.
Entry Position
Long Position:
Price cross over the superior band of bollinger bands.
The EMA is used to add support for trend analysis, it is an optional input, when used, it checks if price is above EMA.
Short Position:
Price cross under the inferior band of bollinger bands.
The EMA is used to add support for trend analysis, it is an optional input, when used, it checks if price is under EMA.
Risk Management
Stop Loss:
The stop loss is calculated based on the input highest high (for short position) and lowest low (for long position).
It gets the length based on the input from the last candles to set which is the highest high and which is the lowest low.
Take Profit:
According to the author, the profit target should be at least 1:1.6 the risk, so to have the strategy mathematically positive.
The profit target is configured input, can be increased or decreased.
It calculates the take profit based on the price of the stop loss with the profit target input.

twisted SMA strategy [4h] Hello
I would like to introduce a very simple strategy that uses a combination of 3 simple moving averages ( SMA 4 , SMA 9 , SMA 18 )
this is a classic combination showing the most probable trend directions
Crosses were marked on the basis of the color of the candles (bulish cross - blue / bearish cross - maroon)
ma 100 was used to determine the main trend, which is one of the most popular 4-hour candles
We define main trend while price crosses SMA100 ( for bullish trend I use green candle color )
The long position strategy was created in combination of 3 moving averages with Kaufman's adaptive moving average by alexgrover
The strategy is very accurate and is easy to use indicators
the strategy uses only Buy (Long) signals in a combination of crossovers of the SMA 4, SMA 9, SMA 18 and the Kaufman Adaptive Moving Average.
As a signal to close a long position, only the opposite signal of the intersection of 3 different moving averages is used
the current strategy is recommended for higher time zones (4h +) due to the strength of the closing candles, which translates into signal strength
works fascinatingly well for long-term bullish market assets (for example 4h Apple, Tesla charts)
Enjoy and trade safe ;)

Grid Strategy with MA0. Preface
Hello traders,
This is a strategy script that allows you to utilize a Grid Strategy using moving averages.
It is very simple, but I decided to post it because it was hard to find such shared open-source codes in Pine Script.
1. Main
This is a very simple trading method.
Based on the moving average line you set, if the price drops by a certain ATR (or percent) below it, you buy, and when it goes back up, you sell.
In basic settings, you choose the moving average line and its length, and decide how much to set the distance between each grid through the 'Band Multiplier/Percent' item.
I believe that it is advantageous to widen the bandwidth for stocks with strong upward momentum.
2. Conclusion
I have confirmed that this works better in the stock market than in the crypto market,
and that it is suitable for use on index stocks like NASDAQ because it follows trends.
In addition, through backtesting, I have confirmed that this grid strategy is more suitable for buying strategies than selling strategies, so I uploaded it as a strategy focused on buying strategies.
Personally, I have developed my own strategy by adjusting buying and selling strategies according to trends and managing risks.
I hope you can use this to create a script that suits you.
Thank you.

GKD-BT Baseline Backtest [Loxx]The Giga Kaleidoscope GKD-BT Baseline Backtest is a backtesting module included in Loxx's "Giga Kaleidoscope Modularized Trading System."
█ GKD-BT Baseline Backtest
The GKD-BT Baseline Backtest allows traders to backtest the Regular and Stepped baselines used in the GKD trading system. This module includes 65+ moving averages and 15+ types of volatility to choose from.
Additionally, this backtest module provides the option to test the GKD-B indicator with 1 to 3 take profits and 1 stop loss. The Trading backtest allows for the use of 1 to 3 take profits, while the Full backtest is limited to 1 take profit. The Trading backtest also offers the capability to apply a trailing take profit.
In terms of the percentage of trade removed at each take profit, this backtest module has the following hardcoded values:
Take profit 1: 50% of the trade is removed
Take profit 2: 25% of the trade is removed
Take profit 3: 25% of the trade is removed
Stop loss: 100% of the trade is removed
After each take profit is achieved, the stop loss level is adjusted. When take profit 1 is reached, the stop loss is moved to the entry point. Similarly, when take profit 2 is reached, the stop loss is shifted to take profit 1. The trailing take profit feature comes into play after take profit 2 or take profit 3, depending on the number of take profits selected in the settings. The trailing take profit is always activated on the final take profit when 2 or more take profits are chosen.
The backtest also offers the capability to restrict by a specific date range, allowing for simulated forward testing based on past data. Additionally, users have the option to display or hide a trading panel that provides relevant information about the backtest, statistics, and the current trade. It is also possible to activate alerts and toggle sections of the trading panel on or off. On the chart, historical take profit and stop loss levels are represented by horizontal lines overlaid for reference.
This backtest also includes an optional GKD-E Exit indicator that can be used to test early exits.
The GKD system utilizes volatility-based take profits and stop losses. Each take profit and stop loss is calculated as a multiple of volatility. You can change the values of the multipliers in the settings as well.
To utilize this strategy, follow these steps:
1. (Required) Import the value "Input into NEW GKD-BT Backtest" from the GKD-B Baseline indicator into the GKD-BT Baseline Backtest field "Import GKD-B Baseline"
2. (Optional) Import the value "Input into NEW GKD-BT Backtest" from the GKD-E Exit indicator into the GKD-BT Baseline Backtest field "Import GKD-E Exit". You can toggle the Exit on or off using the "Activate GKD-E Exit" option.
Baselines that are compatible with this backtest module:
GKD-B Baseline
GKD-B Stepped Baseline
Volatility Types Included
17 types of volatility are included in this indicator
Close-to-Close
Parkinson
Garman-Klass
Rogers-Satchell
Yang-Zhang
Garman-Klass-Yang-Zhang
Exponential Weighted Moving Average
Standard Deviation of Log Returns
Pseudo GARCH(2,2)
Average True Range
True Range Double
Standard Deviation
Adaptive Deviation
Median Absolute Deviation
Efficiency-Ratio Adaptive ATR
Mean Absolute Deviation
Static Percent
█ Giga Kaleidoscope Modularized Trading System
Core components of an NNFX algorithmic trading strategy
The NNFX algorithm is built on the principles of trend, momentum, and volatility. There are six core components in the NNFX trading algorithm:
1. Volatility - price volatility; e.g., Average True Range, True Range Double, Close-to-Close, etc.
2. Baseline - a moving average to identify price trend
3. Confirmation 1 - a technical indicator used to identify trends
4. Confirmation 2 - a technical indicator used to identify trends
5. Continuation - a technical indicator used to identify trends
6. Volatility/Volume - a technical indicator used to identify volatility/volume breakouts/breakdown
7. Exit - a technical indicator used to determine when a trend is exhausted
8. Metamorphosis - a technical indicator that produces a compound signal from the combination of other GKD indicators*
*(not part of the NNFX algorithm)
What is Volatility in the NNFX trading system?
In the NNFX (No Nonsense Forex) trading system, ATR (Average True Range) is typically used to measure the volatility of an asset. It is used as a part of the system to help determine the appropriate stop loss and take profit levels for a trade. ATR is calculated by taking the average of the true range values over a specified period.
True range is calculated as the maximum of the following values:
-Current high minus the current low
-Absolute value of the current high minus the previous close
-Absolute value of the current low minus the previous close
ATR is a dynamic indicator that changes with changes in volatility. As volatility increases, the value of ATR increases, and as volatility decreases, the value of ATR decreases. By using ATR in NNFX system, traders can adjust their stop loss and take profit levels according to the volatility of the asset being traded. This helps to ensure that the trade is given enough room to move, while also minimizing potential losses.
Other types of volatility include True Range Double (TRD), Close-to-Close, and Garman-Klass
What is a Baseline indicator?
The baseline is essentially a moving average, and is used to determine the overall direction of the market.
The baseline in the NNFX system is used to filter out trades that are not in line with the long-term trend of the market. The baseline is plotted on the chart along with other indicators, such as the Moving Average (MA), the Relative Strength Index (RSI), and the Average True Range (ATR).
Trades are only taken when the price is in the same direction as the baseline. For example, if the baseline is sloping upwards, only long trades are taken, and if the baseline is sloping downwards, only short trades are taken. This approach helps to ensure that trades are in line with the overall trend of the market, and reduces the risk of entering trades that are likely to fail.
By using a baseline in the NNFX system, traders can have a clear reference point for determining the overall trend of the market, and can make more informed trading decisions. The baseline helps to filter out noise and false signals, and ensures that trades are taken in the direction of the long-term trend.
What is a Confirmation indicator?
Confirmation indicators are technical indicators that are used to confirm the signals generated by primary indicators. Primary indicators are the core indicators used in the NNFX system, such as the Average True Range (ATR), the Moving Average (MA), and the Relative Strength Index (RSI).
The purpose of the confirmation indicators is to reduce false signals and improve the accuracy of the trading system. They are designed to confirm the signals generated by the primary indicators by providing additional information about the strength and direction of the trend.
Some examples of confirmation indicators that may be used in the NNFX system include the Bollinger Bands, the MACD (Moving Average Convergence Divergence), and the MACD Oscillator. These indicators can provide information about the volatility, momentum, and trend strength of the market, and can be used to confirm the signals generated by the primary indicators.
In the NNFX system, confirmation indicators are used in combination with primary indicators and other filters to create a trading system that is robust and reliable. By using multiple indicators to confirm trading signals, the system aims to reduce the risk of false signals and improve the overall profitability of the trades.
What is a Continuation indicator?
In the NNFX (No Nonsense Forex) trading system, a continuation indicator is a technical indicator that is used to confirm a current trend and predict that the trend is likely to continue in the same direction. A continuation indicator is typically used in conjunction with other indicators in the system, such as a baseline indicator, to provide a comprehensive trading strategy.
What is a Volatility/Volume indicator?
Volume indicators, such as the On Balance Volume (OBV), the Chaikin Money Flow (CMF), or the Volume Price Trend (VPT), are used to measure the amount of buying and selling activity in a market. They are based on the trading volume of the market, and can provide information about the strength of the trend. In the NNFX system, volume indicators are used to confirm trading signals generated by the Moving Average and the Relative Strength Index. Volatility indicators include Average Direction Index, Waddah Attar, and Volatility Ratio. In the NNFX trading system, volatility is a proxy for volume and vice versa.
By using volume indicators as confirmation tools, the NNFX trading system aims to reduce the risk of false signals and improve the overall profitability of trades. These indicators can provide additional information about the market that is not captured by the primary indicators, and can help traders to make more informed trading decisions. In addition, volume indicators can be used to identify potential changes in market trends and to confirm the strength of price movements.
What is an Exit indicator?
The exit indicator is used in conjunction with other indicators in the system, such as the Moving Average (MA), the Relative Strength Index (RSI), and the Average True Range (ATR), to provide a comprehensive trading strategy.
The exit indicator in the NNFX system can be any technical indicator that is deemed effective at identifying optimal exit points. Examples of exit indicators that are commonly used include the Parabolic SAR, the Average Directional Index (ADX), and the Chandelier Exit.
The purpose of the exit indicator is to identify when a trend is likely to reverse or when the market conditions have changed, signaling the need to exit a trade. By using an exit indicator, traders can manage their risk and prevent significant losses.
In the NNFX system, the exit indicator is used in conjunction with a stop loss and a take profit order to maximize profits and minimize losses. The stop loss order is used to limit the amount of loss that can be incurred if the trade goes against the trader, while the take profit order is used to lock in profits when the trade is moving in the trader's favor.
Overall, the use of an exit indicator in the NNFX trading system is an important component of a comprehensive trading strategy. It allows traders to manage their risk effectively and improve the profitability of their trades by exiting at the right time.
What is an Metamorphosis indicator?
The concept of a metamorphosis indicator involves the integration of two or more GKD indicators to generate a compound signal. This is achieved by evaluating the accuracy of each indicator and selecting the signal from the indicator with the highest accuracy. As an illustration, let's consider a scenario where we calculate the accuracy of 10 indicators and choose the signal from the indicator that demonstrates the highest accuracy.
The resulting output from the metamorphosis indicator can then be utilized in a GKD-BT backtest by occupying a slot that aligns with the purpose of the metamorphosis indicator. The slot can be a GKD-B, GKD-C, or GKD-E slot, depending on the specific requirements and objectives of the indicator. This allows for seamless integration and utilization of the compound signal within the GKD-BT framework.
How does Loxx's GKD (Giga Kaleidoscope Modularized Trading System) implement the NNFX algorithm outlined above?
Loxx's GKD v2.0 system has five types of modules (indicators/strategies). These modules are:
1. GKD-BT - Backtesting module (Volatility, Number 1 in the NNFX algorithm)
2. GKD-B - Baseline module (Baseline and Volatility/Volume, Numbers 1 and 2 in the NNFX algorithm)
3. GKD-C - Confirmation 1/2 and Continuation module (Confirmation 1/2 and Continuation, Numbers 3, 4, and 5 in the NNFX algorithm)
4. GKD-V - Volatility/Volume module (Confirmation 1/2, Number 6 in the NNFX algorithm)
5. GKD-E - Exit module (Exit, Number 7 in the NNFX algorithm)
6. GKD-M - Metamorphosis module (Metamorphosis, Number 8 in the NNFX algorithm, but not part of the NNFX algorithm)
(additional module types will added in future releases)
Each module interacts with every module by passing data to A backtest module wherein the various components of the GKD system are combined to create a trading signal.
That is, the Baseline indicator passes its data to Volatility/Volume. The Volatility/Volume indicator passes its values to the Confirmation 1 indicator. The Confirmation 1 indicator passes its values to the Confirmation 2 indicator. The Confirmation 2 indicator passes its values to the Continuation indicator. The Continuation indicator passes its values to the Exit indicator, and finally, the Exit indicator passes its values to the Backtest strategy.
This chaining of indicators requires that each module conform to Loxx's GKD protocol, therefore allowing for the testing of every possible combination of technical indicators that make up the six components of the NNFX algorithm.
What does the application of the GKD trading system look like?
Example trading system:
Backtest: GKD-BT Baseline Backtest as shown on the chart above
Baseline: Hull Moving Average as shown on the chart above
Volatility/Volume: Hurst Exponent
Confirmation 1: Sherif's HiLo
Confirmation 2: uf2018
Continuation: Coppock Curve
Exit: Fisher Transform as shown on the chart above
Metamorphosis: Baseline Optimizer
Each GKD indicator is denoted with a module identifier of either: GKD-BT, GKD-B, GKD-C, GKD-V, GKD-M, or GKD-E. This allows traders to understand to which module each indicator belongs and where each indicator fits into the GKD system.
█ Giga Kaleidoscope Modularized Trading System Signals
Standard Entry
1. GKD-C Confirmation gives signal
2. Baseline agrees
3. Price inside Goldie Locks Zone Minimum
4. Price inside Goldie Locks Zone Maximum
5. Confirmation 2 agrees
6. Volatility/Volume agrees
1-Candle Standard Entry
1a. GKD-C Confirmation gives signal
2a. Baseline agrees
3a. Price inside Goldie Locks Zone Minimum
4a. Price inside Goldie Locks Zone Maximum
Next Candle
1b. Price retraced
2b. Baseline agrees
3b. Confirmation 1 agrees
4b. Confirmation 2 agrees
5b. Volatility/Volume agrees
Baseline Entry
1. GKD-B Baseline gives signal
2. Confirmation 1 agrees
3. Price inside Goldie Locks Zone Minimum
4. Price inside Goldie Locks Zone Maximum
5. Confirmation 2 agrees
6. Volatility/Volume agrees
7. Confirmation 1 signal was less than 'Maximum Allowable PSBC Bars Back' prior
1-Candle Baseline Entry
1a. GKD-B Baseline gives signal
2a. Confirmation 1 agrees
3a. Price inside Goldie Locks Zone Minimum
4a. Price inside Goldie Locks Zone Maximum
5a. Confirmation 1 signal was less than 'Maximum Allowable PSBC Bars Back' prior
Next Candle
1b. Price retraced
2b. Baseline agrees
3b. Confirmation 1 agrees
4b. Confirmation 2 agrees
5b. Volatility/Volume agrees
Volatility/Volume Entry
1. GKD-V Volatility/Volume gives signal
2. Confirmation 1 agrees
3. Price inside Goldie Locks Zone Minimum
4. Price inside Goldie Locks Zone Maximum
5. Confirmation 2 agrees
6. Baseline agrees
7. Confirmation 1 signal was less than 7 candles prior
1-Candle Volatility/Volume Entry
1a. GKD-V Volatility/Volume gives signal
2a. Confirmation 1 agrees
3a. Price inside Goldie Locks Zone Minimum
4a. Price inside Goldie Locks Zone Maximum
5a. Confirmation 1 signal was less than 'Maximum Allowable PSVVC Bars Back' prior
Next Candle
1b. Price retraced
2b. Volatility/Volume agrees
3b. Confirmation 1 agrees
4b. Confirmation 2 agrees
5b. Baseline agrees
Confirmation 2 Entry
1. GKD-C Confirmation 2 gives signal
2. Confirmation 1 agrees
3. Price inside Goldie Locks Zone Minimum
4. Price inside Goldie Locks Zone Maximum
5. Volatility/Volume agrees
6. Baseline agrees
7. Confirmation 1 signal was less than 7 candles prior
1-Candle Confirmation 2 Entry
1a. GKD-C Confirmation 2 gives signal
2a. Confirmation 1 agrees
3a. Price inside Goldie Locks Zone Minimum
4a. Price inside Goldie Locks Zone Maximum
5a. Confirmation 1 signal was less than 'Maximum Allowable PSC2C Bars Back' prior
Next Candle
1b. Price retraced
2b. Confirmation 2 agrees
3b. Confirmation 1 agrees
4b. Volatility/Volume agrees
5b. Baseline agrees
PullBack Entry
1a. GKD-B Baseline gives signal
2a. Confirmation 1 agrees
3a. Price is beyond 1.0x Volatility of Baseline
Next Candle
1b. Price inside Goldie Locks Zone Minimum
2b. Price inside Goldie Locks Zone Maximum
3b. Confirmation 1 agrees
4b. Confirmation 2 agrees
5b. Volatility/Volume agrees
Continuation Entry
1. Standard Entry, 1-Candle Standard Entry, Baseline Entry, 1-Candle Baseline Entry, Volatility/Volume Entry, 1-Candle Volatility/Volume Entry, Confirmation 2 Entry, 1-Candle Confirmation 2 Entry, or Pullback entry triggered previously
2. Baseline hasn't crossed since entry signal trigger
4. Confirmation 1 agrees
5. Baseline agrees
6. Confirmation 2 agrees

ATR GOD Strategy by TradeSmart (PineConnector-compatible)This is a highly-customizable trading strategy made by TradeSmart, focusing mainly on ATR-based indicators and filters. The strategy is mainly intended for trading forex , and has been optimized using the Deep Backtest feature on the 2018.01.01 - 2023.06.01 interval on the EUR/USD (FXCM) 15M chart, with a Slippage value of 3, and a Commission set to 0.00004 USD per contract. The strategy is also made compatible with PineConnector , to provide an easy option to automate the strategy using a connection to MetaTrader. See tooltips for details on how to set up the bot, and check out our website for a detailed guide with images on how to automate the strategy.
The strategy was implemented using the following logic:
Entry strategy:
A total of 4 Supertrend values can be used to determine the entry logic. There is option to set up all 4 Supertrend parameters individually, as well as their potential to be used as an entry signal/or a trend filter. Long/Short entry signals will be determined based on the selected potential Supertrend entry signals, and filtered based on them being in an uptrend/downtrend (also available for setup). Please use the provided tooltips for each setup to see every detail.
Exit strategy:
4 different types of Stop Losses are available: ATR-based/Candle Low/High Based/Percentage Based/Pip Based. Additionally, Force exiting can also be applied, where there is option to set up 4 custom sessions, and exits will happen after the session has closed.
Parameters of every indicator used in the strategy can be tuned in the strategy settings as follows:
Plot settings:
Plot Signals: true by default, Show all Long and Short signals on the signal candle
Plot SL/TP lines: false by default, Checking this option will result in the TP and SL lines to be plotted on the chart.
Supertrend 1-4:
All the parameters of the Supertrends can be set up here, as well as their individual role in the entry logic.
Exit Strategy:
ATR Based Stop Loss: true by default
ATR Length (of the SL): 100 by default
ATR Smoothing (of the SL): RMA/SMMA by default
Candle Low/High Based Stop Loss: false by default, recent lowest or highest point (depending on long/short position) will be used to calculate stop loss value. Set 'Base Risk Multiplier' to 1 if you would like to use the calculated value as is. Setting it to a different value will count as an additional multiplier.
Candle Lookback (of the SL): 50 by default
Percentage Based Stop Loss: false by default, Set the stop loss to current price - % of current price (long) or price + % of current price (short).
Percentage (of the SL): 0.3 by default
Pip Based Stop Loss: Set the stop loss to current price - x pips (long) or price + x pips (short). Set 'Base Risk Multiplier' to 1 if you would like to use the calculated value as is. Setting it to a different value will count as an additional multiplier.
Pip (of the SL): 10 by default
Base Risk Multiplier: 4.5 by default, the stop loss will be placed at this risk level (meaning in case of ATR SL that the ATR value will be multiplied by this factor and the SL will be placed that value away from the entry level)
Risk to Reward Ratio: 1.5 by default, the take profit level will be placed such as this Risk/Reward ratio is met
Force Exiting:
4 total Force exit on custom session close options: none applied by default. If enabled, trades will close automatically after the set session is closed (on next candle's open).
Base Setups:
Allow Long Entries: true by default
Allow Short Entries: true by default
Order Size: 10 by default
Order Type: Capital Percentage by default, allows adjustment on how the position size is calculated: Cash: only the set cash amount will be used for each trade Contract(s): the adjusted number of contracts will be used for each trade Capital Percentage: a % of the current available capital will be used for each trade
ATR Limiter:
Use ATR Limiter: true by default, Only enter into any position (long/short) if ATR value is higher than the Low Boundary and lower than the High Boundary.
ATR Limiter Length: 50 by default
ATR Limiter Smoothing: RMA/SMMA by default
High Boundary: 1000 by default
Low Boundary: 0.0003 by default
MA based calculation: ATR value under MA by default, If not Unspecified, an MA is calculated with the ATR value as source. Only enter into position (long/short) if ATR value is higher/lower than the MA.
MA Type: RMA/SMMA by default
MA Length: 400 by default
Waddah Attar Filter:
Explosion/Deadzone relation: Not specified by default, Explosion over Deadzone: trades will only happen if the explosion line is over the deadzone line; Explosion under Deadzone: trades will only happen if the explosion line is under the deadzone line; Not specified: the opening of trades will not be based on the relation between the explosion and deadzone lines.
Limit trades based on trends: Not specified by default, Strong Trends: only enter long if the WA bar is colored green (there is an uptrend and the current bar is higher then the previous); only enter short if the WA bar is colored red (there is a downtrend and the current bar is higher then the previous); Soft Trends: only enter long if the WA bar is colored lime (there is an uptrend and the current bar is lower then the previous); only enter short if the WA bar is colored orange (there is a downtrend and the current bar is lower then the previous); All Trends: only enter long if the WA bar is colored green or lime (there is an uptrend); only enter short if the WA bar is colored red or orange (there is a downtrend); Not specified: the color of the WA bar (trend) is not relevant when considering entries.
WA bar value: Not specified by default, Over Explosion and Deadzone: only enter trades when the WA bar value is over the Explosion and Deadzone lines; Not specified: the relation between the explosion/deadzone lines to the value of the WA bar will not be used to filter opening trades.
Sensitivity: 150 by default
Fast MA Type: SMA by default
Fast MA Length: 10 by default
Slow MA Type: SMA
Slow MA Length: 20 by default
Channel MA Type: EMA by default
BB Channel Length: 20 by default
BB Stdev Multiplier: 2 by default
Trend Filter:
Use long trend filter 1: false by default, Only enter long if price is above Long MA.
Show long trend filter 1: false by default, Plot the selected MA on the chart.
TF1 - MA Type: EMA by default
TF1 - MA Length: 120 by default
TF1 - MA Source: close by default
Use short trend filter 1: false by default, Only enter long if price is above Long MA.
Show short trend filter 1: false by default, Plot the selected MA on the chart.
TF2 - MA Type: EMA by default
TF2 - MA Length: 120 by default
TF2 - MA Source: close by default
Volume Filter:
Only enter trades where volume is higher then the volume-based MA: true by default, a set type of MA will be calculated with the volume as source, and set length
MA Type: RMA/SMMA by default
MA Length: 200 by default
Date Range Limiter:
Limit Between Dates: false by default
Start Date: Jan 01 2023 00:00:00 by default
End Date: Jun 24 2023 00:00:00 by default
Session Limiter:
Show session plots: false by default, show market sessions on chart: Sidney (red), Tokyo (orange), London (yellow), New York (green)
Use session limiter: false by default, if enabled, trades will only happen in the ticked sessions below.
Sidney session: false by default, session between: 15:00 - 00:00 (EST)
Tokyo session: false by default, session between: 19:00 - 04:00 (EST)
London session: false by default, session between: 03:00 - 11:00 (EST)
New York session: false by default, session between: 08:00 - 17:00 (EST)
Trading Time:
Limit Trading Time: true by default, tick this together with the options below to enable limiting based on day and time
Valid Trading Days Global: 123567 by default, if the Limit Trading Time is on, trades will only happen on days that are present in this field. If any of the not global Valid Trading Days is used, this field will be neglected. Values represent days: Sunday (1), Monday (2), ..., Friday (6), Saturday(7) To trade on all days use: 123457
(1) Valid Trading Days: false, 123456 by default, values represent days: Sunday (1), Monday (2), ..., Friday (6), Saturday(7) The script will trade on days that are present in this field. Please make sure that this field and also (1) Valid Trading Hours Between is checked
(1) Valid Trading Hours Between: false, 1800-2000 by default, hours between which the trades can happen. The time is always in the exchange's timezone
All other options are also disabled by default
PineConnector Automation:
Use PineConnector Automation: false by default, In order for the connection to MetaTrader to work, you will need do perform prerequisite steps, you can follow our full guide at our website, or refer to the official PineConnector Documentation. To set up PineConnector Automation on the TradingView side, you will need to do the following:
1. Fill out the License ID field with your PineConnector License ID;
2. Fill out the Risk (trading volume) with the desired volume to be traded in each trade (the meaning of this value depends on the EA settings in Metatrader. Follow the detailed guide for additional information);
3. After filling out the fields, you need to enable the 'Use PineConnector Automation' option (check the box in the strategy settings);
4. Check if the chart has updated and you can see the appropriate order comments on your chart;
5. Create an alert with the strategy selected as Condition, and the Message as {{strategy.order.comment}} (should be there by default);
6. Enable the Webhook URL in the Notifications section, set it as the official PineConnector webhook address and enjoy your connection with MetaTrader.
License ID: 60123456789 by default
Risk (trading volume): 1 by default
NOTE! Fine-tuning/re-optimization is highly recommended when using other asset/timeframe combinations.
