Impulse Reactor RSI-SMA Trend Indicator [ApexLegion]Impulse Reactor RSI-SMA Trend Indicator
Introduction and Theoretical Background
Design Rationale
Standard indicators frequently generate binary 'BUY' or 'SELL' signals without accounting for the broader market context. This often results in erratic "Flip-Flop" behavior, where signals are triggered indiscriminately regardless of the prevailing volatility regime.
Impulse Reactor was engineered to address this limitation by unifying two critical requirements: Quantitative Rigor and Execution Flexibility.
The Solution
Composite Analytical Framework This script is not a simple visual overlay of existing indicators. It is an algorithmic synthesis designed to function as a unified decision-making engine. The primary objective was to implement rigorous quantitative analysis (Volatility Normalization, Structural Filtering) directly within an alert-enabled framework. This architecture is designed to process signals through strict, multi-factor validation protocols before generating real-time notifications, allowing users to focus on structurally validated setups without manual monitoring.
How It Works
This is not a simple visual mashup. It utilizes a cross-validation algorithm where the Trend Structure acts as a gatekeeper for Momentum signals:
Logic over Lag: Unlike simple moving average crossovers, this script uses a 15-layer Gradient Ribbon to detect "Laminar Flow." If the ribbon is knotted (Compression), the system mathematically suppresses all signals.
Volatility Normalization: The core calculation adapts to ATR (Average True Range). This means the indicator automatically expands in volatile markets and contracts in quiet ones, maintaining accuracy without constant manual tweaking.
Adaptive Signal Thresholding: It incorporates an 'Anti-Greed' algorithm (Dynamic Thresholding) that automatically adjusts entry criteria based on trend duration. This logic aims to mitigate the risk of entering positions during periods of statistical trend exhaustion.
Why Use It?
Market State Decoding: The gradient Ribbon visualizes the underlying trend phase in real-time.
◦ Cyan/Blue Flow: Strong Bullish Trend (Laminar Flow).
◦ Magenta/Pink Flow: Strong Bearish Trend.
◦ Compressed/Knotted: When the ribbon lines are tightly squeezed or overlapping, it signals Consolidation. The system filters signals here to avoid chop.
Noise Reduction: The goal is not to catch every pivot, but to isolate high-confidence setups. The logic explicitly filters out minor fluctuations to help maintain position alignment with the broader trend.
⚖️ Chapter 1: System Architecture
Introduction: Composite Analytical Framework
System Overview
Impulse Reactor serves as a comprehensive technical analysis engine designed to synthesize three distinct market dimensions—Momentum, Volatility, and Trend Structure—into a unified decision-making framework. Unlike traditional methods that analyze these metrics in isolation, this system functions as a central processing unit that integrates disparate data streams to construct a coherent model of market behavior.
Operational Objective
The primary objective is to transition from single-dimensional signal generation to a multi-factor assessment model. By fusing data from the Impulse Core (Volatility), Gradient Oscillator (Momentum), and Structural Baseline (Trend), the system aims to filter out stochastic noise and identify high-probability trade setups grounded in quantitative confluence.
Market Microstructure Analysis: Limitations of Conventional Models
Extensive backtesting and quantitative analysis have identified three critical inefficiencies in standard oscillator-based strategies:
• Bounded Oscillator Limitations (The "Oscillation Trap"): Traditional indicators such as RSI or Stochastics are mathematically constrained between fixed values (0 to 100). In strong trending environments, these metrics often saturate in "overbought" or "oversold" zones. Consequently, traders relying on static thresholds frequently exit structurally valid positions prematurely or initiate counter-trend trades against prevailing momentum, resulting in suboptimal performance.
• Quantitative Blindness to Quality: Standard moving averages and trend indicators often fail to distinguish the qualitative nature of price movement. They treat low-volume drift and high-velocity expansion identically. This inability to account for "Volatility Quality" leads to delayed responsiveness during critical market events.
• Fractal Dissonance (Timeframe Disconnect): Financial markets exhibit fractal characteristics where trends on lower timeframes may contradict higher timeframe structures. Manual integration of multi-timeframe analysis increases cognitive load and susceptibility to human error, often resulting in conflicting biases at the point of execution.
Core Design Principles
To mitigate the aforementioned systemic inefficiencies, Impulse Reactor employs a modular architecture governed by three foundational principles:
Principle A:
Volatility Precursor Analysis Market mechanics demonstrate that volatility expansion often functions as a leading indicator for directional price movement. The system is engineered to detect "Volatility Deviation" — specifically, the divergence between short-term and long-term volatility baselines—prior to its manifestation in price action. This allows for entry timing aligned with the expansion phase of market volatility.
Principle B:
Momentum Density Visualization The system replaces singular momentum lines with a "Momentum Density" model utilizing a 15-layer Simple Moving Average (SMA) Ribbon.
• Concept: This visualization represents the aggregate strength and consistency of the trend.
• Application: A fully aligned and expanded ribbon indicates a robust trend structure ("Laminar Flow") capable of withstanding minor counter-trend noise, whereas a compressed ribbon signals consolidation or structural weakness.
Principle C:
Adaptive Confluence Protocols Signal validity is strictly governed by a multi-dimensional confluence logic. The system suppresses signal generation unless there is synchronized confirmation across all three analytical vectors:
1. Volatility: Confirmed expansion via the Impulse Core.
2. Momentum: Directional alignment via the Hybrid Oscillator.
3. Structure: Trend validation via the Baseline. This strict filtering mechanism significantly reduces false positives in non-trending (choppy) environments while maintaining sensitivity to genuine breakouts.
🔍 Chapter 2: Core Modules & Algorithmic Logic
Module A: Impulse Core (Normalized Volatility Deviation)
Operational Logic The Impulse Core functions as a volatility-normalized momentum gauge rather than a standard oscillator. It is designed to identify "Volatility Contraction" (Squeeze) and "Volatility Expansion" phases by quantifying the divergence between short-term and long-term volatility states.
Volatility Z-Score Normalization
The formula implements a custom normalization algorithm. Unlike standard oscillators that rely on absolute price changes, this logic calculates the Z-Score of the Volatility Spread.
◦ Numerator: (atr_f - atr_s) captures the raw momentum of volatility expansion.
◦ Denominator: (std_f + 1e-6) standardizes this value against historical variance.
◦ Result: This allows the indicator scales consistently across assets (e.g., Bitcoin vs. Euro) without manual recalibration.
f_impulse() =>
atr_f = ta.atr(fastLen) // Fast Volatility Baseline
atr_s = ta.atr(slowLen) // Slow Volatility Baseline
std_f = ta.stdev(atr_f, devLen) // Volatility Standard Deviation
(atr_f - atr_s) / (std_f + 1e-6) // Normalized Differential Calculation
Algorithmic Framework
• Differential Calculation: The system computes the spread between a Fast Volatility Baseline (ATR-10) and a Slow Volatility Baseline (ATR-30).
• Normalization Protocol: To standardize consistency across diverse asset classes (e.g., Forex vs. Crypto), the raw differential is divided by the standard deviation of the volatility itself over a 30-period lookback.
• Signal Generation:
◦ Contraction (Squeeze): When the Fast ATR compresses below the Slow ATR, it registers a potential volatility buildup phase.
◦ Expansion (Release): A rapid divergence of the Fast ATR above the Slow ATR signals a confirmed volatility expansion, validating the strength of the move.
Module B: Gradient Oscillator (RSI-SMA Hybrid)
Design Rationale To mitigate the "noise" and "false reversal" signals common in single-line oscillators (like standard RSI), this module utilizes a 15-Layer Gradient Ribbon to visualize momentum density and persistence.
Technical Architecture
• Ribbon Array: The system generates 15 sequential Simple Moving Averages (SMA) applied to a volatility-adjusted RSI source. The length of each layer increases incrementally.
• State Analysis:
Momentum Alignment (Laminar Flow): When all 15 layers are expanded and parallel, it indicates a robust trend where buying/selling pressure is distributed evenly across multiple timeframes. This state helps filter out premature "overbought/oversold" signals.
• Consolidation (Compression): When the distance between the fastest layer (Layer 1) and the slowest layer (Layer 15) approaches zero or the layers intersect, the system identifies a "Non-Tradable Zone," preventing entries during choppy market conditions.
// Laminar Flow Validation
f_validate_trend() =>
// Calculate spread between Ribbon layers
ribbon_spread = ta.stdev(ribbon_array, 15)
// Only allow signals if Ribbon is expanded (Laminar Flow)
is_flowing = ribbon_spread > min_expansion_threshold
// If compressed (Knotted), force signal to false
is_flowing ? signal : na
Module C: Adaptive Signal Filtering (Behavioral Bias Mitigation)
This subsystem, operating as an algorithmic "Anti-Greed" Mechanism, addresses the statistical tendency for signal degradation following prolonged trends.
Dynamic Threshold Adjustment
• Win Streak Detection: The algorithm internally tracks the outcome of closed trade cycles.
• Sensitivity Multiplier: Upon detecting consecutive successful signals in the same direction, a Penalty_Factor is applied to the entry logic.
• Operational Impact: This effectively raises the Required_Slope threshold for subsequent signals. For example, after three consecutive bullish signals, the system requires a 30% steeper trend angle to validate a fourth entry. This enforces stricter discipline during extended trends to reduce the probability of entering at the point of trend exhaustion.
Anti-Greed Logic: Dynamic Threshold Calculation
f_adjust_threshold(base_slope, win_streak) =>
// Adds a 10% penalty to the difficulty for every consecutive win
penalty_factor = 0.10
risk_scaler = 1 + (win_streak * penalty_factor)
// Returns the new, harder-to-reach threshold
base_slope * risk_scaler
Module D: Trend Baseline (Triple-Smoothed Structure)
The Trend Baseline serves as the structural filter for all signals. It employs a Triple-Smoothed Hybrid Algorithm designed to balance lag reduction with noise filtration.
Smoothing Stages
1. Volatility Banding: Utilizes a SuperTrend-based calculation to establish the upper and lower boundaries of price action.
2. Weighted Filter: Applies a Weighted Moving Average (WMA) to prioritize recent price data.
3. Exponential Smoothing: A final Exponential Moving Average (EMA) pass is applied to create a seamless baseline curve.
Functionality
This "Heavy" baseline resists minor intraday volatility spikes while remaining responsive to sustained structural shifts. A signal is only considered valid if the price action maintains structural integrity relative to this baseline
🚦 Chapter 3: Risk Management & Exit Protocols
Quantitative Risk Management (TP/SL & Trailing)
Foundational Architecture: Volatility-Adjusted Geometry Unlike strategies relying on static nominal values, Impulse Reactor establishes dynamic risk boundaries derived from quantitative volatility metrics. This design aligns trade invalidation levels mathematically with the current market regime.
• ATR-Based Dynamic Bracketing:
The protocol calculates Stop-Loss and Take-Profit levels by applying Fibonacci coefficients (Default: 0.786 for SL / 1.618 for TP) to the Average True Range (ATR).
◦ High Volatility Environments: The risk bands automatically expand to accommodate wider variance, preventing premature exits caused by standard market noise.
◦ Low Volatility Environments: The bands contract to tighten risk parameters, thereby dynamically adjusting the Risk-to-Reward (R:R) geometry.
• Close-Validation Protocol ("Soft Stop"):
Institutional algorithms frequently execute liquidity sweeps—driving prices briefly below key support levels to accumulate inventory.
◦ Mechanism: When the "Soft Stop" feature is enabled, the system filters out intraday volatility spikes. The stop-loss is conditional; execution is triggered only if the candle closes beyond the invalidation threshold.
◦ Strategic Advantage: This logic distinguishes between momentary price wicks and genuine structural breakdowns, preserving positions during transient volatility.
• Step-Function Trailing Mechanism:
To protect unrealized PnL while allowing for normal price breathing, a two-phase trailing methodology is employed:
◦ Phase 1 (Activation): The trailing function remains dormant until the price advances by a pre-defined percentage threshold.
◦ Phase 2 (Dynamic Floor): Once armed, the stop level creates a moving floor, adjusting relative to price action while maintaining a volatility-based (ATR) buffer to systematically protect unrealized PnL.
• Algorithmic Exit Protocols (Dynamic Liquidity Analysis)
◦ Rationale: Inefficiencies of Static Targets Static "Take Profit" levels often result in suboptimal exits. They compel traders to close positions based on arbitrary figures rather than evolving market structure, potentially capping upside during significant trends or retaining positions while the underlying trend structure deteriorates.
◦ Solution: Structural Integrity Assessment The system utilizes a Dynamic Liquidity Engine to continuously audit the validity of the position. Instead of targeting a specific price point, the algorithm evaluates whether the trend remains statistically robust.
Multi-Factor Exit Logic (The Tri-Vector System)
The Smart Exit protocol executes only when specific algorithmic invalidation criteria are met:
• 1. Momentum Exhaustion (Confluence Decay): The system monitors a 168-hour rolling average of the Confluence Score. A significant deviation below this historical baseline indicates momentum exhaustion, signaling that the driving force behind the trend has dissipated prior to a price reversal. This enables preemptive exits before a potential drawdown.
• 2. Statistical Over-Extension (Mean Reversion): Utilizing the core volatility logic, the system identifies instances where price deviates beyond 2.0 standard deviations from the mean. While the trend may be technically bullish, this statistical anomaly suggests a high probability of mean reversion (elastic snap-back), triggering a defensive exit to capitalize on peak valuation.
• 3. Oscillator Rejection (Immediate Pivot): To manage sudden V-shaped volatility, the system monitors RSI pivots. If a sharp "Pivot High" or divergence is detected, the protocol triggers an immediate "Peak Exit," bypassing standard trend filters to secure liquidity during high-velocity reversals.
🎨 Chapter 4: Visualization Guide
Gradient Oscillator Ribbon
The 15-layer SMA ribbon visualized via plot(r1...r15) represents the "Momentum Density" of the market.
• Visuals:
◦ Cyan/Blue Ribbon: Indicates Bullish Momentum.
◦ Pink/Magenta Ribbon: Indicates Bearish Momentum.
• Interpretation:
◦ Laminar Flow: When the ribbon expands widely and flows in parallel, it signifies a robust trend where momentum is distributed evenly across timeframes. This is the ideal state for trend-following.
◦ Compression (Consolidation): If the ribbon becomes narrow, twisted, or knotted, it indicates a "Non-Tradable Zone" where the market lacks a unified direction. Traders are advised to wait for clarity.
◦ Over-Extension: If the top layer crosses the Overbought (85) or Oversold (15) lines, it visually warns of potential market overheating.
Trend Baseline
The thick, color-changing line plotted via plot(baseline) represents the Structural Backbone of the market.
• Visuals: Changes color based on the trend direction (Blue for Bullish, Pink for Bearish).
• Interpretation:
Structural Filter: Long positions are statistically favored only when price action sustains above this baseline, while short positions are favored below it.
Dynamic Support/Resistance: The baseline acts as a dynamic support level during uptrends and resistance during downtrends.
Entry Signals & Labels
Text labels ("Long Entry", "Short Entry") appear when the system detects high-probability setups grounded in quantitative confluence.
• Visuals: Labeled signals appear above/below specific candles.
• Interpretation:
These signals represent moments where Volatility (Expansion), Momentum (Alignment), and Structure (Trend) are synchronized.
Smart Exit: Labels such as "Smart Exit" or "Peak Exit" appear when the system detects momentum exhaustion or structural decay, prompting a defensive exit to preserve capital.
Dynamic TP/SL Boxes
The semi-transparent colored zones drawn via fill() represent the risk management geometry.
• Visuals: Colored boxes extending from the entry point to the Take Profit (TP) and Stop Loss (SL) levels.
• Function:
Volatility-Adjusted Geometry: Unlike static price targets, these boxes expand during high volatility (to prevent wicks from stopping you out) and contract during low volatility (to optimize Risk-to-Reward ratios).
SAR + MACD Glow
Small glowing shapes appearing above or below candles.
• Visuals: Triangle or circle glows near the price bars.
• Interpretation:
This visual indicates a secondary confirmation where Parabolic SAR and MACD align with the main trend direction. It serves as an additional confluence factor to increase confidence in the trade setup.
Support/Resistance Table
A small table located at the bottom-right of the chart.
• Function: Automatically identifies and displays recent Pivot Highs (Resistance) and Pivot Lows (Support).
• Interpretation: These levels can be used as potential targets for Take Profit or invalidation points for manual Stop Loss adjustments.
🖥️ Chapter 5: Dashboard & Operational Guide
Integrated Analytics Panel (Dashboard Overview)
To facilitate rapid decision-making without manual calculation, the system aggregates critical market dimensions into a unified "Heads-Up Display" (HUD). This panel monitors real-time metrics across multiple timeframes and analytical vectors.
A. Intermediate Structure (12H Trend)
• Function: Anchors the intraday analysis to the broader market structure using a 12-hour rolling window.
• Interpretation:
◦ Bullish (> +0.5%): Indicates a positive structural bias. Long setups align with the macro flow.
◦ Bearish (< -0.5%): Indicates structural weakness. Short setups are statistically favored.
◦ Neutral: Represents a ranging environment where the Confluence Score becomes the primary weighting factor.
B. Composite Confluence Score (Signal Confidence)
• Definition: A probability metric derived from the synchronization of Volatility (Impulse Core), Momentum (Ribbon), and Trend (Baseline).
• Grading Scale:
Strong Buy/Sell (> 7.0 / < 3.0): Indicates full alignment across all three vectors. Represents a "Prime Setup" eligible for standard position sizing.
Buy/Sell (5.0–7.0 / 3.0–5.0): Indicates a valid trend but with moderate volatility confirmation.
Neutral: Signals conflicting data (e.g., Bullish Momentum vs. Bearish Structure). Trading is not recommended ("No-Trade Zone").
C. Statistical Deviation Status (Mean Reversion)
• Logic: Utilizes Bollinger Band deviation principles to quantify how far price has stretched from the statistical mean (20 SMA).
• Alert States:
Over-Extended (> 2.0 SD): Warning that price is statistically likely to revert to the mean (Elastic Snap-back), even if the trend remains technically valid. New entries are discouraged in this zone.
Normal: Price is within standard distribution limits, suitable for trend-following entries.
D. Volatility Regime Classification
• Metric: Compares current ATR against a 100-period historical baseline to categorize the market state.
• Regimes:
Low Volatility (Lvl < 1.0): Market Compression. Often precedes volatility expansion events.
Mid Volatility (Lvl 1.0 - 1.5): Standard operating environment.
High Volatility (Lvl > 1.5): Elevated market stress. Risk parameters should be adjusted (e.g., reduced position size) to account for increased variance.
E. Performance Telemetry
• Function: Displays the historical reliability of the Trend Baseline for the current asset and timeframe.
• Operational Threshold: If the displayed Win Rate falls below 40%, it suggests the current market behavior is incoherent (choppy) and does not respect trend logic. In such cases, switching assets or timeframes is recommended.
Operational Protocols & Signal Decoding
Visual Interpretation Standards
• Laminar Flow (Trade Confirmation): A valid trend is visually confirmed when the 15-layer SMA Ribbon is fully expanded and parallel. This indicates distributed momentum across timeframes.
• Consolidation (No-Trade): If the ribbon appears twisted, knotted, or compressed, the market lacks a unified directional vector.
• Baseline Interaction: The Triple-Smoothed Baseline acts as a dynamic support/resistance filter. Long positions remain valid only while price sustains above this structure.
System Calibration (Settings)
• Adaptive Signal Filtering (Prev. Anti-Greed): Enabled by default. This logic automatically raises the required trend slope threshold following consecutive wins to mitigate behavioral bias.
• Impulse Sensitivity: Controls the reactivity of the Volatility Core. Higher settings capture faster moves but may introduce more noise.
⚙️ Chapter 6: System Configuration & Alert Guide
This section provides a complete breakdown of every adjustable setting within Impulse Reactor to assist you in tailoring the engine to your specific needs.
🌐 LANGUAGE SETTINGS (Localization)
◦ Select Language (Default: English):
Function: Instantly translates all chart labels, dashboard texts into your preferred language.
Supported: English, Korean, Chinese, Spanish
⚡ IMPULSE CORE SETTINGS (Volatility Engine)
◦ Deviation Lookback (Default: 30): The period used to calculate the standard deviation of volatility.
Role: Sets the baseline for normalizing momentum. Higher values make the core smoother but slower to react.
◦ Fast Pulse Length (Default: 10): The short-term ATR period.
Role: Detects rapid volatility expansion.
◦ Slow Pulse Length (Default: 30): The long-term ATR baseline.
Role: Establishes the background volatility level. The core signal is derived from the divergence between Fast and Slow pulses.
🎯 TP/SL SETTINGS (Risk Management)
◦ SL/TP Fibonacci (Default: 0.786 / 1.618): Selects the Fibonacci ratio used for risk calculation.
◦ SL/TP Multiplier (Default: 1.5 / 2): Applies a multiplier to the ATR-based bands.
Role: Expands or contracts the Take Profit and Stop Loss boxes. Increase these values for higher volatility assets (like Altcoins) to avoid premature stop-outs.
◦ ATR Length (Default: 14): The lookback period for calculating the Average True Range used in risk geometry.
◦ Use Soft Stop (Close Basis):
Role: If enabled, Stop Loss alerts only trigger if a candle closes beyond the invalidation level. This prevents being stopped out by wick manipulations.
🔊 RIBBON SETTINGS (Momentum Visualization)
◦ Show SMA Ribbon: Toggles the visibility of the 15-layer gradient ribbon.
◦ Ribbon Line Count (Default: 15): The number of SMA lines in the ribbon array.
◦ Ribbon Start Length (Default: 2) & Step (Default: 1): Defines the spread of the ribbon.
Role: Controls the "thickness" of the momentum density visualization. A wider step creates a broader ribbon, useful for higher timeframes.
📎 DISPLAY OPTIONS
◦ Show Entry Lines / TP/SL Box / Position Labels / S/R Levels / Dashboard: Toggles individual visual elements on the chart to reduce clutter.
◦ Show SAR+MACD Glow: Enables the secondary confirmation shapes (triangles/circles) above/below candles.
📈 TREND BASELINE (Structural Filter)
◦ Supertrend Factor (Default: 12) & ATR Period (Default: 90): Controls the sensitivity of the underlying Supertrend algorithm used for the baseline calculation.
◦ WMA Length (40) & EMA Length (14): The smoothing periods for the Triple-Smoothed Baseline.
◦ Min Trend Duration (Default: 10): The minimum number of bars the trend must be established before a signal is considered valid.
🧠 SMART EXIT (Dynamic Liquidity)
◦ Use Smart Exit: Enables the momentum exhaustion logic.
◦ Exit Threshold Score (Default: 3): The sensitivity level for triggering a Smart Exit. Lower values trigger earlier exits.
◦ Average Period (168) & Min Hold Bars (5): Defines the rolling window for momentum decay analysis and the minimum duration a trade must be held before Smart Exit logic activates.
🛡️ TRAILING STOP (Step)
◦ Use Trailing Stop: Activates the step-function trailing mechanism.
◦ Step 1 Activation % (0.5) & Offset % (0.5): The price must move 0.5% in your favor to arm the first trail level, which sets a stop 0.5% behind price.
◦ Step 2 Activation % (1) & Offset % (0.2): Once price moves 1%, the trail tightens to 0.2%, securing the position.
🌀 SAR & MACD SETTINGS (Secondary Confirmation)
◦ SAR Start/Increment/Max: Standard Parabolic SAR parameters.
◦ SAR Score Scaling (ATR): Adjusts how much weight the SAR signal has in the overall confluence score.
◦ MACD Fast/Slow/Signal: Standard MACD parameters used for the "Glow" signals.
🔄 ANTI-GREED LOGIC (Behavioral Bias)
◦ Strict Entry after Win: Enables the negative feedback loop.
◦ Strict Multiplier (Default: 1.1): Increases the entry difficulty by 10% after each win.
Role: Prevents overtrading and entering at the top of an extended trend.
🌍 HTF FILTER (Multi-Timeframe)
◦ Use Auto-Adaptive HTF Filter: Automatically selects a higher timeframe (e.g., 1H -> 4H) to filter signals.
◦ Bypass HTF on Steep Trigger: Allows an entry even against the HTF trend if the local momentum slope is exceptionally steep (catch powerful reversals).
📉 RSI PEAK & CHOPPINESS
◦ RSI Peak Exit (Instant): Triggers an immediate exit if a sharp RSI pivot (V-shape) is detected.
◦ Choppiness Filter: Suppresses signals if the Choppiness Index is above the threshold (Default: 60), indicating a flat market.
📐 SLOPE TRIGGER LOGIC
◦ Force Entry on Steep Slope: Overrides other filters if the price angle is extremely vertical (high velocity).
◦ Slope Sensitivity (1.5): The angle required to trigger this override.
⛔ FLAT MARKET FILTER (ADX & ATR)
◦ Use ADX Filter: Blocks signals if ADX is below the threshold (Default: 20), indicating no trend.
◦ Use ATR Flat Filter: Blocks signals if volatility drops below a critical level (dead market).
🔔 Alert Configuration Guide
Impulse Reactor is designed with a comprehensive suite of alert conditions, allowing you to automate your trading or receive real-time notifications for specific market events.
How to Set Up:
Click the "Alert" (Clock) icon in the TradingView toolbar.
Select "Impulse Reactor " from the Condition dropdown.
Choose one of the specific trigger conditions below:
🚀 Entry Signals (Trend Initiation)
Long Entry:
Trigger: Fires when a confirmed Bullish Setup is detected (Momentum + Volatility + Structure align).
Usage: Use this to enter new Long positions.
Short Entry:
Trigger: Fires when a confirmed Bearish Setup is detected.
Usage: Use this to enter new Short positions.
🎯 Profit Taking (Target Levels)
Long TP:
Trigger: Fires when price hits the calculated Take Profit level for a Long trade.
Usage: Automate partial or full profit taking.
Short TP:
Trigger: Fires when price hits the calculated Take Profit level for a Short trade.
Usage: Automate partial or full profit taking.
🛡️ Defensive Exits (Risk Management)
Smart Exit:
Trigger: Fires when the system detects momentum decay or statistical exhaustion (even if the trend hasn't fully reversed).
Usage: Recommended for tightening stops or closing positions early to preserve gains.
Overbought / Oversold:
Trigger: Fires when the ribbon extends into extreme zones.
Usage: Warning signal to prepare for a potential reversal or pullback.
💡 Secondary Confirmation (Confluence)
SAR+MACD Bullish:
Trigger: Fires when Parabolic SAR and MACD align bullishly with the main trend.
Usage: Ideal for Pyramiding (adding to an existing winning position).
SAR+MACD Bearish:
Trigger: Fires when Parabolic SAR and MACD align bearishly.
Usage: Ideal for adding to short positions.
⚠️ Chapter 7: Conclusion & Risk Disclosure
Methodological Synthesis
Impulse Reactor represents a shift from reactive price tracking to proactive energy analysis. By decomposing market activity into its atomic components — Volatility, Momentum, and Structure — and reconstructing them into a coherent decision model, the system aims to provide a quantitative framework for market engagement. It is designed not to predict the future, but to identify high-probability conditions where kinetic energy and trend structure align.
Disclaimer & Risk Warnings
◦ Educational Purpose Only
This indicator, including all associated code, documentation, and visual outputs, is provided strictly for educational and informational purposes. It does not constitute financial advice, investment recommendations, or a solicitation to buy or sell any financial instruments.
◦ No Guarantee of Performance
Past performance is not indicative of future results. All metrics displayed on the dashboard (including "Win Rate" and "P&L") are theoretical calculations based on historical data. These figures do not account for real-world trading factors such as slippage, liquidity gaps, spread costs, or broker commissions.
◦ High-Risk Warning
Trading cryptocurrencies, futures, and leveraged financial products involves a substantial risk of loss. The use of leverage can amplify both gains and losses. Users acknowledge that they are solely responsible for their trading decisions and should conduct independent due diligence before executing any trades.
◦ Software Limitations
The software is provided "as is" without warranty. Users should be aware that market data feeds on analysis platforms may experience latency or outages, which can affect signal generation accuracy.
Médias Móveis

Bli-Rik : Trend + HTF 34 + HTF RSI Rel + Stoch Filtersprovides you accurate buy and sell signals on 5 mins and 15 mins chart, mainly foe sensex

YSR TRIDENT FX - Smoothed Heiken Ashi Candles – 🧿 What This Indicator Does
This indicator plots Smoothed Heiken Ashi Candles with a custom vertical offset, allowing traders to view both:
Regular price candles
Smoothed Heiken Ashi trend candles
side-by-side without overlapping.
Traditional Heiken Ashi candles can hide real price movement.
This version solves that by adding double smoothing + adjustable spacing, giving crystal-clear trend visualization while preserving real market structure.
🔥 Key Features
✅ 1. Dual EMA Smoothing
The script applies smoothing twice:
First smoothing: EMA applied on OHLC
Second smoothing: EMA applied on Heiken Ashi values
This creates ultra-clean trend candles with reduced noise.
✅ 2. Adjustable Vertical Distance (Offset)
Control how far Smoothed HA candles appear from regular candles.
Great for:
Scalpers
Price Action traders
No overlap → cleaner market structure.
✅ 3. Accurate Heiken Ashi Formula
Uses:
HA Close = Average of smoothed OHLC
HA Open = Previous HA Open + Previous HA Close / 2
HA High / Low = True trend-based levels
🌈 Color Coding
Green → Bullish Trend
Red → Bearish Trend
(The colors follow the smoothed structure, not raw candles.)
✔️ Best Used For
Trend following
Reversal filtering
Identifying clean directional bias
Removing noise from volatile markets
⭐ Recommended Settings
Length 1: 9
Length 2: 9
Vertical Distance: 0
These create a smooth but responsive Heiken Ashi display.

5-RSI HighSrc Buy/SellBest used on the 5 min chart, this indicator detects early intraday momentum reversals that occur within an alread-bullish trend using (source = high) RSI lengths 5, 8, 13, 21, & 34. This is primarily designed to catch the moment an uptrend resumes after a dip.

Daily 9 SMA S/R with Std DevThis indicator plots the Daily 9 Simple Moving Average as dynamic support/resistance on any timeframe, with standard deviation bands to measure trend strength and identify overextended price action.
━━━━━━━━━━━━━━━━━━━━━━
HOW IT WORKS
━━━━━━━━━━━━━━━━━━━━━━
The Daily 9 SMA acts as a key level institutions watch. When price is above it, bullish bias. Below it, bearish bias. Simple.
Standard deviation bands show you:
- 1 StdDev = Strong trend territory
- 2 StdDev = Extreme/overextended - potential reversal zone
━━━━━━━━━━━━━━━━━━━━━━
FEATURES
━━━━━━━━━━━━━━━━━━━━━━
- Daily 9 SMA plotted on any timeframe
- 1 & 2 Standard Deviation bands
- Trend strength scoring (-3 to +3)
- Info table showing current values and trend status
- Visual signals for MA reclaims, losses, and trend entries
━━━━━━━━━━━━━━━━━━━━━━
ALERTS
━━━━━━━━━━━━━━━━━━━━━━
- Price Reclaims Daily 9 SMA
- Price Loses Daily 9 SMA
- Enter Strong Bullish Zone (>1 StdDev)
- Enter Strong Bearish Zone (<1 StdDev)
- Extreme Extension Alerts (2 StdDev)
- Bounce/Rejection at MA
━━━━━━━━━━━━━━━━━━━━━━
HOW TO USE
━━━━━━━━━━━━━━━━━━━━━━
1. Use on lower timeframes (5m, 15m, 1H) to see Daily levels
2. Look for bounces off the Daily 9 SMA for entries
3. Avoid longs when price loses the MA, avoid shorts when price reclaims
4. Use StdDev bands to gauge when price is overextended
━━━━━━━━━━━━━━━━━━━━━━
SETTINGS
━━━━━━━━━━━━━━━━━━━━━━
- MA Length - Default 9
- StdDev Multipliers - Default 1.0 and 2.0
- StdDev Lookback - Default 20
- Customizable colors
Works on any market - Forex, Crypto, Stocks, Futures.

YSR TRIDENT FX - Smoothed Heiken Ashi Candles – Offset Version🧿 What This Indicator Does
This indicator plots Smoothed Heiken Ashi Candles with a custom vertical offset, allowing traders to view both:
Regular price candles
Smoothed Heiken Ashi trend candles
side-by-side without overlapping.
Traditional Heiken Ashi candles can hide real price movement.
This version solves that by adding double smoothing + adjustable spacing, giving crystal-clear trend visualization while preserving real market structure.
🔥 Key Features
✅ 1. Dual EMA Smoothing
The script applies smoothing twice:
First smoothing: EMA applied on OHLC
Second smoothing: EMA applied on Heiken Ashi values
This creates ultra-clean trend candles with reduced noise.
✅ 2. Adjustable Vertical Distance (Offset)
Control how far Smoothed HA candles appear from regular candles.
Great for:
Scalpers
Price Action traders
educators (clean charts)
No overlap → cleaner market structure.
✅ 3. Accurate Heiken Ashi Formula
Uses:
HA Close = Average of smoothed OHLC
HA Open = Previous HA Open + Previous HA Close / 2
HA High / Low = True trend-based levels
Fully compatible with all markets and timeframes.
🌈 Color Coding
Green → Bullish Trend
Red → Bearish Trend
(The colors follow the smoothed structure, not raw candles.)
✔️ Best Used For
Trend following
Reversal filtering
Identifying clean directional bias
Removing noise from volatile markets
⭐ Recommended Settings
Length 1: 9
Length 2: 9
Vertical Distance: 0.3% to 1%

BTC Macro Trend Framework by ZecheColor Indicator Meaning
🟩 Green Pi Cycle 355 SMA ×2 Long-term macro line (cyclical tops)
🔴 Red Pi Cycle 114 SMA Fast line (Pi Cycle signals)
🟧 Orange EMA 50W Mid-term trend
🔵 Blue EMA 200W Long-term macro bottom / key trend
🟪 Purple SuperTrend Short-term trend / momentum

Multi EMA (10)Allows you to add and configure up to 10 EMAs to your chart with a single indicator. Enjoy.

Copper_to_Gold_Ratio by Zeche Cu/Au Ratio – LINES + LABELS is a clean, macro-oriented indicator built around the Copper/Gold price ratio — a well-known gauge of economic strength, market sentiment, and shifts between risk-taking and risk-aversion.
The script calculates:
the 120-day SMA of the Copper/Gold ratio
the standard deviation over the same period
the ±1σ, ±1.5σ, and ±2σ deviation bands
automatic labels on the last bar for maximum clarity
The design is minimalistic and visually optimized so users can quickly understand where the current ratio sits relative to long-term norms. The deviation zones help highlight moments when the market transitions into RISK-ON or RISK-OFF behavior.
How to interpret the signals:
Above +2σ → RISK-OFF environment (defensive tone, macro stress)
Below −2σ → RISK-ON environment (increased risk appetite)
±1σ bands represent normal cyclical movements
The SMA acts as the long-term equilibrium level

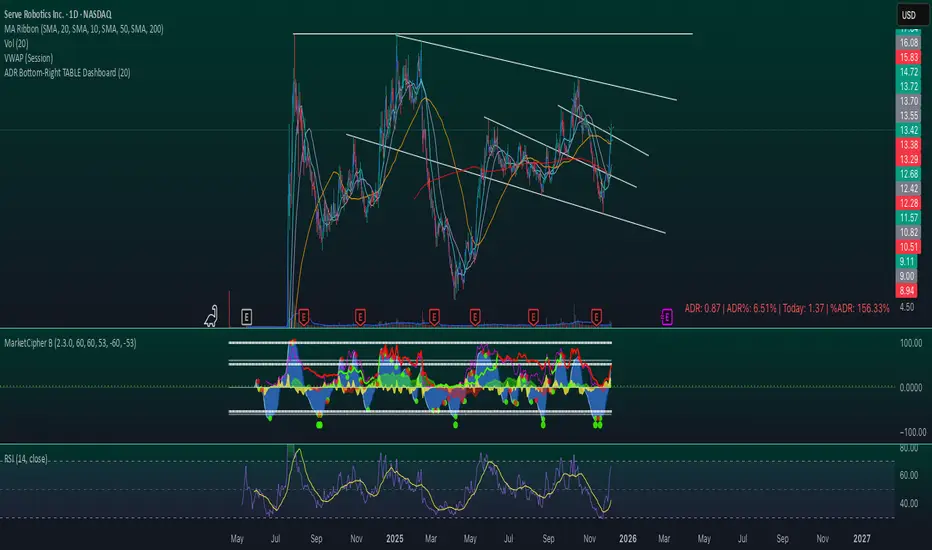
ADR Bottom-Right TABLE DashboardTitle: ADR Bottom-Right Dashboard
Version: 1.0
Author:
Description:
The ADR Bottom-Right Dashboard displays the Average Daily Range (ADR) and related metrics directly on your chart in a compact, easy-to-read table. It helps traders quickly see how much a stock has moved today relative to its normal daily range and identify potential overextended or trending moves.
This tool is ideal for swing traders, day traders, and scalpers who want a real-time, visual indication of volatility and intraday movement.
Features
ADR (Average Daily Range): Shows the average high-to-low movement over a customizable period (default 20 days).
ADR%: ADR as a percentage of the stock price, showing relative volatility.
Today: The current intraday range (high–low).
%ADR: How much of the ADR has already been reached today. Color-coded to indicate low, medium, or high extension.
Color coding: %ADR highlights:
Green: <50% (early-day / low volatility)
Yellow: 50–100% (normal movement)
Red: >100% (extended move / potential exhaustion)
Inputs
Input Description Default
ADR Period Number of days to calculate the ADR 20
Low %ADR Color Color for %ADR <50% Green
Medium %ADR Color Color for %ADR 50–100% Yellow
High %ADR Color Color for %ADR >100% Red
FXD Volume Moving AverageFXDVolMA is a non-repainting, color-coded moving average that highlights when price action is supported by meaningful volume.
How It Works
The indicator measures volume strength by comparing current volume to its historical behaviour.
You can choose between four volume models: SMA Ratio, EMA Ratio, Z-Score, or Range 0–1.
The volume strength is smoothed to reduce noise.
A regime system (hysteresis) prevents color flickering and keeps transitions clean and stable.
The selected MA (SMA/EMA/WMA/RMA/HMA/VWMA) is then coloured based on volume conditions:
Colour Meaning
🟢 Green — Strong Volume
Price moves have participation behind them; higher-quality trading conditions.
🟡 Yellow — Neutral Volume
Volume is average; price is either already trending or weakening, wait for clarity or trend confirmation.
🔴 Red — Low Volume
Weak participation; avoid trading low-quality moves.
Purpose
FXDVolMA makes it easy to see whether the market is moving with conviction.
Use green periods to prioritize entries and avoid red environments where moves are unreliable.
When the MA turns green, it signals volume being present and good trading opportunities.
When the MA turns yellow, price is either already trending and volume weakens or the trend is coming to an end.
When the MA turns red, the volume is weak and price will most likely retrace, not ideal to trade.
Green = best entries
Yellow = good entries (or continuations if already in the trade)
Red = wait for retracement or volume
Checkout Instagrma @FXDSniper for more indicators and free education.


Aydan Scalper v2This indicator, called the Aydan Scalper, combines an 8-period EMA (plotted in green) and a 20-period EMA (plotted in red) to identify buy and sell signals based on their crossovers. When the green 8 EMA crosses above the red 20 EMA from below, it signals a buy opportunity. Conversely, when the green 8 EMA crosses below the red 20 EMA from above, it signals a sell opportunity. Additionally, an ATR (Average True Range) indicator is included to gauge market volatility. This combination helps scalpers make informed trading decisions on a one-minute chart.”

Confluence Retournement Haussier - Ultimate V1This indicator was originally designed to visualize the right moment to enter a position. I buy stocks when they are falling, at the bottom before they rebound.
The 30‑minute chart with its 100 EMA was used as the baseline, but it can be applied to multiple timeframes. I even used it on a 1‑second chart for a ticker, and when there is volume it works wonderfully.
It’s up to you to check whether it fits the ticker you’re analyzing by testing it on historical data.
Drawback: it takes up screen space. Feel free to improve it.
See a ticker in freefall and wonder whether it’s a good time to buy or if it will keep falling? Switch your chart to 30 minutes and watch for triangles and green circles to start appearing.
You could call it momentum. Your background begins to show color when there is confluence. If it stays black, don’t buy.
Already in the trade and the screen turns black? Sell, and wait for the colors to return before buying back in

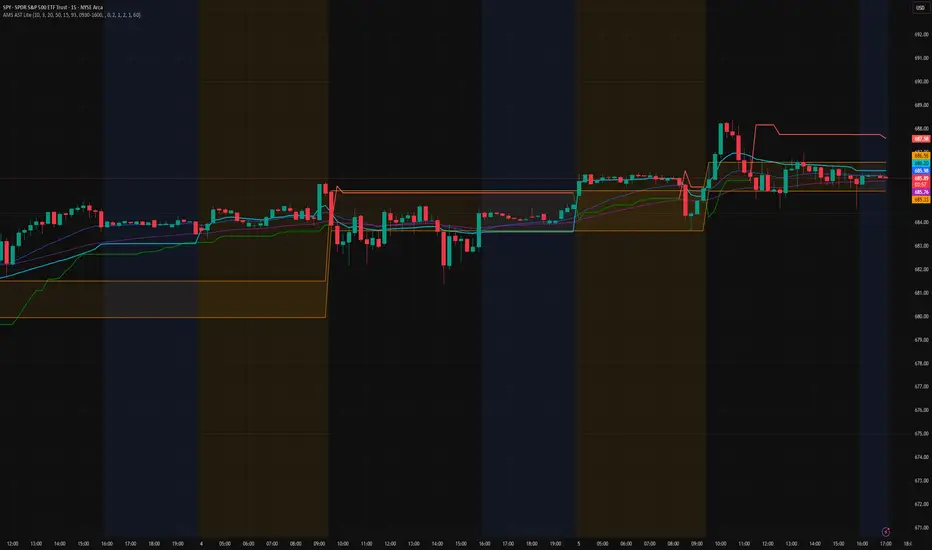
AMS Adaptive Supertrend Lite – ORB + VWAP 1.0AMS Adaptive Supertrend Lite – ORB + VWAP
This indicator focuses on providing a clean read of trend, structure, and opening range context without unnecessary complexity. It’s designed for traders who prefer straightforward visual tools that support their own decision-making process.
Consider this a small multi-tool for your basic ORB needs.
Included:
-Supertrend
A simple ATR-based Supertrend for directional context.
You can edit colors, line width, ATR settings, etc.
No signals or automation, just a clear trend reference.
-EMAs
Optional fast and slow EMAs for structural context.
Useful for gauging short-term momentum and slope.
-VWAP
A standard session VWAP.
You can style it however you like (solid, dashed, colored) in the Style tab.
-Opening Range (ORB)
Configurable ORB band including:
ORB duration (in minutes)
Optional RTH-only logic
Adjustable session window
Choice of timeframe used to build the ORB
Automatic hiding on higher timeframes (optional)
The ORB high/low are built on the selected lower timeframe and then displayed on the active chart.
-HTF Bias Shading (Optional)
A simple background tint based on EMA structure on a higher timeframe.
Meant to give gentle context, not trading signals.
Alerts
Two alerts are included:
Supertrend flipping bullish
Supertrend flipping bearish
These are notifications, not calls to action.
Intended Use
This is a visual tool for traders who want clear structure and context on their chart.
It does not provide entries, exits, strategies, or automated logic.
Disclaimer
This script is for educational and informational purposes only.
It is not financial advice, and no performance is guaranteed.
Always test tools for yourself and use proper risk management.
Aydan Scalper 2This indicator, called the Aydan Scalper, combines an 8-period EMA (plotted in green) and a 20-period EMA (plotted in red) to identify buy and sell signals based on their crossovers. When the green 8 EMA crosses above the red 20 EMA from below, it signals a buy opportunity. Conversely, when the green 8 EMA crosses below the red 20 EMA from above, it signals a sell opportunity. Additionally, an ATR (Average True Range) indicator is included to gauge market volatility. This combination helps scalpers make informed trading decisions on a one-minute chart.”
Trade Pivot ProEnglish (required first):
Trade Pivot Pro is a comprehensive indicator that combines advanced Pivot Point calculations, Moving Averages (SMA & EMA), ATR-based volatility bands, time cycle logic, and customizable alerts.
Key Features
Pivot Points: Multiple calculation methods (Traditional, Fibonacci, Woodie, Classic, DM, Camarilla).
Flexible Time Cycles: Automatic pivot anchoring based on chart timeframe, plus manual options (Daily, Weekly, Monthly, Quarterly, Yearly, Bi-yearly, Tri-yearly, Quinquennial, Decennial).
Moving Averages: Four configurable SMA/EMA lines (21, 50, 100, 200 periods) with slope detection.
ATR Bands: Dynamic upper and lower bands plotted around price to visualize volatility.
Alerts:
MA slope changes (Up/Down).
Pivot + 200 SMA trend confirmation.
ATR volatility threshold (High/Low).
Combined Pivot + SMA + ATR strong trend alerts.
Time Cycles
Chart Timeframe Pivot Timeframe
10s 15 minutes
1m 1 hour
5m 4 hours
15m 1 day
1h 1 week
4h 1 week
1D 1 month
1W 3 months
1M 1 year
This indicator helps traders identify trend direction, volatility conditions, time cycles, and key support/resistance levels in one unified tool. It is suitable for intraday and higher timeframes, with options to use daily-based or intraday pivot values.
Note: This script is free of advertisements and intended purely for educational and trading analysis purposes.

Multiple Moving Averages by BadshahIntroduction Streamline your technical analysis with the Quintuple MA Strategy Suite, a robust all-in-one utility designed to maximize chart efficiency. Instead of cluttering your workspace with multiple individual indicators, this script empowers you to deploy up to five fully customizable Moving Averages simultaneously. Whether you are tracking micro-trends for scalping or major baselines for swing trading, this tool adapts to every timeframe and style.
Core Features
5-in-1 Architecture: Run five independent moving averages at once, saving your precious indicator slots for other tools.
Hybrid Calculation Modes: Instantly toggle any line between Simple Moving Average (SMA) for smooth baselines and Exponential Moving Average (EMA) for weight-sensitive reactions to recent price action.
Smart labeling System: Features an intelligent labeling mechanism that places text tags slightly offset from the current price. This ensures you can instantly identify which line is which (e.g., "EMA 50" vs "SMA 200") without the text obscuring the latest candles.
Granular Control: Every aspect is customizable. You can independently adjust the Length, Source (Close, Open, High, Low, etc.), Color, and Visibility for each of the five MAs.
Practical Use Cases
The "Golden Cross" Setup: Enable MA 3 (50 Length) and MA 5 (200 Length) to automatically visually track major trend reversals.
Ribbon Trading: Enable all five lines with sequential lengths (e.g., 20, 50, 100, 150, 200) to create a "Moving Average Ribbon," visualizing the strength and direction of the trend expansion.
Scalping Cross: Use MA 1 and MA 2 set to fast lengths (like 9 and 21) to catch rapid momentum shifts.
Settings Guide
Show MA: Toggles the visibility of the specific line.
Show Label: Toggles the text tag next to the line (auto-offset by 5 bars).
Type: Select between SMA or EMA calculation.
Length: Define the lookback period for the average.
Disclaimer This script is provided for educational and analytical purposes only. Past performance of indicators does not guarantee future results. Trade responsibly.

Yin and Yang Trading Strategy Yin and Yang Trading Strategy: An Educational Overview
The "Yin and Yang" trading strategy embodies the balance and duality of the yin-yang philosophy, representing both harmony and opposition within the market. In this strategy, like the two complementary forces of yin (bearish) and yang (bullish), opposing trends are monitored to create balance through careful entries and exits in trades. Let's break down how this strategy works and the key indicators involved.
1. The Yin and Yang Analogy
In the same way that yin and yang coexist to form a whole, this strategy seeks to balance two critical market elements: price momentum and volatility. The yin (bearish side) represents a slowing or declining market, while the yang (bullish side) symbolizes growth and upward movement. The strategy uses the market's inherent volatility and trend to guide entries and exits, ensuring that trades follow the flow, just as yin and yang flow into each other.
2. Key Indicators Involved
The Yin and Yang strategy is built around the following key technical indicators:
ATR (Average True Range): This measures market volatility. The higher the ATR, the greater the market's volatility. In this strategy, ATR helps define the range of movement the price can make before a position should be closed or opened. The input "ATR Period" sets the window for ATR calculation, allowing users to adjust the sensitivity to market movements.
Heikin Ashi Candles: These modified candlesticks smooth out price action, making it easier to identify trends. Instead of using traditional open-high-low-close data, Heikin Ashi candles are calculated differently to better capture the overall market direction, reducing noise. The user can switch between regular candles and Heikin Ashi candles based on preference.
EMA (Exponential Moving Average): The EMA helps smooth out price data to create a trend-following indicator. This is particularly useful in detecting crossovers with the ATR trailing stop, signaling potential buy and sell opportunities.
3. The Specific Strategy
The strategy revolves around using an ATR trailing stop to follow price movements and enter or exit trades based on volatility and trend strength. Here's how it works:
ATR Trailing Stop: The system calculates a trailing stop based on the ATR value multiplied by a user-defined key value (input "a"). This trailing stop adjusts dynamically as the market moves, providing a stop level that tracks the current trend.
Position Direction: When the price moves above the ATR trailing stop, the strategy signals a buy (long position). Conversely, when the price drops below the ATR trailing stop, the strategy signals a sell (short position). This ensures you're always trading with the trend, respecting the balance of yin and yang in the market.
Entry and Exit: Buy and sell conditions are determined by comparing the price to the ATR trailing stop. Additionally, crossovers between the ATR trailing stop and EMA further confirm trend reversals, providing clear signals for entering or exiting trades.
4. Best Practices for Trading the Yin and Yang Strategy
Tune the ATR Sensitivity: Adjust the "Key Value" input (a) to control how sensitive the ATR trailing stop is to market movements. A higher value will result in a wider trailing stop, suitable for high-volatility markets, while a lower value tightens the stop for low-volatility conditions.
Use Heikin Ashi for Clarity: If the market seems noisy, use Heikin Ashi candles to smooth out price action and get a clearer view of trends. This can be particularly useful in choppy or sideways markets.
Align with Market Volatility: Monitor the ATR closely. In periods of high volatility, expect larger price swings, and adjust your trailing stop accordingly to avoid being prematurely stopped out.
Stick to the Plan: As with any strategy, consistency is key. The Yin and Yang strategy works best when you adhere to the buy and sell signals without second-guessing, just like maintaining balance in the philosophy of yin and yang.
This strategy offers a clear framework for balancing market trends and volatility, helping traders find harmony in their trading decisions.
Join our RoseTree Investing Community: skool.com/rosetree
Enhance your trading journey by joining our FREE community where you’ll gain access to exclusive content, live trading sessions, and advanced strategies from leading crypto experts.
Trend with ADX, multiple EMAs - Buy & Sell✔ Trend Direction
Via DI+ > DI–
✔ Trend Strength
Via ADX
✔ Fast Entry Signals
5/8 EMA crossovers
✔ Larger Trend Confirmation
13/48 EMA crossovers
✔ Macro Trend
EMA 200
✔ Intraday Bias
VWAP
✔ Visual Trend (background)
✔ Alerts for signals + trend shifts

DarkPool FlowDarkPool Flow is a professional-grade technical analysis tool designed to align retail traders with the dominant "smart money" flow. Unlike standard moving average crossovers that often generate false signals during consolidation, this script employs a multi-layered filtering engine to isolate high-probability trends.
The core philosophy of this indicator is that Trends are fractal. A sustainable move on a lower timeframe must be supported by momentum on a higher timeframe. By comparing a "Fast Signal Trend" against a "Slow Anchor Trend" (e.g., Daily vs. Weekly), the script identifies the market bias used by institutional algorithms.
This edition features a Smart Recovery Engine, ensuring that valid trends are not missed simply because momentum started slowly, and a Dynamic Cloud that visually represents the strength of the trend spread.
Key Features
1. Auto-Adaptive Timeframe Logic
The script eliminates the guesswork of Multi-Timeframe (MTF) selection. By enabling "Auto-Adapt," the indicator detects your current chart timeframe and automatically maps it to the mathematically correct institutional pairings:
Scalping (<15m): Uses 15-Minute Trend vs. 1-Hour Anchor.
Day Trading (15m - 1H): Uses 4-Hour Trend vs. Daily Anchor.
Swing Trading (4H - Daily): Uses Daily Trend vs. Weekly Anchor (The classic "Golden" setup).
Investing (Weekly): Uses 21-Week EMA vs. 50-Week SMA (Bull Market Support Band logic).
2. Smart Recovery Signal Engine
Standard crossover scripts often miss major moves if the specific breakout candle has low volume or weak ADX. This script utilizes a state-machine logic that "remembers" the trend direction. If a trend begins during low volatility (gray candles), the script waits. The moment volatility and momentum confirm the move, a Smart Recovery Signal is triggered, allowing you to enter an existing trend safely.
3. Chop Protection (Gray Candles)
Preservation of capital is the priority. The script analyzes the Average Directional Index (ADX) and Volatility (ATR).
Colored Candles (Green/Red): The market is trending with sufficient strength. Trading is permitted.
Gray Candles: The market is in a low-energy chop or consolidation (ADX < 20). Trading is discouraged.
4. Dynamic Trend Cloud
The space between the Fast and Slow trends is filled with a dynamic cloud.
Darker/Opaque Cloud: Indicates a widening spread, suggesting accelerating momentum.
Lighter/Transparent Cloud: Indicates a narrowing spread, suggesting the trend may be weakening or consolidating.
5. Pullback & Retest Signals (+)
While triangles mark the start of a trend, the Plus (+) signs mark low-risk opportunities to add to a position. These appear when price dips into the cloud, finds support at the "Fair Value" zone, and closes back in the direction of the trend with confirmed momentum.
User Guide & Strategy
Setup
Add the indicator to your chart.
For Beginners: Enable "Auto-Adaptive Timeframes" in the settings.
For Advanced Users: Disable Auto-Adapt and manually configure your Fast/Slow pairings (Default is Daily 50 EMA / Weekly 50 EMA).
Signal Mode: Choose "First Breakout Only" for a cleaner chart, or "All Signals" if you wish to see re-entry points during choppy starts.
Long Entry Criteria (Buy)
Trend: The Cloud must be Green (Fast Trend > Slow Trend).
Signal: A Green Triangle appears below the bar.
Confirmation: The signal candle must not be Gray.
Re-Entry: A small Green (+) sign appears, indicating a successful test of the cloud support.
Short Entry Criteria (Sell)
Trend: The Cloud must be Red (Fast Trend < Slow Trend).
Signal: A Red Triangle appears above the bar.
Confirmation: The signal candle must not be Gray.
Re-Entry: A small Red (+) sign appears, indicating a successful test of the cloud resistance.
Stop Loss & Risk Management
Stop Loss: A standard institutional stop loss is placed just beyond the Slow Trend Line (the outer edge of the cloud). If price closes beyond the Slow Trend, the macro thesis is invalid.
Take Profit: Target liquidity pools or use a trailing stop based on the Fast Trend line.
Settings Overview
Mode Selection: Toggle between Auto-Adaptive logic or Manual control.
Manual Configuration: Define the specific Timeframe, Length, and Type (EMA, SMA, WMA) for both Fast and Slow trends.
Signal Logic: Toggle "Show Pullback Signals" on/off. Switch between "First Breakout" or "All Signals."
Quality Filters: Toggle individual filters (ATR, RSI, ADX) to adjust sensitivity. Turning these off makes the script more responsive but increases false signals.
Visual Style: Customize colors for Bullish, Bearish, and Neutral (Gray) states. Adjust cloud transparency.
Disclaimer
Risk Warning: Trading financial markets involves a high degree of risk and is not suitable for all investors. You could lose some or all of your initial investment.
Educational Use Only: This script and the information provided herein are for educational and informational purposes only. They do not constitute financial advice, investment advice, trading advice, or any other recommendation.
No Guarantee: Past performance of any trading system or methodology is not necessarily indicative of future results. The "Institutional Trend" indicator is a tool to assist in technical analysis, not a crystal ball. The creators of this script assume no responsibility or liability for any trading losses or damages incurred as a result of using this tool. Always perform your own due diligence and consult with a qualified financial advisor before making investment decisions.

Adaptive Dual MA Trend Ribbon Community “Larsson-Style” PresetsMany traders enjoy experimenting with dual-moving-average “trend ribbon” structures that resemble the visual style of popular tools such as the Larsson Line. While the internal logic of closed-source indicators is not publicly available, the trading community often explores MA combinations like SMMA 15/29 or EMA 30/60 with ATR filters to study trend transitions and visualize momentum shifts.
This script does not replicate, reverse-engineer, or replace any closed-source indicator. Instead, it provides a flexible, open-source framework that lets traders build their own trend-ribbon configuration inspired by similar visual concepts while maintaining full transparency. Because the calculations rely only on standard, well-known moving-average and ATR methods, traders can experiment freely with community-discussed presets without relying on proprietary tools.
What the Script Does
• Plots Fast and Slow moving averages using the method of your choice: SMMA (RMA), EMA, SMA, or WMA
• Colors the ribbon to show directional bias:
• Bullish when Fast MA > Slow MA
• Bearish when Fast MA < Slow MA
• Neutral when the difference is small (optional ATR filter)
• Supports ATR-based neutral zone filtering
• Supports optional bar coloring
• Works on all markets and timeframes
• Fully open-source and customizable
Why This Script Is Useful
Traditional moving averages identify trend direction but lack context during uncertain or low-momentum conditions. This script adds value by:
1. Allowing multiple smoothing techniques (SMMA/EMA/SMA/WMA)
2. Highlighting clearer trend transitions
3. Identifying low-confidence periods using ATR
4. Providing a visually intuitive ribbon instead of single-line signals
Suitable for swing traders, trend followers, breakout traders, and anyone who wants cleaner structure-based contextualization.
Popular Community MA Combinations
Many traders experiment with specific MA pairs to understand trend-ribbon behavior:
• SMMA 15/29 → smoother structural trend flow
• EMA 30/60 → more responsive momentum shifts
• EMA 10/21 → intraday rhythm
• EMA 50/100 → higher-timeframe structure
These examples are commonly used by the community—but this script does not recreate or imitate any closed-source or commercial indicator.
How to Use
1. Choose your preferred MA type
2. Adjust Fast/Slow lengths to match your timeframe
3. Enable ATR Neutral Zone to reduce false flips
4. Optionally enable bar coloring
5. Combine with structure, volume, or price action for decision-making
Important Notes
• This script is original, open-source, and not affiliated with any commercial indicator or author.
• It does not reproduce, imitate, or reverse-engineer any closed-source logic.
• All computations are standard MA/ATR methods for clarity and transparency.
Disclaimer
This tool is for educational and analytical purposes only.
Always test parameters and use proper risk management before applying to live trading.

Linda Raschke 5 SMA Reversal [LuciTech]How This Indicator Works:
-5 SMA Tracking: Calculates a 5-period simple moving average and plots it on the chart.
-Extension Counter: Counts consecutive bars where price closes above or below the 5 SMA.
-BUY Signals (Green Up Arrow): Triggers when price closes BELOW the 5 SMA after 7+ consecutive closes ABOVE it—indicates a reversal opportunity into dynamic support.
-SELL Signals (Red Down Arrow): Triggers when price closes ABOVE the 5 SMA after 7+ consecutive closes BELOW it—indicates a reversal bounce setup.
-No Repainting: Signals only plot on confirmed bar closes; no repainting issues.
Linda Raschke's Core Principles:
-Extended Run = Imbalance: When price stays above/below the 5 SMA for 7+ bars, it's a one-sided market; mean reversion is likely.
-First Cross = Trigger: The first close back across the SMA after an extension is the reversal signal, not every touch.
-No Setup? No Trade: Without a prior extension or "three-bar balance" filter, a 5 SMA tag is noise. The model requires the prior momentum condition.
-Uptrend Buys: In uptrends, buy dips to the SMA (dynamic support) as long as the weekly/monthly trend is intact.
-Downtrend Fades: In downtrends, treat first rallies above the SMA as bounce fades into lower lows (especially after 14+ bars below).
