Triple Simple Moving AveragesBased on AdventTrading's TEMA script, but using simple moving averages instead of exponential. Also changed the colours to be nicer.
Moving

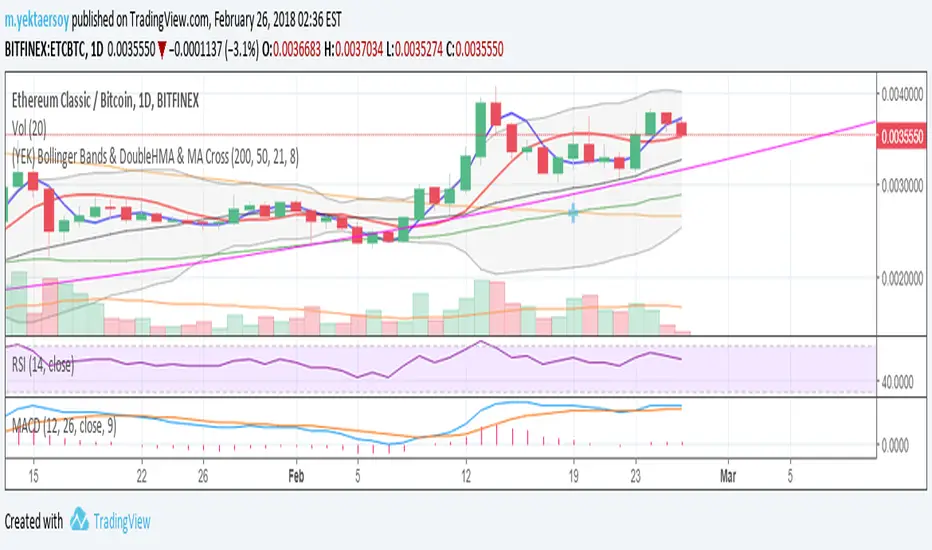
(YEK) Bollinger Bands & DoubleHMA & MA CrossMy favorite indicators ALL-IN-1: Bollinger Bands, Double Hull Moving Average (21,8), Double Moving Average (200,50)
DayMidPointDayMidPoint - Plot the moving average of the Daily price midpoint for short periods of time (i.e. 3 day or 5 day). Great for detecting the short term daily trend direction to determine a SHORT or LONG position building in a stock. Use with DayHigh and DayLow indicators. for nice price channels on a chart.

DayHigh - Plot the Moving Average of the Daily HighPlot the Moving Average of the Daily High for short periods of time (i.e 3 day or 5 day). Great for detecting when a stocks SELL pressure is running out and time to switch to a BUY strategy. Use in the DayHIGH indicator for nice price channels on a chart.
DayLow - Chart the Moving Average of the DAILY LOW PriceThis is a moving average of the Daily LOW Price over a short period of time (i.e. 3 day low moving average, etc...) Great for tracking trailing stops for a stock on an up swing.

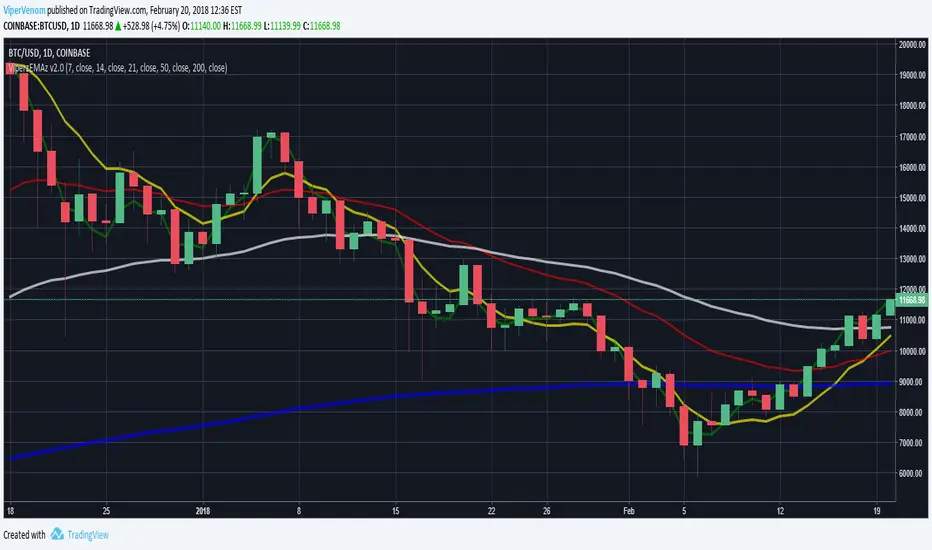
Viperz Super EMA Mix v2.0Hello friends,
Welcome to Viperz Super EMA Mix v2.0!!!
v2.0: Added TEMA source as an input, so the default value can be changed. I also Added a full description of Viperz Super EMA Mix below.
I have created a multi-layered Exponential Moving Average chart indicator, called Viperz Super EMA Mix. This is used to measure momentum of market trends. I had Bitcoin/Crypto trading in mind while creating it. Here is a breakdown of the different moving averages included, their default values and the reasoning behind why they were chosen.
First, we have the most reactive EMA, which is a Triple EMA, or TEMA. The TEMA smooths price fluctuations and filters out more volatility than a traditional EMA. Therefore, I have chosen that as the green line which will be nearest to the current price. I used TEMA here, so it will help filter out some of the noise on the most reactive EMA on this indicator. I have chosen 7 as the default for length, since that is a week. I chose the color green because I am using a stop light theme to make it easy for myself, and hopefully, for others to remember. All you have to remember for color order is Green > Yellow > Red. If the green is above yellow and yellow is above red lines, then current trend is bullish.
Secondly, we have the next most reactive EMA, which is a Double EMA, or DEMA. The DEMA is a fast-acting moving average that is more responsive to market changes than a traditional moving average. The TEMA and DEMA will react with each other the most on the charts, since their default values are nearest each other and use smaller lengths. I chose them to be the first 2 EMAs, in a "reverse order", so that the noise filtering is done slightly more on the shorter EMAs with more volatility. I chose 14 as default on the DEMA, since that is 2 weeks. I choose the color yellow to stick with my stop light theme (green better then yellow better than red).
Third, we have a less reactive regular EMA, set at length 21. This represents 3 weeks and uses the color red. If green and yellow are below the red lines, then the trend is bearish.
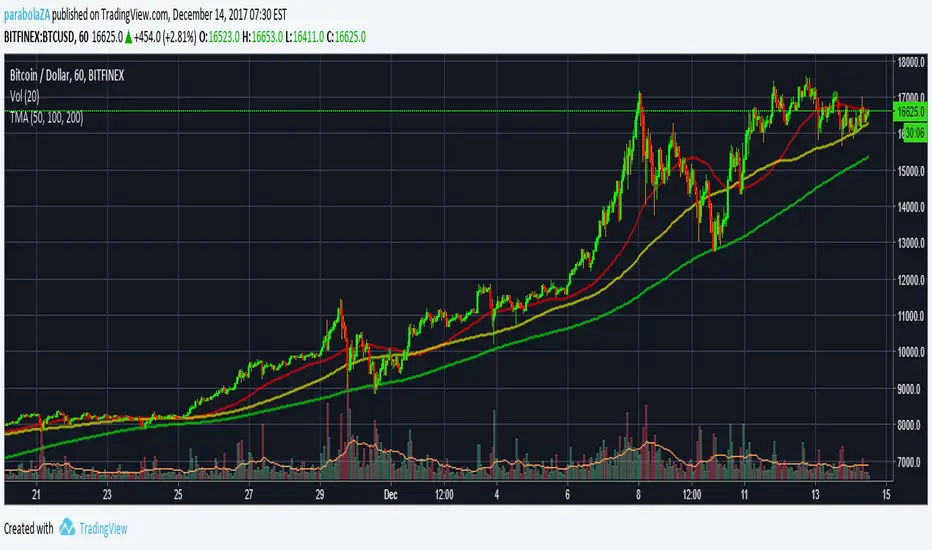
Lastly, I included the 50 day and 200 day EMAs, because they very commonly used for Bitcoin trading. I could try to explain it, but they do a better job of explaining why 50 and 200 day EMAs are used if you check this article here: cointelegraph.com
The color chosen for the 50 day was white and 200 day was blue. This is also so it's easy for me to remember (America, red, white and blue). Here is the full color scheme order: Green, Yellow, Red, White, Blue.
*** Just remember traffic lights first on smaller time frames (1 - 4 Hour time frames) and American flag for larger time frames (Daily to Weekly time frames) and you'll be recognizing the color scheme easily at a glance in no time!
If you don't agree on any of the default values I have chosen, then I have made it so you can change the length or source input values to anything you want for each moving average. You can also adjust the coloring and size of the EMA's bands.
If you find different default values that you like and you want me to make a special version for you, please send me a personal message. I appreciate the likes and follows. :)
TLDR: This should be used as a momentum indicator while market trading. The easiest way to remember how to recognize the market trend using my color scheme is to think of a stop light. Green, yellow, then red. The last are red, white and blue, like the American flag. If the order of the colors is green, yellow, red, white, blue, then the market is strongly trending bullish. It is opposite for bearish trend. Traffic lights (green/yellow/red) work the best on smaller time frames (Hourlys) and American flag (red/white/blue) for larger time frames (daily-weekly). All default input values and sources can be changed for each EMA.
Thank you, enjoy!

Variable Index Dynamic Average (VIDYA)Variable Index Dynamic Average indicator script based on the original version by Tushar Chande.


6 Simple Blue & 5 Exponential Yellow Moving Averages6 simple and 5 exponential Moving Averages in one indicator.
I made this because its not always easy to tell what average the price might be bouncing off from when you only have a couple at a time.
For some reason, the defaults aren't working.
To fix this, just open the configuration for the indicator after the first time that you load it.
Then check/uncheck the box and set the time period.
If anyone knows how I can fix this in the code, please let me know.
Blue indicators are simple and the Yellow are exponential.
Thinner more transparent lines are shorter term averages and Thicker lines are longer term averages.
I modeled it after the source of several other scripts which had less averages
3SMAThis script plots three Simple Moving Averages instead of just one.
Support me going through grad school!
www.linkedin.com
BTC tip jar: 1Mv1s7nLaTsRoLai5WXEGg8doisXuiPUXy
ETH tip jar: 0x6113DDD23D0D5aCad3d1f8640A8A571E9Cb86cB8
LTC tip jar: LYvyoqTSWxa22TQw3E7818xy4AfYNi6xcm
BCH tip jar: 1GC7oZ7MhLkamKCDdZFnUfV21SKWq84VdY

MACDAS by KIVANCfr3762 with Plots and AlertsMACDAS script by KIVANCfr3762, i added Plots and Alerts
original script

Combo Indicator V2This is an updated version of the Combo Indicator I previously published. It combines Bollinger Bands, 3 moving averages and 1 exponential moving average all into one chart. I use this indicators on most of my charts so wanted an easy way of combining them all.
SPECIAL BONUS
This indicator also includes a common Bollinger Band trading strategy built in. It was developed with options trading in mind for members over at OptionsPlayers.com. It tries to detect when the BB tunnel tightens, and then triggers an entry position when it detects the breakout. No strategy is 100% accurate, and there are some false positives, but it seems to work fairly well. However, do your own due diligence and use at your own risk.
The strategy can be turned on using a checkbox in the properties.


Dual Exponential Moving AveragesJust like the regular "Moving Average Exponential" indicator except this allows you to show 2 with custom time intervals, saving non-subscribers to Trading View an indicator slot. Enjoy.
Magic Moving Averages!Magic Moving Averages! is an indicator that comes standard in many forex trading platforms, and now on Tradingview designed for comfortable readability! It incorporates a series of simple moving averages plotted together with increasing periods. Finding a good trade with this is easily found with a set of rules. I took a course with Alex du Plooy on these rules and am using his suggested default values, however there are many more teachers of this method that have various rules that may be similar. If you desire a greater MA spread simply increase the MA Separation value in the input. Best for 15 mins or longer charts.
Happy trading
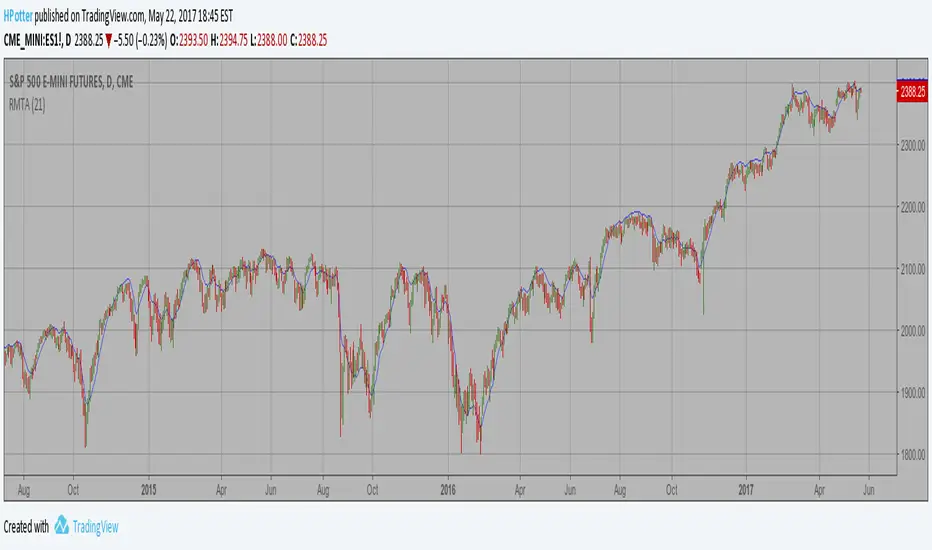
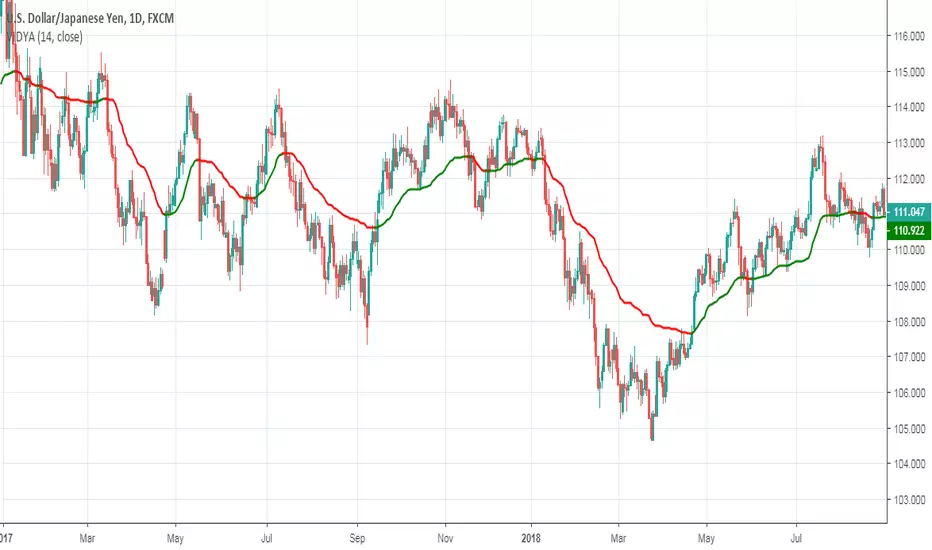
Recursive Moving Trend Average Taken from an article "The Yen Recused" in the December 1998 issue of TASC,
written by Dennis Meyers. He describes the Recursive MA in mathematical terms
as "recursive polynomial fit, a technique that uses a small number of past values
of the estimated price and today's price to predict tomorrows price."