Advanced Trend Momentum [Alpha Extract]The Advanced Trend Momentum indicator provides traders with deep insights into market dynamics by combining exponential moving average analysis with RSI momentum assessment and dynamic support/resistance detection. This sophisticated multi-dimensional tool helps identify trend changes, momentum divergences, and key structural levels, offering actionable buy and sell signals based on trend strength and momentum convergence.
🔶 CALCULATION
The indicator processes market data through multiple analytical methods:
Dual EMA Analysis: Calculates fast and slow exponential moving averages with dynamic trend direction assessment and ATR-normalized strength measurement.
RSI Momentum Engine: Implements RSI-based momentum analysis with enhanced overbought/oversold detection and momentum velocity calculations.
Pivot-Based Structure: Identifies and tracks dynamic support and resistance levels using pivot point analysis with configurable level management.
Signal Integration: Combines trend direction, momentum characteristics, and structural proximity to generate high-probability trading signals.
Formula:
Fast EMA = EMA(Close, Fast Length)
Slow EMA = EMA(Close, Slow Length)
Trend Direction = Fast EMA > Slow EMA ? 1 : -1
Trend Strength = |Fast EMA - Slow EMA| / ATR(Period) × 100
RSI Momentum = RSI(Close, RSI Length)
Momentum Value = Change(Close, 5) / ATR(10) × 100
Pivot Support/Resistance = Dynamic pivot arrays with configurable lookback periods
Bullish Signal = Trend Change + Momentum Confirmation + Strength > 1%
Bearish Signal = Trend Change + Momentum Confirmation + Strength > 1%
🔶 DETAILS
Visual Features:
Trend EMAs: Fast and slow exponential moving averages with dynamic color coding (bullish/bearish)
Enhanced RSI: RSI oscillator with color-coded zones, gradient fills, and reference bands at overbought/oversold levels
Trend Fill: Dynamic gradient between EMAs indicating trend strength and direction
Support/Resistance Lines: Horizontal levels extending from pivot-based calculations with configurable maximum levels
Momentum Candles: Color-coded candlestick overlay reflecting combined trend and momentum conditions
Divergence Markers: Diamond-shaped signals highlighting bullish and bearish momentum divergences
Analysis Table: Real-time summary of trend direction, strength percentage, RSI value, and momentum reading
Interpretation:
Trend Direction: Bullish when Fast EMA crosses above Slow EMA with strength confirmation
Trend Strength > 1%: Strong trending conditions with institutional participation
RSI > 70: Overbought conditions, potential selling opportunity
RSI < 30: Oversold conditions, potential buying opportunity
Momentum Divergence: Price and momentum moving opposite directions signal potential reversals
Support/Resistance Proximity: Dynamic levels provide optimal entry/exit zones
Combined Signals: Trend changes with momentum confirmation generate high-probability opportunities
🔶 EXAMPLES
Trend Confirmation: Fast EMA crossing above Slow EMA with trend strength exceeding 1% and positive momentum confirms strong bullish conditions.
Example: During institutional accumulation phases, EMA crossovers with momentum confirmation have historically preceded significant upward moves, providing optimal long entry points.
15min
4H
Momentum Divergence Detection: RSI reaching overbought levels while momentum decreases despite rising prices signals potential trend exhaustion.
Example: Bearish divergence signals appearing at resistance levels have marked major market tops, allowing traders to secure profits before corrections.
Support/Resistance Integration: Dynamic pivot-based levels combined with trend and momentum signals create high-probability trading zones.
Example: Bullish trend changes occurring near established support levels offer optimal risk-reward entries with clearly defined stop-loss levels.
Multi-Dimensional Confirmation: The indicator's combination of trend, momentum, and structural analysis provides comprehensive market validation.
Example: When trend direction aligns with momentum characteristics near key structural levels, the confluence creates institutional-grade trading opportunities with enhanced probability of success.
🔶 SETTINGS
Customization Options:
Trend Analysis: Fast EMA Length (default: 12), Slow EMA Length (default: 26), Trend Strength Period (default: 14)
Support & Resistance: Pivot Length for level detection (default: 10), Maximum S/R Levels displayed (default: 3), Toggle S/R visibility
Momentum Settings: RSI Length (default: 14), Oversold Level (default: 30), Overbought Level (default: 70)
Visual Configuration: Color schemes for bullish/bearish/neutral conditions, transparency settings for fills, momentum candle overlay toggle
Display Options: Analysis table visibility, divergence marker size, alert system configuration
The Advanced Trend Momentum indicator provides traders with comprehensive insights into market dynamics through its sophisticated integration of trend analysis, momentum assessment, and structural level detection. By combining multiple analytical dimensions into a unified framework, this tool helps identify high-probability opportunities while filtering out market noise through its multi-confirmation approach, enabling traders to make informed decisions across various market cycles and timeframes.
Meanreversion

EMA21/SMA21 + ATR Bands SuiteThe EMA/SMA + ATR Bands Suite is a powerful technical overlay built around one of the most universally respected zones in trading: the 21-period moving average. By combining both the EMA21 and SMA21 into a unified framework, this tool defines the short-term mean with greater clarity and reliability, offering a more complete picture of trend structure, directional bias, and price equilibrium. These two moving averages serve as the central anchor — and from them, the script dynamically calculates adaptive ATR bands that expand and contract with market volatility. Whether you trade breakouts, pullbacks, or reversion setups, the 21 midline combined with ATR extensions offers a powerful lens for real-time market interpretation — adaptable to any timeframe or asset.
🔍 What's Inside?
✅ EMA21 + SMA21 Full Plots and Reduced-History Segments using arrays:
Enable full plots or segmented lines for the most recent candles only with automatic color coding. The reduced-history plots are perfect for reducing clutter on your chart.
✅ ATR Bands (2.5x & 5x):
Adaptive ATR-based volatility envelopes plotted around the midline (EMA21 + SMA21) to indicate:
🔸Potential reversion zones.
🔸Trend continuation breakouts.
🔸Dynamic support/resistance levels.
🔸 Expanding or contracting volatility states
🔸 Trend-aware color changes — yellow when both bands are rising, purple when falling, and gray when direction is mixed
✅ Dual MA Fills (EMA21/SMA21):
Visually track when short-term momentum shifts using a fill between EMA21 and SMA21
✅ EMA5 & EMA200 Labels:
Display anchored labels with rounded values + % difference from price, helping you track short-term + macro trends in real-time.
✅ Intelligent Bar Coloring
Bars are automatically colored based on both price direction and position relative to the EMA/SMA. This provides instant visual feedback on trend strength and structural alignment — no need to second-guess the market tone.
✅ Dynamic Close Line Tools:
Track recent price action with flexible close-following lines
✅ RSI Overlay on Candles:
Optional RSI + RSI SMA displayed above the current bar, with automatic color logic.
🎯 Use Cases
➖Trend Traders can identify when price is stacked bullishly across moving averages and breaking above ATR zones.
➖Mean Reversion Traders can fade extremes at 2.5x or 5x ATR zones.
➖Scalpers get immediate trend insight from colored bar overlays and close-following lines.
➖Swing Traders can combine multi-timeframe EMAs with volatility thresholds for higher confluence.
📌 Final Note:
As powerful as this script can be, no single indicator should be used in isolation. For best results, combine it with price action analysis, higher-timeframe context, and complementary tools like trendlines, moving averages, or support/resistance levels. Use it as part of a well-rounded trading approach to confirm setups — not to define them alone.

Machine Learning BBPct [BackQuant]Machine Learning BBPct
What this is (in one line)
A Bollinger Band %B oscillator enhanced with a simplified K-Nearest Neighbors (KNN) pattern matcher. The model compares today’s context (volatility, momentum, volume, and position inside the bands) to similar situations in recent history and blends that historical consensus back into the raw %B to reduce noise and improve context awareness. It is informational and diagnostic—designed to describe market state, not to sell a trading system.
Background: %B in plain terms
Bollinger %B measures where price sits inside its dynamic envelope: 0 at the lower band, 1 at the upper band, ~ 0.5 near the basis (the moving average). Readings toward 1 indicate pressure near the envelope’s upper edge (often strength or stretch), while readings toward 0 indicate pressure near the lower edge (often weakness or stretch). Because bands adapt to volatility, %B is naturally comparable across regimes.
Why add (simplified) KNN?
Classic %B is reactive and can be whippy in fast regimes. The simplified KNN layer builds a “nearest-neighbor memory” of recent market states and asks: “When the market looked like this before, where did %B tend to be next bar?” It then blends that estimate with the current %B. Key ideas:
• Feature vector . Each bar is summarized by up to five normalized features:
– %B itself (normalized)
– Band width (volatility proxy)
– Price momentum (ROC)
– Volume momentum (ROC of volume)
– Price position within the bands
• Distance metric . Euclidean distance ranks the most similar recent bars.
• Prediction . Average the neighbors’ prior %B (lagged to avoid lookahead), inverse-weighted by distance.
• Blend . Linearly combine raw %B and KNN-predicted %B with a configurable weight; optional filtering then adapts to confidence.
This remains “simplified” KNN: no training/validation split, no KD-trees, no scaling beyond windowed min-max, and no probabilistic calibration.
How the script is organized (by input groups)
1) BBPct Settings
• Price Source – Which price to evaluate (%B is computed from this).
• Calculation Period – Lookback for SMA basis and standard deviation.
• Multiplier – Standard deviation width (e.g., 2.0).
• Apply Smoothing / Type / Length – Optional smoothing of the %B stream before ML (EMA, RMA, DEMA, TEMA, LINREG, HMA, etc.). Turning this off gives you the raw %B.
2) Thresholds
• Overbought/Oversold – Default 0.8 / 0.2 (inside ).
• Extreme OB/OS – Stricter zones (e.g., 0.95 / 0.05) to flag stretch conditions.
3) KNN Machine Learning
• Enable KNN – Switch between pure %B and hybrid.
• K (neighbors) – How many historical analogs to blend (default 8).
• Historical Period – Size of the search window for neighbors.
• ML Weight – Blend between raw %B and KNN estimate.
• Number of Features – Use 2–5 features; higher counts add context but raise the risk of overfitting in short windows.
4) Filtering
• Method – None, Adaptive, Kalman-style (first-order),
or Hull smoothing.
• Strength – How aggressively to smooth. “Adaptive” uses model confidence to modulate its alpha: higher confidence → stronger reliance on the ML estimate.
5) Performance Tracking
• Win-rate Period – Simple running score of past signal outcomes based on target/stop/time-out logic (informational, not a robust backtest).
• Early Entry Lookback – Horizon for forecasting a potential threshold cross.
• Profit Target / Stop Loss – Used only by the internal win-rate heuristic.
6) Self-Optimization
• Enable Self-Optimization – Lightweight, rolling comparison of a few canned settings (K = 8/14/21 via simple rules on %B extremes).
• Optimization Window & Stability Threshold – Governs how quickly preferred K changes and how sensitive the overfitting alarm is.
• Adaptive Thresholds – Adjust the OB/OS lines with volatility regime (ATR ratio), widening in calm markets and tightening in turbulent ones (bounded 0.7–0.9 and 0.1–0.3).
7) UI Settings
• Show Table / Zones / ML Prediction / Early Signals – Toggle informational overlays.
• Signal Line Width, Candle Painting, Colors – Visual preferences.
Step-by-step logic
A) Compute %B
Basis = SMA(source, len); dev = stdev(source, len) × multiplier; Upper/Lower = Basis ± dev.
%B = (price − Lower) / (Upper − Lower). Optional smoothing yields standardBB .
B) Build the feature vector
All features are min-max normalized over the KNN window so distances are in comparable units. Features include normalized %B, normalized band width, normalized price ROC, normalized volume ROC, and normalized position within bands. You can limit to the first N features (2–5).
C) Find nearest neighbors
For each bar inside the lookback window, compute the Euclidean distance between current features and that bar’s features. Sort by distance, keep the top K .
D) Predict and blend
Use inverse-distance weights (with a strong cap for near-zero distances) to average neighbors’ prior %B (lagged by one bar). This becomes the KNN estimate. Blend it with raw %B via the ML weight. A variance of neighbor %B around the prediction becomes an uncertainty proxy ; combined with a stability score (how long parameters remain unchanged), it forms mlConfidence ∈ . The Adaptive filter optionally transforms that confidence into a smoothing coefficient.
E) Adaptive thresholds
Volatility regime (ATR(14) divided by its 50-bar SMA) nudges OB/OS thresholds wider or narrower within fixed bounds. The aim: comparable extremeness across regimes.
F) Early entry heuristic
A tiny two-step slope/acceleration probe extrapolates finalBB forward a few bars. If it is on track to cross OB/OS soon (and slope/acceleration agree), it flags an EARLY_BUY/SELL candidate with an internal confidence score. This is explicitly a heuristic—use as an attention cue, not a signal by itself.
G) Informational win-rate
The script keeps a rolling array of trade outcomes derived from signal transitions + rudimentary exits (target/stop/time). The percentage shown is a rough diagnostic , not a validated backtest.
Outputs and visual language
• ML Bollinger %B (finalBB) – The main line after KNN blending and optional filtering.
• Gradient fill – Greenish tones above 0.5, reddish below, with intensity following distance from the midline.
• Adaptive zones – Overbought/oversold and extreme bands; shaded backgrounds appear at extremes.
• ML Prediction (dots) – The KNN estimate plotted as faint circles; becomes bright white when confidence > 0.7.
• Early arrows – Optional small triangles for approaching OB/OS.
• Candle painting – Light green above the midline, light red below (optional).
• Info panel – Current value, signal classification, ML confidence, optimized K, stability, volatility regime, adaptive thresholds, overfitting flag, early-entry status, and total signals processed.
Signal classification (informational)
The indicator does not fire trade commands; it labels state:
• STRONG_BUY / STRONG_SELL – finalBB beyond extreme OS/OB thresholds.
• BUY / SELL – finalBB beyond adaptive OS/OB.
• EARLY_BUY / EARLY_SELL – forecast suggests a near-term cross with decent internal confidence.
• NEUTRAL – between adaptive bands.
Alerts (what you can automate)
• Entering adaptive OB/OS and extreme OB/OS.
• Midline cross (0.5).
• Overfitting detected (frequent parameter flipping).
• Early signals when early confidence > 0.7.
These are purely descriptive triggers around the indicator’s state.
Practical interpretation
• Mean-reversion context – In range markets, adaptive OS/OB with ML smoothing can reduce whipsaws relative to raw %B.
• Trend context – In persistent trends, the KNN blend can keep finalBB nearer the mid/upper region during healthy pullbacks if history supports similar contexts.
• Regime awareness – Watch the volatility regime and adaptive thresholds. If thresholds compress (high vol), “OB/OS” comes sooner; if thresholds widen (calm), it takes more stretch to flag.
• Confidence as a weight – High mlConfidence implies neighbors agree; you may rely more on the ML curve. Low confidence argues for de-emphasizing ML and leaning on raw %B or other tools.
• Stability score – Rising stability indicates consistent parameter selection and fewer flips; dropping stability hints at a shifting backdrop.
Methodological notes
• Normalization uses rolling min-max over the KNN window. This is simple and scale-agnostic but sensitive to outliers; the distance metric will reflect that.
• Distance is unweighted Euclidean. If you raise featureCount, you increase dimensionality; consider keeping K larger and lookback ample to avoid sparse-neighbor artifacts.
• Lag handling intentionally uses neighbors’ previous %B for prediction to avoid lookahead bias.
• Self-optimization is deliberately modest: it only compares a few canned K/threshold choices using simple “did an extreme anticipate movement?” scoring, then enforces a stability regime and an overfitting guard. It is not a grid search or GA.
• Kalman option is a first-order recursive filter (fixed gain), not a full state-space estimator.
• Hull option derives a dynamic length from 1/strength; it is a convenience smoothing alternative.
Limitations and cautions
• Non-stationarity – Nearest neighbors from the recent window may not represent the future under structural breaks (policy shifts, liquidity shocks).
• Curse of dimensionality – Adding features without sufficient lookback can make genuine neighbors rare.
• Overfitting risk – The script includes a crude overfitting detector (frequent parameter flips) and will fall back to defaults when triggered, but this is only a guardrail.
• Win-rate display – The internal score is illustrative; it does not constitute a tradable backtest.
• Latency vs. smoothness – Smoothing and ML blending reduce noise but add lag; tune to your timeframe and objectives.
Tuning guide
• Short-term scalping – Lower len (10–14), slightly lower multiplier (1.8–2.0), small K (5–8), featureCount 3–4, Adaptive filter ON, moderate strength.
• Swing trading – len (20–30), multiplier ~2.0, K (8–14), featureCount 4–5, Adaptive thresholds ON, filter modest.
• Strong trends – Consider higher adaptive_upper/lower bounds (or let volatility regime do it), keep ML weight moderate so raw %B still reflects surges.
• Chop – Higher ML weight and stronger Adaptive filtering; accept lag in exchange for fewer false extremes.
How to use it responsibly
Treat this as a state descriptor and context filter. Pair it with your execution signals (structure breaks, volume footprints, higher-timeframe bias) and risk management. If mlConfidence is low or stability is falling, lean less on the ML line and more on raw %B or external confirmation.
Summary
Machine Learning BBPct augments a familiar oscillator with a transparent, simplified KNN memory of recent conditions. By blending neighbors’ behavior into %B and adapting thresholds to volatility regime—while exposing confidence, stability, and a plain early-entry heuristic—it provides an informational, probability-minded view of stretch and reversion that you can interpret alongside your own process.

Volume Profile Grid [Alpha Extract]A sophisticated volume distribution analysis system that transforms market activity into institutional-grade visual profiles, revealing hidden support/resistance zones and market participant behavior. Utilizing advanced price level segmentation, bullish/bearish volume separation, and dynamic range analysis, the Volume Profile Grid delivers comprehensive market structure insights with Point of Control (POC) identification, Value Area boundaries, and volume delta analysis. The system features intelligent visualization modes, real-time sentiment analysis, and flexible range selection to provide traders with clear, actionable volume-based market context.
🔶 Dynamic Range Analysis Engine
Implements dual-mode range selection with visible chart analysis and fixed period lookback, automatically adjusting to current market view or analyzing specified historical periods. The system intelligently calculates optimal bar counts while maintaining performance through configurable maximum limits, ensuring responsive profile generation across all timeframes with institutional-grade precision.
// Dynamic period calculation with intelligent caching
get_analysis_period() =>
if i_use_visible_range
chart_start_time = chart.left_visible_bar_time
current_time = last_bar_time
time_span = current_time - chart_start_time
tf_seconds = timeframe.in_seconds()
estimated_bars = time_span / (tf_seconds * 1000)
range_bars = math.floor(estimated_bars)
final_bars = math.min(range_bars, i_max_visible_bars)
math.max(final_bars, 50) // Minimum threshold
else
math.max(i_periods, 50)
🔶 Advanced Bull/Bear Volume Separation
Employs sophisticated candle classification algorithms to separate bullish and bearish volume at each price level, with weighted distribution based on bar intersection ratios. The system analyzes open/close relationships to determine volume direction, applying proportional allocation for doji patterns and ensuring accurate representation of buying versus selling pressure across the entire price spectrum.
🔶 Multi-Mode Volume Visualization
Features three distinct display modes for bull/bear volume representation: Split mode creates mirrored profiles from a central axis, Side by Side mode displays sequential bull/bear segments, and Stacked mode separates volumes vertically. Each mode offers unique insights into market participant behavior with customizable width, thickness, and color parameters for optimal visual clarity.
// Bull/Bear volume calculation with weighted distribution
for bar_offset = 0 to actual_periods - 1
bar_high = high
bar_low = low
bar_volume = volume
// Calculate intersection weight
weight = math.min(bar_high, next_level) - math.max(bar_low, current_level)
weight := weight / (bar_high - bar_low)
weighted_volume = bar_volume * weight
// Classify volume direction
if bar_close > bar_open
level_bull_volume += weighted_volume
else if bar_close < bar_open
level_bear_volume += weighted_volume
else // Doji handling
level_bull_volume += weighted_volume * 0.5
level_bear_volume += weighted_volume * 0.5
🔶 Point of Control & Value Area Detection
Implements institutional-standard POC identification by locating the price level with maximum volume accumulation, providing critical support/resistance zones. The Value Area calculation uses sophisticated sorting algorithms to identify the price range containing 70% of trading volume, revealing the market's accepted value zone where institutional participants concentrate their activity.
🔶 Volume Delta Analysis System
Incorporates real-time volume delta calculation with configurable dominance thresholds to identify significant bull/bear imbalances. The system visually highlights price levels where buying or selling pressure exceeds threshold percentages, providing immediate insight into directional volume flow and potential reversal zones through color-coded delta indicators.
// Value Area calculation using 70% volume accumulation
total_volume_sum = array.sum(total_volumes)
target_volume = total_volume_sum * 0.70
// Sort volumes to find highest activity zones
for i = 0 to array.size(sorted_volumes) - 2
for j = i + 1 to array.size(sorted_volumes) - 1
if array.get(sorted_volumes, j) > array.get(sorted_volumes, i)
// Swap and track indices for value area boundaries
// Accumulate until 70% threshold reached
for i = 0 to array.size(sorted_indices) - 1
accumulated_volume += vol
array.push(va_levels, array.get(volume_levels, idx))
if accumulated_volume >= target_volume
break
❓How It Works
🔶 Weighted Volume Distribution
Implements proportional volume allocation based on the percentage of each bar that intersects with price levels. When a bar spans multiple levels, volume is distributed proportionally based on the intersection ratio, ensuring precise representation of trading activity across the entire price spectrum without double-counting or volume loss.
🔶 Real-Time Profile Generation
Profiles regenerate on each bar close when in visible range mode, automatically adapting to chart zoom and scroll actions. The system maintains optimal performance through intelligent caching mechanisms and selective line updates, ensuring smooth operation even with maximum resolution settings and extended analysis periods.
🔶 Market Sentiment Analysis
Features comprehensive volume analysis table displaying total volume metrics, bullish/bearish percentages, and overall market sentiment classification. The system calculates volume dominance ratios in real-time, providing immediate insight into whether buyers or sellers control the current price structure with percentage-based sentiment thresholds.
🔶 Visual Profile Mapping
Provides multi-layered visual feedback through colored volume bars, POC line highlighting, Value Area boundaries, and optional delta indicators. The system supports profile mirroring for alternative perspectives, line extension for future reference, and customizable label positioning with detailed price information at critical levels.
Why Choose Volume Profile Grid
The Volume Profile Grid represents the evolution of volume analysis tools, combining traditional volume profile concepts with modern visualization techniques and intelligent analysis algorithms. By integrating dynamic range selection, sophisticated bull/bear separation, and multi-mode visualization with POC/Value Area detection, it provides traders with institutional-quality market structure analysis that adapts to any trading style. The comprehensive delta analysis and sentiment monitoring system eliminates guesswork while the flexible visualization options ensure optimal clarity across all market conditions, making it an essential tool for traders seeking to understand true market dynamics through volume-based price discovery.

Advanced VWAP Multi-MA System with Bollinger Bands & Dashboard📊 Key Features:
Core Functionality:
* VWAP Calculation with customizable anchor periods (Session/Week/Month/Quarter/Year)
* Multiple Moving Average Types (EMA, SMA, WMA, HMA, RMA, VWMA)
* Three MA Lengths (Fast: 9, Medium: 21, Slow: 50)
* Standard Deviation Bands with 3 levels (1σ, 2σ, 3σ)
* Dynamic band multipliers (adjustable from 0.5 to 5.0)
🎨 Visual Theme System:
* Theme Types: Dark, Light, Pro
* Visual Styles: Quantum, Holographic, Crystalline, Plasma, Nebula
* Visual Intensity Control (20-100%)
* Multi-layer Harmonic Nodes with gradient effects
* Energy Flow Lines based on momentum
* Minimal signal dots for buy/sell conditions
📈 Holographic Dashboard:
* Real-time VWAP position tracking
* MA trend analysis (Bullish/Bearish/Neutral)
* Band position indicator (±1σ, ±2σ, ±3σ)
* Volatility percentage
* Momentum direction
* Current visual theme display
✨ Visual Effects:
* Quantum Fields: Multi-layer boxes with dynamic transparency
* Energy Flow: Momentum-based directional lines
* Gradient Fills: Between bands and MAs
* Borderless Design: Clean, modern appearance
* Emoji Headers: Enhanced visual appeal (⚡ 🌌 📊 🔮)
🎯 Trading Signals:
* Bullish Signal: Close > VWAP AND Close > Fast MA AND Fast MA > Medium MA
* Bearish Signal: Close < VWAP AND Close < Fast MA AND Fast MA < Medium MA

Dip Hunter [BackQuant]Dip Hunter
What this tool does in plain language
Dip Hunter is a pullback detector designed to find high quality buy-the-dip opportunities inside healthy trends and to avoid random knife catches. It watches for a quick drop from a recent high, checks that the drop happened with meaningful participation and volatility, verifies short-term weakness inside a larger uptrend, then scores the setup and paints the chart so you can act with confidence. It also draws clean entry lines, provides a meter that shows dip strength at a glance, and ships with alerts that match common execution workflows.
How Dip Hunter thinks
It defines a recent swing reference, measures how far price has dipped off that high, and only looks at candidates that meet your minimum percentage drop.
It confirms the dip with real activity by requiring a volume spike and a volatility spike.
It checks structure with two EMAs. Price should be weak in the short term while the larger context remains constructive.
It optionally requires a higher-timeframe trend to be up so you focus on pullbacks in trending markets.
It bundles those checks into a score and shows you the score on the candles and on a gradient meter.
When everything lines up it paints a green triangle below the bar, shades the background, and (if you wish) draws a horizontal entry line at your chosen level.
Inputs and what they mean
Dip Hunter Settings
• Vol Lookback and Vol Spike : The script computes an average volume over the lookback window and flags a spike when current volume is a multiple of that average. A multiplier of 2.0 means today’s volume must be at least double the average. This helps filter noise and focuses on dips that other traders actually traded.
• Fast EMA and Slow EMA : Short-term and medium-term structure references. A dip is more credible if price closes below the fast EMA while the fast EMA is still below the slow EMA during the pullback. That is classic corrective behavior inside a larger trend.
• Price Smooth : Optional smoothing length for price-derived series. Use this if you trade very noisy assets or low timeframes.
• Volatility Len and Vol Spike (volatility) : The script checks both standard deviation and true range against their own averages. If either expands beyond your multiplier the market confirms the move with range.
• Dip % and Lookback Bars : The engine finds the highest high over the lookback window, then computes the percentage drawdown from that high to the current close. Only dips larger than your threshold qualify.
Trend Filter
• Enable Trend Filter : When on, Dip Hunter will only trigger if the market is in an uptrend.
• Trend EMA Period : The longer EMA that defines the session’s backbone trend.
• Minimum Trend Strength : A small positive slope requirement. In practice this means the trend EMA should be rising, and price should be above it. You can raise the value to be more selective.
Entries
• Show Entry Lines : Draws a horizontal guide from the signal bar for a fixed number of bars. Great for limit orders, scaling, or re-tests.
• Line Length (bars) : How far the entry guide extends.
• Min Gap (bars) : Suppresses new entry lines if another dip fired recently. Prevents clutter during choppy sequences.
• Entry Price : Choose the line level. “Low” anchors at the signal candle’s low. “Close” anchors at the signal close. “Dip % Level” anchors at the theoretical level defined by recent_high × (1 − dip%). This lets you work resting orders at a consistent discount.
Heat / Meter
• Color Bars by Score : Colors each candle using a red→white→green gradient. Red is overheated, green is prime dip territory, white is neutral.
• Show Meter Table : Adds a compact gradient strip with a pointer that tracks the current score.
• Meter Cells and Meter Position : Resolution and placement of the meter.
UI Settings
• Show Dip Signals : Plots green triangles under qualifying bars and tints the background very lightly.
• Show EMAs : Plots fast, slow, and the trend EMA (if the trend filter is enabled).
• Bullish, Bearish, Neutral colors : Theme controls for shapes, fills, and bar painting.
Core calculations explained simply
Recent high and dip percent
The script finds the highest high over Lookback Bars , calls it “recent high,” then calculates:
dip% = (recent_high − close) ÷ recent_high × 100.
If dip% is larger than Dip % , condition one passes.
Volume confirmation
It computes a simple moving average of volume over Vol Lookback . If current volume ÷ average volume > Vol Spike , we have a participation spike. It also checks 5-bar ROC of volume. If ROC > 50 the spike is forceful. This gets an extra score point.
Volatility confirmation
Two independent checks:
• Standard deviation of closes vs its own average.
• True range vs ATR.
If either expands beyond Vol Spike (volatility) the move has range. This prevents false triggers from quiet drifts.
Short-term structure
Price should close below the Fast EMA and the fast EMA should be below the Slow EMA at the moment of the dip. That is the anatomy of a pullback rather than a full breakdown.
Macro trend context (optional)
When Enable Trend Filter is on, the Trend EMA must be rising and price must be above it. The logic prefers “micro weakness inside macro strength” which is the highest probability pattern for buying dips.
Signal formation
A valid dip requires:
• dip% > threshold
• volume spike true
• volatility spike true
• close below fast EMA
• fast EMA below slow EMA
If the trend filter is enabled, a rising trend EMA with price above it is also required. When all true, the triangle prints, the background tints, and optional entry lines are drawn.
Scoring and visuals
Binary checks into a continuous score
Each component contributes to a score between 0 and 1. The script then rescales to a centered range (−50 to +50).
• Low or negative scores imply “overheated” conditions and are shaded toward red.
• High positive scores imply “ripe for a dip buy” conditions and are shaded toward green.
• The gradient meter repeats the same logic, with a pointer so you can read the state quickly.
Bar coloring
If you enable “Color Bars by Score,” each candle inherits the gradient. This makes sequences obvious. Red clusters warn you not to buy. White means neutral. Increasing green suggests the pullback is maturing.
EMAs and the trend EMA
• Fast EMA turns down relative to the slow EMA inside the pullback.
• Trend EMA stays rising and above price once the dip exhausts, which is your cue to focus on long setups rather than bottom fishing in downtrends.
Entry lines
When a fresh signal fires and no other signal happened within Min Gap (bars) , the indicator draws a horizontal level for Line Length bars. Use these lines for limit entries at the low, at the close, or at the defined dip-percent level. This keeps your plan consistent across instruments.
Alerts and what they mean
• Market Overheated : Score is deeply negative. Do not chase. Wait for green.
• Close To A Dip : Score has reached a healthy level but the full signal did not trigger yet. Prepare orders.
• Dip Confirmed : First bar of a fresh validated dip. This is the most direct entry alert.
• Dip Active : The dip condition remains valid. You can scale in on re-tests.
• Dip Fading : Score crosses below 0.5 from above. Momentum of the setup is fading. Tighten stops or take partials.
• Trend Blocked Signal : All dip conditions passed but the trend filter is offside. Either reduce risk or skip, depending on your plan.
How to trade with Dip Hunter
Classic pullback in uptrend
Turn on the trend filter.
Watch for a Dip Confirmed alert with green triangle.
Use the entry line at “Dip % Level” to stage a limit order. This keeps your entries consistent across assets and timeframes.
Initial stop under the signal bar’s low or under the next lower EMA band.
First target at prior swing high, second target at a multiple of risk.
If you use partials, trail the remainder under the fast EMA once price reclaims it.
Aggressive intraday scalps
Lower Dip % and Lookback Bars so you catch shallow flags.
Keep Vol Spike meaningful so you only trade when participation appears.
Take quick partials when price reclaims the fast EMA, then exit on Dip Fading if momentum stalls.
Counter-trend probes
Disable the trend filter if you intentionally hunt reflex bounces in downtrends.
Require strong volume and volatility confirmation.
Use smaller size and faster targets. The meter should move quickly from red toward white and then green. If it does not, step aside.
Risk management templates
Stops
• Conservative: below the entry line minus a small buffer or below the signal bar’s low.
• Structural: below the slow EMA if you aim for swing continuation.
• Time stop: if price does not reclaim the fast EMA within N bars, exit.
Position sizing
Use the distance between the entry line and your structural stop to size consistently. The script’s entry lines make this distance obvious.
Scaling
• Scale at the entry line first touch.
• Add only if the meter stays green and price reclaims the fast EMA.
• Stop adding on a Dip Fading alert.
Tuning guide by market and timeframe
Equities daily
• Dip %: 1.5 to 3.0
• Lookback Bars: 5 to 10
• Vol Spike: 1.5 to 2.5
• Volatility Len: 14 to 20
• Trend EMA: 100 or 200
• Keep trend filter on for a cleaner list.
Futures and FX intraday
• Dip %: 0.4 to 1.2
• Lookback Bars: 3 to 7
• Vol Spike: 1.8 to 3.0
• Volatility Len: 10 to 14
• Use Min Gap to avoid clusters during news.
Crypto
• Dip %: 3.0 to 6.0 for majors on higher timeframes, lower on 15m to 1h
• Lookback Bars: 5 to 12
• Vol Spike: 1.8 to 3.0
• ATR and stdev checks help in erratic sessions.
Reading the chart at a glance
• Green triangle below the bar: a validated dip.
• Light green background: the current bar meets the full condition.
• Bar gradient: red is overheated, white is neutral, green is dip-friendly.
• EMAs: fast below slow during the pullback, then reclaim fast EMA on the bounce for quality continuation.
• Trend EMA: a rising spine when the filter is on.
• Entry line: a fixed level to anchor orders and risk.
• Meter pointer: right side toward “Dip” means conditions are maturing.
Why this combination reduces false positives
Any single criterion will trigger too often. Dip Hunter demands a dip off a recent high plus a volume surge plus a volatility expansion plus corrective EMA structure. Optional trend alignment pushes odds further in your favor. The score and meter visualize how many of these boxes you are actually ticking, which is more reliable than a binary dot.
Limitations and practical tips
• Thin or illiquid symbols can spoof volume spikes. Use larger Vol Lookback or raise Vol Spike .
• Sideways markets will show frequent small dips. Increase Dip % or keep the trend filter on.
• News candles can blow through entry lines. Widen stops or skip around known events.
• If you see many back-to-back triangles, raise Min Gap to keep only the best setups.
Quick setup recipes
• Clean swing trader: Trend filter on, Dip % 2.0 to 3.0, Vol Spike 2.0, Volatility Len 14, Fast 20 EMA, Slow 50 EMA, Trend 100 EMA.
• Fast intraday scalper: Trend filter off, Dip % 0.7 to 1.0, Vol Spike 2.5, Volatility Len 10, Fast 9 EMA, Slow 21 EMA, Min Gap 10 bars.
• Crypto swing: Trend filter on, Dip % 4.0, Vol Spike 2.0, Volatility Len 14, Fast 20 EMA, Slow 50 EMA, Trend 200 EMA.
Summary
Dip Hunter is a focused pullback engine. It quantifies a real dip off a recent high, validates it with volume and volatility expansion, enforces corrective structure with EMAs, and optionally restricts signals to an uptrend. The score, bar gradient, and meter make reading conditions instant. Entry lines and alerts turn that read into an executable plan. Tune the thresholds to your market and timeframe, then let the tool keep you patient in red, selective in white, and decisive in green.

Zero Lag Liquidity [AlgoAlpha]🟠 OVERVIEW
This script plots liquidity zones with zero lag using lower-timeframe wick profiles and high-volume wicks to mark key price reactions. It’s called Zero Lag Liquidity because it captures significant liquidity imbalances in real time by processing lower-TF price-volume distributions directly inside the wick of abnormal candles. The tool builds a volume histogram inside long upper/lower wicks, then calculates a local Point of Control (POC) to mark the price where most volume occurred. These levels act as visual liquidity zones, which can trigger labels, break signals, and trend detection depending on price interaction.
🟠 CONCEPTS
The core concept relies on identifying high-volume candles with unusually long wicks—often a sign of opposing liquidity. When a large upper or lower wick appears with a strong volume spike, the script builds a histogram of lower-timeframe closes and volumes inside that wick. It bins the wick into segments, sums volume per bin, and finds the POC. This POC becomes the liquidity level. The script then dynamically tracks whether price breaks above or rejects off these levels, adjusts the active trend regime accordingly, and highlights bars to help users spot continuation or reversal behavior. The logic avoids repainting or subjective interpretation by using fixed thresholds and lower-TF price action.
🟠 FEATURES
Dynamic liquidity levels rendered at POC of significant wicks, colored by bullish/bearish direction.
Break detection that removes levels once price decisively crosses them twice in the same direction.
Rejection detection that plots ▲/▼ markers when price bounces off levels intrabar.
Volume labels for each level, shown either as raw volume or percentage of total level volume.
Candle coloring based on trend direction (break-dominant).
🟠 USAGE
Use this indicator to track where liquidity has most likely entered the market via abnormal wick events. When a long wick forms with high volume, the script looks inside it (using your chosen lower timeframe) and marks the most traded price within it. These levels can serve as expected reversal or breakout zones. Rejections are marked with small arrows, while breaks trigger trend shifts and remove the level. You can toggle trend coloring to see directional bias after a breakout. Use the wick multiplier to control how selective the detector is (higher = stricter). Alerts and label modes help customize the signal for different asset types and chart styles.

Mean Reversion & Momentum Hybrid | D_QUANT 📌 Mean Reversion & Momentum Hybrid | D_QUANT
📖 Description:
This indicator combines mean reversion logic, volatility filtering, and percentile-based momentum to deliver clear, context-aware buy/sell signals designed for trend-following and contrarian setups.
At its core, it merges:
A Bollinger Band % Positioning Model (BB%)
A 75th/25th Percentile Momentum System
A Volatility-Adjusted Trend Filter using RMA + ATR
All tied together with a dynamic gradient-style oscillator that visualizes signal strength and persistence over time — making it easy to track high-conviction setups.
Signals only trigger when all three core components align, filtering out noise and emphasizing high-probability turning points or trend continuations.
⚙️ Methodology Overview:
Bollinger Bands % (BB%):
Price is measured as a percentage between upper and lower Bollinger Bands (based on OHLC4). Entries are only considered when price exceeds custom BB% thresholds — emphasizing market extremes.
Volatility-Based Trend Filter (RMA + ATR):
A smoothed RMA baseline is paired with ATR to define trend bias. This ensures signals only occur when price deviates meaningfully beyond recent volatility.
Percentile Momentum Model (75th/25th Rank):
Price is compared against its rolling 75th and 25th percentile. If price breaks these statistical boundaries (adjusted by ATR), it triggers a directional momentum condition.
Signal Consensus Engine:
All three layers must agree — BB% condition, trend filter, and percentile momentum — before a buy or sell signal is plotted.
Gradient Oscillator Visualization:
Signals appear as a fading oscillator line with a gradient-filled area beneath it. The color intensity represents how “fresh” or “strong” the signal is, fading over time if not reconfirmed, offering both clarity and signal aging at a glance.
🔧 User Inputs:
🧠 Core Settings:
Source: Select the price input (default: close)
Bollinger Bands Length: Period for BB basis and deviation
Bollinger Bands Multiplier: Width of the bands
Minimum BB Width (% of Price): Prevents signals during low-volatility chop
📊 BB% Thresholds:
BB% Long Threshold (L): Minimum %B to consider a long
BB% Short Threshold (S): Maximum %B to consider a short
🔍 Trend Filter Parameters:
RMA Length: Period for the smoothed trend baseline
ATR Length: Lookback for ATR in trend deviation filter
⚡️ Momentum Parameters:
Momentum Length: Period for percentile momentum calculation
Mult_75 / Mult_25: ATR-adjusted thresholds for breakout above/below percentile levels
🎨 Visualization:
Bar Coloring: Highlights candles during active signals
Background Coloring: Optional background shading for signals
Show Oscillator Plot: Toggle the gradient-style oscillator
🧪 Use Case:
This indicator works well across all assets for trend identification. It is particularly effective when used on higher timeframes (e.g. 12H, 1D,2D) to capture mean reversion bounces or confirm breakouts backed by percentile momentum and volatility expansion.
⚠️ Notes:
This is not financial advice. Use in combination with proper risk management and confluence from other tools.

Hurst Exponent Adaptive Filter (HEAF) [PhenLabs]📊 PhenLabs - Hurst Exponent Adaptive Filter (HEAF)
Version: PineScript™ v6
📌 Description
The Hurst Exponent Adaptive Filter (HEAF) is an advanced Pine Script indicator designed to dynamically adjust moving average calculations based on real time market regimes detected through the Hurst Exponent. The intention behind the creation of this indicator was not a buy/sell indicator but rather a tool to help sharpen traders ability to distinguish regimes in the market mathematically rather than guessing. By analyzing price persistence, it identifies whether the market is trending, mean-reverting, or exhibiting random walk behavior, automatically adapting the MA length to provide more responsive alerts in volatile conditions and smoother outputs in stable ones. This helps traders avoid false signals in choppy markets and capitalize on strong trends, making it ideal for adaptive trading strategies across various timeframes and assets.
Unlike traditional moving averages, HEAF incorporates fractal dimension analysis via the Hurst Exponent to create a self-tuning filter that evolves with market conditions. Traders benefit from visual cues like color coded regimes, adaptive bands for volatility channels, and an information panel that suggests appropriate strategies, enhancing decision making without constant manual adjustments by the user.
🚀 Points of Innovation
Dynamic MA length adjustment using Hurst Exponent for regime-aware filtering, reducing lag in trends and noise in ranges.
Integrated market regime classification (trending, mean-reverting, random) with visual and alert-based notifications.
Customizable color themes and adaptive bands that incorporate ATR for volatility-adjusted channels.
Built-in information panel providing real-time strategy recommendations based on detected regimes.
Power sensitivity parameter to fine-tune adaptation aggressiveness, allowing personalization for different trading styles.
Support for multiple MA types (EMA, SMA, WMA) within an adaptive framework.
🔧 Core Components
Hurst Exponent Calculation: Computes the fractal dimension of price series over a user-defined lookback to detect market persistence or anti-persistence.
Adaptive Length Mechanism: Maps Hurst values to MA lengths between minimum and maximum bounds, using a power function for sensitivity control.
Moving Average Engine: Applies the chosen MA type (EMA, SMA, or WMA) to the adaptive length for the core filter line.
Adaptive Bands: Creates upper and lower channels using ATR multiplied by a band factor, scaled to the current adaptive length.
Regime Detection: Classifies market state with thresholds (e.g., >0.55 for trending) and triggers alerts on regime changes.
Visualization System: Includes gradient fills, regime-colored MA lines, and an info panel for at-a-glance insights.
🔥 Key Features
Regime-Adaptive Filtering: Automatically shortens MA in mean-reverting markets for quick responses and lengthens it in trends for smoother signals, helping traders stay aligned with market dynamics.
Custom Alerts: Notifies on regime shifts and band breakouts, enabling timely strategy adjustments like switching to trend-following in bullish regimes.
Visual Enhancements: Color-coded MA lines, gradient band fills, and an optional info panel that displays market state and trading tips, improving chart readability.
Flexible Settings: Adjustable lookback, min/max lengths, sensitivity power, MA type, and themes to suit various assets and timeframes.
Band Breakout Signals: Highlights potential overbought/oversold conditions via ATR-based channels, useful for entry/exit timing.
🎨 Visualization
Main Adaptive MA Line: Plotted with regime-based colors (e.g., green for trending) to visually indicate market state and filter position relative to price.
Adaptive Bands: Upper and lower lines with gradient fills between them, showing volatility channels that widen in random regimes and tighten in trends.
Price vs. MA Fills: Color-coded areas between price and MA (e.g., bullish green above MA in trending modes) for quick trend strength assessment.
Information Panel: Top-right table displaying current regime (e.g., "Trending Market") and strategy suggestions like "Follow trends" or "Trade ranges."
📖 Usage Guidelines
Core Settings
Hurst Lookback Period
Default: 100
Range: 20-500
Description: Sets the period for Hurst Exponent calculation; longer values provide more stable regime detection but may lag, while shorter ones are more responsive to recent changes.
Minimum MA Length
Default: 10
Range: 5-50
Description: Defines the shortest possible adaptive MA length, ideal for fast responses in mean-reverting conditions.
Maximum MA Length
Default: 200
Range: 50-500
Description: Sets the longest adaptive MA length for smoothing in strong trends; adjust based on asset volatility.
Sensitivity Power
Default: 2.0
Range: 1.0-5.0
Description: Controls how aggressively the length adapts to Hurst changes; higher values make it more sensitive to regime shifts.
MA Type
Default: EMA
Options: EMA, SMA, WMA
Description: Chooses the moving average calculation method; EMA is more responsive, while SMA/WMA offer different weighting.
🖼️ Visual Settings
Show Adaptive Bands
Default: True
Description: Toggles visibility of upper/lower bands for volatility channels.
Band Multiplier
Default: 1.5
Range: 0.5-3.0
Description: Scales band width using ATR; higher values create wider channels for conservative signals.
Show Information Panel
Default: True
Description: Displays regime info and strategy tips in a top-right panel.
MA Line Width
Default: 2
Range: 1-5
Description: Adjusts thickness of the main MA line for better visibility.
Color Theme
Default: Blue
Options: Blue, Classic, Dark Purple, Vibrant
Description: Selects color scheme for MA, bands, and fills to match user preferences.
🚨 Alert Settings
Enable Alerts
Default: True
Description: Activates notifications for regime changes and band breakouts.
✅ Best Use Cases
Trend-Following Strategies: In detected trending regimes, use the adaptive MA as a trailing stop or entry filter for momentum trades.
Range Trading: During mean-reverting periods, monitor band breakouts for buying dips or selling rallies within channels.
Risk Management in Random Markets: Reduce exposure when random walk is detected, using tight stops suggested in the info panel.
Multi-Timeframe Analysis: Apply on higher timeframes for regime confirmation, then drill down to lower ones for entries.
Volatility-Based Entries: Use upper/lower band crossovers as signals in adaptive channels for overbought/oversold trades.
⚠️ Limitations
Lagging in Transitions: Regime detection may delay during rapid market shifts, requiring confirmation from other tools.
Not a Standalone System: Best used in conjunction with other indicators; random regimes can lead to whipsaws if traded aggressively.
Parameter Sensitivity: Optimal settings vary by asset and timeframe, necessitating backtesting.
💡 What Makes This Unique
Hurst-Driven Adaptation: Unlike static MAs, it uses fractal analysis to self-tune, providing regime-specific filtering that's rare in standard indicators.
Integrated Strategy Guidance: The info panel offers actionable tips tied to regimes, bridging analysis and execution.
Multi-Regime Visualization: Combines adaptive bands, colored fills, and alerts in one tool for comprehensive market state awareness.
🔬 How It Works
Hurst Exponent Computation:
Calculates log returns over the lookback period to derive the rescaled range (R/S) ratio.
Normalizes to a 0-1 value, where >0.55 indicates trending, <0.45 mean-reverting, and in-between random.
Length Adaptation:
Maps normalized Hurst to an MA length via a power function, clamping between min and max.
Applies the selected MA type to close prices using this dynamic length.
Visualization and Signals:
Plots the MA with regime colors, adds ATR-based bands, and fills areas for trend strength.
Triggers alerts on regime changes or band crosses, with the info panel suggesting strategies like momentum riding in trends.
💡 Note:
For optimal results, backtest settings on your preferred assets and combine with volume or momentum indicators. Remember, no indicator guarantees profits—use with proper risk management. Access premium features and support at PhenLabs.

Smart Money Breakout Channels [AlgoAlpha]🟠 OVERVIEW
This script draws breakout detection zones called “Smart Money Breakout Channels” based on volatility-normalized price movement and visualizes them as dynamic boxes with volume overlays. It identifies temporary accumulation or distribution ranges using a custom normalized volatility metric and tracks when price breaks out of those zones—either upward or downward. Each channel represents a structured range where smart money may be active, helping traders anticipate key breakouts with added context from volume delta, up/down volume, and a visual gradient gauge for momentum bias.
🟠 CONCEPTS
The script calculates normalized price volatility by measuring the standard deviation of price mapped to a scale using the highest and lowest prices over a set lookback period. When normalized volatility reaches a local low and flips upward, a boxed channel is drawn between the highest and lowest prices in that zone. These boxes persist until price breaks out, either with a strong candle close (configurable) or by touching the boundary. Volume analysis enhances interpretation by rendering delta bars inside the box, showing volume distribution during the channel. Additionally, a real-time visual “gauge” shows where volume delta sits within the channel range, helping users spot pressure imbalances.
🟠 FEATURES
Automatic detection and drawing of breakout channels based on volatility-normalized price pivots.
Optional nested channels to allow multiple simultaneous zones or a clean single-zone view.
Gradient-filled volume gauge with dynamic pointer to show current delta pressure within the box.
Three volume visualization modes: raw volume, comparative up/down volume, and delta.
Alerts for new channel creation and confirmed bullish or bearish breakouts.
🟠 USAGE
Apply the indicator to any chart. Wait for a new breakout box to form—this occurs when volatility behavior shifts and a stable range emerges. Once a box appears, monitor price relative to its boundaries. A breakout above suggests bullish continuation, below suggests bearish continuation; signals are stronger when “Strong Closes Only” is enabled.
Watch the internal volume candles to understand where buy/sell pressure is concentrated during the box. Use the gauge on the right to interpret whether net pressure is building upward or downward before breakout to anticipate the direction.
Use alerts to catch breakout events without needing to monitor the chart constantly 🚨.

Fibonacci Range Detector ║ BullVision🔬 Overview
The Fibonacci Range Mapper is a dynamic technical tool designed to identify, track, and visualize price ranges using Fibonacci levels. Whether you're trading manually or prefer automated structure recognition, this indicator helps you contextualize market moves and locate key price zones with precision.
⚙️ Core Logic
🔍 Range Detection (Auto & Manual Modes)
In Auto mode, the indicator uses an advanced ZigZag system based on ATR or percentage thresholds to confirm market swings and construct Fibonacci-based ranges.
In Manual mode, traders can define their own swing low and high to generate precise custom ranges.
📐 Fibonacci Mapping
Each detected range is automatically plotted with key Fibonacci retracement levels — 0%, 25%, 50%, 75%, 100% — along with optional extensions (127.2% and 161.8%) to anticipate price continuations or reversals.
📋 Live Data Table
An integrated info panel dynamically displays crucial metrics:
• Range size
• Current price zone (Discount / Mid / Premium)
• Position within range (%)
• Distance to range extremes
• Range status (Pending or Confirmed)
🕰️ Historical Memory
Up to 20 past ranges can be stored and visualized simultaneously, helping traders recognize repeated price behaviors and contextual support/resistance levels.
🎨 Visual Highlights
Zones of interest (0–25% = Discount, 75–100% = Premium) are color-coded with custom transparency, and labels can be toggled for clarity. The current active range updates in real time as structure evolves.
🔧 User Customization
• Detection Method: Choose between ATR or % ZigZag for automated swing identification
• Confirmation Delay: Set how many bars to wait before confirming a new high
• Manual Overrides: Select exact price levels when you want full control
• Extensions & Labels: Toggle additional lines and info to suit your charting style
• Visual Table Position: Customize where the data table appears on screen
• Color Scheme: Define your own zone gradients for better visual interpretation
📈 Use Cases
This indicator is ideal for traders who want to:
• Identify value zones within local or macro price structures
• Plan trades around Fibonacci retracement and extension levels
• Detect shifts in market structure using an adaptive ZigZag logic
• Track recurring price ranges and historical reaction points
• Enhance technical confluence with clean, visual price mapping
⚠️ Important Notes
This tool is not a buy/sell signal generator — it is a visual framework for structure-based analysis.
Use it in conjunction with your existing strategy and risk management process.
Always confirm with broader context and multi-timeframe alignment.

Stochastic Z-Score [AlgoAlpha]🟠 OVERVIEW
This indicator is a custom-built oscillator called the Stochastic Z-Score , which blends a volatility-normalized Z-Score with stochastic principles and smooths it using a Hull Moving Average (HMA). It transforms raw price deviations into a normalized momentum structure, then processes that through a stochastic function to better identify extreme moves. A secondary long-term momentum component is also included using an ALMA smoother. The result is a responsive oscillator that reacts to sharp imbalances while remaining stable in sideways conditions. Colored histograms, dynamic oscillator bands, and reversal labels help users visually assess shifts in momentum and identify potential turning points.
🟠 CONCEPTS
The Z-Score is calculated by comparing price to its mean and dividing by its standard deviation—this normalizes movement and highlights how far current price has stretched from typical values. This Z-Score is then passed through a stochastic function, which further refines the signal into a bounded range for easier interpretation. To reduce noise, a Hull Moving Average is applied. A separate long-term trend filter based on the ALMA of the Z-Score helps determine broader context, filtering out short-term traps. Zones are mapped with thresholds at ±2 and ±2.5 to distinguish regular momentum from extreme exhaustion. The tool is built to adapt across timeframes and assets.
🟠 FEATURES
Z-Score histogram with gradient color to visualize deviation intensity (optional toggle).
Primary oscillator line (smoothed stochastic Z-Score) with adaptive coloring based on momentum direction.
Dynamic bands at ±2 and ±2.5 to represent regular vs extreme momentum zones.
Long-term momentum line (ALMA) with contextual coloring to separate trend phases.
Automatic reversal markers when short-term crosses occur at extremes with supporting long-term momentum.
Built-in alerts for oscillator direction changes, zero-line crosses, overbought/oversold entries, and trend confirmation.
🟠 USAGE
Use this script to track momentum shifts and identify potential reversal areas. When the oscillator is rising and crosses above the previous value—especially from deeply negative zones (below -2)—and the ALMA is also above zero, this suggests bullish reversal conditions. The opposite holds for bearish setups. Reversal labels ("▲" and "▼") appear only when both short- and long-term conditions align. The ±2 and ±2.5 thresholds act as momentum warning zones; values inside are typical trends, while those beyond suggest exhaustion or extremes. Adjust the length input to match the asset’s volatility. Enable the histogram to explore underlying raw Z-Score movements. Alerts can be configured to notify key changes in momentum or zone entries.

Previous Price Action## Previous Price Action - Market Structure Visualization Tool
**Three time-segmented boxes for enhanced market structure analysis:**
🟢 **240 Candles Box (Green)** - Historical context (candles -240 to -120)
🟡 **120 Candles Box (Yellow)** - Medium-term trend (candles -120 to -10)
🔴 **10 Candles Box (Red)** - Recent price action (last 10 candles)
**Key Features:**
- Non-overlapping time segments for clear trend analysis
- Uniform height based on 240-candle range for easy comparison
- 50% transparency to maintain chart readability
- Ideal for identifying momentum vs mean reversion conditions
**Perfect for:**
- Crypto day trading and scalping
- Market regime identification (trending vs choppy)
- Entry timing and trade management
- Duration of trend analysis
**Settings:** Fully customizable colors, transparency, and individual box toggle switches.

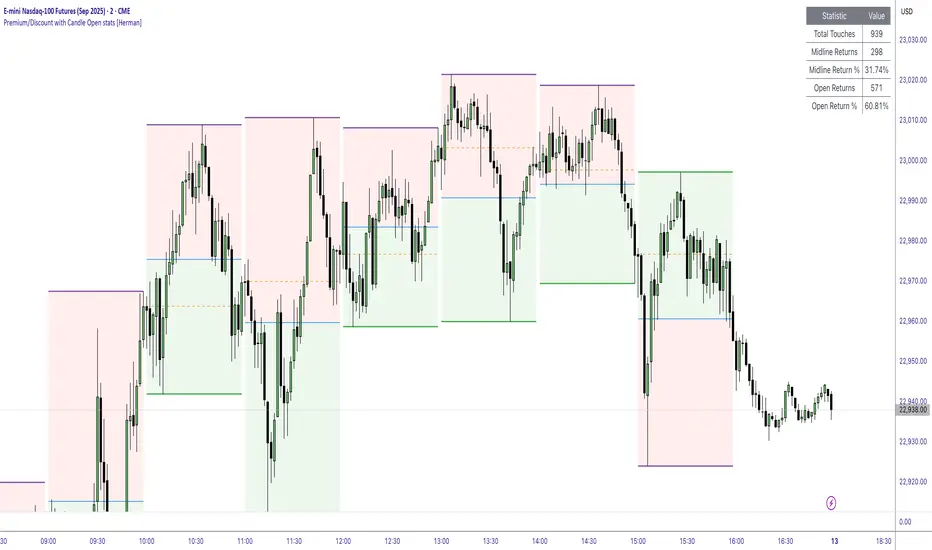
Premium/Discount with Candle Open stats [Herman]Premium/Discount with Stats
This indicator is designed to help traders identify and analyze premium/discount zones on any timeframe while automatically tracking statistics on price behavior relative to these zones. It is especially valuable for traders looking to structure entries, manage targets, and quantify market reactions to prior session ranges.
What it draws on the chart
✅ Range High and Low Lines
For each selected timeframe period (15min, 30min 1H, 4H, Daily), the indicator plots the high and low of the completed previous period.
These lines are color-coded dynamically based on sweep detection:
If the high was swept (price broke the previous high), the high line is marked as Premium.
If the low was swept, the low line is marked as Discount.
If both were swept or neither, it uses the default color settings.
✅ Midline
An optional midline at the 50% level of the previous period’s high-low range.
Helpful for mean-reversion traders or anyone watching for retests of equilibrium.
✅ Quartile Lines (25%–75%)
Optional additional lines at 25% and 75% of the previous range, helping traders visualize inner range subdivisions.
✅ Open Price Line
Marks the open price of the previous period as a horizontal reference.
✅ Background Fills
The region between low and midline is shaded with the Discount color.
The region between high and midline is shaded with the Premium color.
These optional fills help highlight the premium and discount zones visually.
✅ Current Incomplete Period Lines (optional)
You can choose to display provisional high, low, midline, quartiles, and open for the current forming period.
These update in real-time until the period closes.
Sweep Detection Logic
The indicator automatically tracks if the current period price sweeps above the previous period’s high or below the low.
A "sweep" is simply defined as price exceeding the previous high/low while tracking is active.
The sweep status affects the colors of the premium/discount lines, helping traders see potential liquidity grabs or stop hunts.
What it counts and tracks (Statistics)
The script automatically compiles statistics over time:
✅ Total Touches
Counts how many times the price in a new period touches either the previous period’s high or low.
A “touch” is registered once per side per period.
✅ Midline Returns
Counts how often, after touching the previous high/low, price returns to the previous period’s midline.
Gives you a measure of mean-reversion success.
✅ Open Returns
Similarly, tracks how often price returns to the previous period’s open after touching the previous high/low.
✅ Return Percentages
Displays the percentage of touches that result in a return to midline or open.
These percentages are calculated live on your chart and updated after each period closes.
✅ Stats Table
A customizable on-chart table summarizing all of these stats in real-time.
Helps traders evaluate the effectiveness of range-based trading setups over time.
How it Works (Technical details)
On each new bar, the script checks if a new period (as defined by your timeframe selection) has begun.
When a new period starts, the previous period’s high, low, open, midline, quartiles are recorded and drawn on the chart.
The script then “watches” the current period:
Updates provisional high and low.
Detects sweeps of previous highs/lows.
Tracks if price returns to the previous period’s midline or open after those sweeps.
Increments statistical counters if conditions are met.
Background fills and lines update dynamically based on real-time data.
Intended Use Cases
This indicator is ideal for:
✅ Identifying premium/discount zones for swing or intraday trades.
✅ Spotting liquidity sweeps and possible manipulation zones.
✅ Structuring trades with logical, data-driven target zones (midline, open).
✅ Quantifying the probability of mean-reversion moves after liquidity events.
✅ Developing and backtesting range-based trading models with live stats.
Highly Customizable
Choose any timeframe for defining the premium/discount range.
Toggle visibility of midline, quartiles, open line, current period preview.
Full control over colors, line styles, line widths, and background shading.
Optional real-time statistical table with total counts and return percentages.
Fair Value Gap Profiles [AlgoAlpha]🟠 OVERVIEW
This script draws and manages Fair Value Gap (FVG) zones by detecting unfilled gaps in price action and then augmenting them with intra-gap volume profiles from a lower timeframe. It is designed to help traders find potential areas where price may return to fill liquidity voids, and to provide extra detail about volume distribution inside each gap to assess strength and likely mitigation. The script automatically tracks each gap, updates its state over time, and can show which gaps are still unfilled or have been mitigated.
🟠 CONCEPTS
A Fair Value Gap is a zone between candles where no trades occurred, often seen as an inefficiency that price later revisits. The script checks each bar to see if a bullish (low above 2-bars-ago high) or bearish (high below 2-bars-ago low) gap has formed, and measures whether the gap’s size exceeds a threshold defined by a volatility-adjusted multiplier of past gap widths (to only detect significantly large gaps). Once a qualified gap is found, it gets recorded and visualized with a box that can stretch forward in time until filled. To add more context, a mini volume profile is built from a lower timeframe’s price and volume data, showing how volume is distributed inside the gap. The lowest-volume subzone is also highlighted using a sliding window scan method to visualise the true gap (area with least trading activity)
🟠 FEATURES
Visual gap boxes that appear automatically when bullish or bearish fair value gaps are detected on the chart.
Color-coded zones showing bullish gaps in one color and bearish gaps in another so you can easily see which side the gap favors.
Volume profile histograms plotted inside each gap using data from a lower timeframe, helping you see where volume concentrated inside the gap area.
Highlight of the lowest-volume subzone within each gap so you can spot areas price may target when filling the gap.
Dynamic extension of the gap boxes across the chart until price comes back and fills them, marking them as mitigated.
Customizable colors and transparency settings for gap boxes, profiles, and low-volume highlights to match your chart style.
Alerts that notify you when a new gap is created or when price fills an existing gap.
🟠 USAGE
This indicator helps you find and track unfilled price gaps that often act as magnets for price to revisit. You can use it to spot areas where liquidity may rest and plan entries or exits around these zones.
The colored gap boxes show you exactly where a fair value gap starts and ends, so you can anticipate potential pullbacks or continuations when price approaches them.
The intra-gap volume profile lets you gauge whether the gap was created on strong or thin participation, which can help judge how likely it is to be filled. The highlighted lowest-volume subzone shows where price might accelerate once inside the gap.
Traders often look for entries when price returns to a gap, aiming for a reaction or reversal in that area. You can also combine the mitigation alerts with your trade management to track when gaps have been closed and adjust your bias accordingly. Overall, the tool gives a clear visual reference for imbalance zones that can help structure trades around supply and demand dynamics.

The Great Anchors: Dual AVWAP Powered by RSI
The Great Anchors
*Dual Anchored Volume Weighted Average Price Powered by RSI*
---
📌 Overview
The Great Anchors is a dual AVWAP-based indicator that resets dynamically using RSI extremes — either from the current asset or a master symbol (e.g., BTCUSDT). It identifies meaningful shifts in price structure and momentum using these "anchored" levels.
It’s designed to help traders spot trend continuations, momentum inflection points, and entry signals aligned with overbought/oversold conditions — but only when the market confirms through volume-weighted price direction.
---
🛠 Core Logic
• AVWAP 1 (favwap): Anchored when RSI reaches overbought levels (top anchor)
• AVWAP 2 (savwap): Anchored when RSI reaches oversold levels (bottom anchor)
• AVWAPs are recalculated each time a new OB/OS condition is triggered — acting like "fresh anchors" at key market turning points.
---
⚙️ Key Features
🔁 Auto or Manual RSI Thresholds
→ Automatically determines dynamic RSI OB/OS levels based on past peaks and troughs, or lets you set fixed levels.
🧠 Master Symbol Control
→ Use the RSI of a separate asset (like BTCUSDT, ETHUSDT, SOLUSDT, BNBUSDT, SUPRAUSDT) or indices (like TOTAL, TOTAL2, BFR) to control resets — ideal for tracking how BTC/major coins impacts altcoins/others.
🔍 Trend-Filtering Signal Logic
→ Signals are filtered for less noise and are triggered when:
- Both AVWAPs are rising (bullish) or falling (bearish)
- Price action confirms the structure
🎯 Visual Markers & Alerts
→ "💥" for bullish signals and "🔥" for bearish ones. Alerts included for automation or push notifications.
---
🎯 How to Use It
1. Add the indicator to your chart.
2. Choose whether to use RSI from the current symbol or a master symbol (e.g., BTC).
3. Select auto-adjusted or manual OB/OS levels.
4. Watch for:
- AVWAP(s) making a significant change (at this point it's one of the AVWAPs resetting)
- Check if price flip it upwards or downwards
- If price goes above both AVWAPs thats a likely bullish trend
- If price can't go above both AVWAPs up and fall bellow both that's a likely bearish trend
- Price retesting upper AVWAP and bounce
- likely bullish continuation
- Price retesting lower AVWAP and dip
- likely bearish continuation
- Signal icons on chart ("💥 - Bullish" or "🔥- Bearish")
Best suited for:
• Swing traders
• Momentum traders
• Traders timing altcoin entries using BTC/Major asset's RSI
---
🔔 Signal Explanation
💥 Bullish Signal =
• Both AVWAPs rising
• Higher lows in price structure
• Bullish candle close
• Triggered from overbought RSI reset
🔥 Bearish Signal =
• Both AVWAPs falling
• Lower highs in price structure
• Bearish candle close
• Triggered from oversold RSI reset
Signals reset by opposite signals to prevent noise or overfitting.
---
⚠️ Tips & Notes
• Use AVWAPs as dynamic support/resistance, even without signal triggers
• Pair with volume or divergence tools for stronger confirmation
---
🧩 Credits & Philosophy
This tool is built with a simple philosophy:
"Anchor your trades to meaningful moments in price — not arbitrary time."
The dual AVWAP concept helps you see how price reacts after momentum peaks, giving you a cleaner bias and more precise trade setups.
---

Automated Scalping Signals with TP/SL Indicator [QuantAlgo]🟢 Overview
The Automated Scalping Signals with Take Profit & Stop Loss Indicator is a multi-timeframe trading system that combines market structure analysis with directional bias filtering to identify potential scalping opportunities. It detects Points of Interest (POI) including Fair Value Gaps (FVG) and Order Blocks (OB) while cross-referencing entries with higher timeframe exponential moving average positioning to create systematic entry conditions.
The indicator features adaptive timeframe calculations that automatically scale analysis periods based on your chart timeframe, maintaining consistent analytical relationships across different trading sessions. It provides integrated trade management with stop loss calculation methods, configurable risk-reward ratios, and real-time performance tracking through dashboard displays showing trade statistics, bias direction, and active position status.
This advanced system is designed for low timeframe trading, typically performing optimally on 1 to 15-minute charts across popular instruments such as OANDA:XAUUSD , CME_MINI:MES1! , CME_MINI:ES1! , CME_MINI:MNQ1! , CBOT_MINI:YM1! , CBOT_MINI:MYM1! , BYBIT:BTCUSDT.P , BYBIT:ETHUSDT.P , or any asset and timeframe of your preference.
🟢 How It Works
The indicator operates using a dual-timeframe mathematical framework where higher timeframe exponential moving averages establish directional bias through cross-over analysis, while simultaneously scanning for specific market structure patterns on the POI timeframe. The timeframe calculation engine uses multiplication factors to determine analysis periods, ensuring the bias timeframe provides trend context while the POI timeframe captures structural formations.
The structural analysis begins with FVG detection, which systematically scans price action to identify imbalances where gaps exist between consecutive candle ranges with no overlapping wicks. When such gaps are detected, the algorithm measures their size against minimum thresholds to filter out insignificant formations. Concurrently, OB recognition analyzes three-candle sequences, examining specific open/close relationships that indicate potential institutional accumulation zones. Once these structural patterns are identified, the algorithm cross-references them against the higher timeframe bias direction, creating a validation filter that only permits entries aligned with the prevailing EMA cross-over state. When price subsequently intersects these validated POI zones, entry signals generate with the system calculating entry levels at zone midpoints, then applying the selected stop loss methodology combined with the configured risk-reward ratio to determine take profit placement.
To mirror realistic trading conditions, the indicator incorporates configurable slippage calculations that account for execution differences between intended and actual fill prices. When trades reach their take profit or stop loss levels, the algorithm applies slippage adjustments that worsen the exit prices in a conservative manner - reducing take profit fills and increasing stop loss impact. This approach ensures backtesting results reflect more realistic performance expectations by accounting for spread costs, market volatility during execution, and liquidity constraints that occur in live trading environments.
It also has a performance dashboard that continuously tracks and displays comprehensive trading metrics:
1/ Bias TF / POI TF: Displays the calculated timeframes used for bias analysis and POI detection, showing the actual periods (e.g., "15m / 5m") that result from the multiplier settings to confirm proper adaptive timeframe selection
2/ Bias Direction: Shows current market trend assessment (Bullish, Bearish, or Sideways) derived from EMA cross-over analysis to indicate which trade directions align with prevailing momentum
3/ Data Processing: Indicates how many price bars have been analyzed by the system, helping users verify if complete historical data has been processed for comprehensive strategy validation
4/ Total Trades: Displays the cumulative number of completed trades plus any active positions, providing volume assessment for statistical significance of other metrics
5/ Wins/Losses: Shows the raw count of profitable versus unprofitable trades, offering immediate insight into strategy effectiveness frequency
6/ Win Rate: Reveals the percentage of successful trades, where values above 50% generally indicate effective entry timing and values below suggest strategy refinement needs
7/ Total R-Multiple: Displays cumulative risk-reward performance across all trades, with positive values demonstrating profitable system operation and negative values indicating net losses requiring analysis
8/ Average R Win/Loss: Shows average risk-reward ratios for winning and losing trades separately, where winning averages approaching the configured take profit ratio indicate minimal slippage impact while losing averages near -1.0 suggest effective stop loss execution
9/ TP Ratio / Slippage: Displays the configured take profit ratio and slippage settings with calculated performance impact, showing how execution costs affect actual versus theoretical returns
10/ Profit Factor: Calculates the ratio of total winning amounts to total losing amounts, where values above 1.5 suggest robust profitability, values between 1.0-1.5 indicate modest success, and values below 1.0 show net losses
11/ Maximum Drawdown: Tracks the largest peak-to-trough decline in R-multiple terms, with smaller negative values indicating better capital preservation and risk control during losing streaks
🟢 How to Use
Start by applying the indicator to your chart and observe its performance across different market conditions to understand how it identifies bias direction and POI formations. Then navigate to the settings panel to configure the Bias Timeframe Multiplier for trend context sensitivity and POI Timeframe Multiplier for structural analysis frequency according to your trading preference and objectives.
Next, fine-tune the EMA periods in Bias Settings to control trend detection sensitivity and select your preferred POI types based on your analytical preference. Proceed to configure your Risk Management approach by selecting from the available stop loss calculation methods and setting the Take Profit ratio that aligns with your risk tolerance and profit objectives. Complete the setup by customizing Display Settings to control table visibility and trade visualization elements, adjusting UI positioning and colors for optimal chart readability, then activate Alert Conditions for automated notifications on trade entries, exits, and bias direction changes to support systematic trade management.
🟢 Examples
OANDA:XAUUSD
CME_MINI:MES1!
CME_MINI:ES1!
CME_MINI:MNQ1!
CBOT_MINI:YM1!
BYBIT:BTCUSDT.P
BINANCE:SOLUSD
*Disclaimer: Past performance is not indicative of future results. None of our statements, claims, or signals from our indicators are intended to be financial advice. All trading involves substantial risk of loss, not just upside potential. Users are highly recommended to carefully consider their financial situation and risk tolerance before trading.

Machine Learning Key Levels [AlgoAlpha]🟠 OVERVIEW
This script plots Machine Learning Key Levels on your chart by detecting historical pivot points and grouping them using agglomerative clustering to highlight price levels with the most past reactions. It combines a pivot detection, hierarchical clustering logic, and an optional silhouette method to automatically select the optimal number of key levels, giving you an adaptive way to visualize price zones where activity concentrated over time.
🟠 CONCEPTS
Agglomerative clustering is a bottom-up method that starts by treating each pivot as its own cluster, then repeatedly merges the two closest clusters based on the average distance between their members until only the desired number of clusters remain. This process creates a hierarchy of groupings that can flexibly describe patterns in how price reacts around certain levels. This offers an advantage over K-means clustering, since the number of clusters does not need to be predefined. In this script, it uses an average linkage approach, where distance between clusters is computed as the average pairwise distance of all contained points.
The script finds pivot highs and lows over a set lookback period and saves them in a buffer controlled by the Pivot Memory setting. When there are at least two pivots, it groups them using agglomerative clustering: it starts with each pivot as its own group and keeps merging the closest pairs based on their average distance until the desired number of clusters is left. This number can be fixed or chosen automatically with the silhouette method, which checks how well each point fits in its cluster compared to others (higher scores mean cleaner separation). Once clustering finishes, the script takes the average price of each cluster to create key levels, sorts them, and draws horizontal lines with labels and colors showing their strength. A metrics table can also display details about the clusters to help you understand how the levels were calculated.
🟠 FEATURES
Agglomerative clustering engine with average linkage to merge pivots into level groups.
Dynamic lines showing each cluster’s price level for clarity.
Labels indicating level strength either as percent of all pivots or raw counts.
A metrics table displaying pivot count, cluster count, silhouette score, and cluster size data.
Optional silhouette-based auto-selection of cluster count to adaptively find the best fit.
🟠 USAGE
Add the indicator to any chart. Choose how far back to detect pivots using Pivot Length and set Pivot Memory to control how many are kept for clustering (more pivots give smoother levels but can slow performance). If you want the script to pick the number of levels automatically, enable Auto No. Levels ; otherwise, set Number of Levels . The colored horizontal lines represent the calculated key levels, and circles show where pivots occurred colored by which cluster they belong to. The labels beside each level indicate its strength, so you can see which levels are supported by more pivots. If Show Metrics Table is enabled, you will see statistics about the clustering in the corner you selected. Use this tool to spot areas where price often reacts and to plan entries or exits around levels that have been significant over time. Adjust settings to better match volatility and history depth of your instrument.

RTH Standard Deviation+RTH Standard Deviation+ Indicator
Overview
The RTH Standard Deviation+ (RTH SD+) indicator is a versatile tool designed for traders to visualize key price levels based on the Regular Trading Hours (RTH) session.
It calculates and displays the high, low, equilibrium (midpoint), and standard deviation-based levels derived from the RTH session's price range.
This indicator is ideal for day traders and swing traders looking to identify potential support, resistance, and breakout zones.
Features
Customizable Session Window: Define the RTH session based on your preferred time window and timezone.
Key Price Levels: Displays high, low, equilibrium, 25%/75% quartile levels, and standard deviation levels (±0.5, ±1.0, ±1.33, ±1.66, ±2.0, and optional extended levels up to ±4.0).
Visual Elements: Includes horizontal lines, labels, boxes, and vertical lines to highlight key levels and session boundaries.
Flexible Styling: Customize line styles, colors, thicknesses, and visibility for all elements.
Extended Levels: Optional display of additional standard deviation levels (±2.25, ±2.33, ±2.5, ±2.66, ±2.75, ±3.0, ±3.25, ±3.33, ±3.5, ±3.66, ±3.75, ±4.0).
Deviation Boxes: Visualize specific standard deviation ranges (±0.1, ±1.33/1.66, ±2.33/2.66, ±3.33/3.66) with customizable colors.
Inputs
Session Window: Set the RTH session time (default: 06:00–09:00).
Timezone: Select the appropriate timezone (default: UTC-4).
Label Offset: Adjust the horizontal offset for price level labels (default: 5 bars).
Line Offset: Set the length of horizontal lines extending from the session end (default: 20 bars).
Show SD Levels: Toggle visibility of standard deviation lines (±0.5, ±1.0, ±1.33, ±1.66, ±2.0).
Show SD Labels: Enable or disable labels for standard deviation levels.
Show SD Boxes: Display shaded boxes for specific standard deviation ranges (e.g., ±1.33/1.66).
Show ±0.1 Dev Boxes: Highlight smaller deviation ranges (±0.1) with boxes.
Vertical Line: Toggle a vertical line at the session end, with customizable color, style, and thickness.
High/Low, Equilibrium, 25%/75%, ±0.1 Dev, ±1.33/1.66: Toggle visibility and customize colors, styles, and thicknesses for these levels.
Extended Levels: Enable additional standard deviation levels (e.g., ±2.25, ±2.5, etc.) for advanced analysis.
How It Works
Session Tracking: The indicator identifies the user-defined RTH session based on the specified time window and timezone.
It tracks the high, low, and equilibrium (midpoint) of the session's price action.
Price Range Calculation: At the session's end, the indicator calculates the price range (high - low) and uses it to compute standard deviation levels relative to the high, low, or equilibrium.
Level Visualization:
High/Low Lines: Display the session's high and low prices as horizontal lines, extended beyond the session end.
Equilibrium Line: Shows the midpoint of the session range.
Quartile Lines: Plots 25% and 75% levels within the session range.
Standard Deviation Lines: Displays levels at ±0.5, ±1.0, ±1.33, ±1.66, and ±2.0 standard deviations, with optional extended levels up to ±4.0.
Deviation Boxes: Shaded boxes highlight specific ranges (e.g., ±1.33/1.66) for quick reference.
±0.1 Deviation Lines/Boxes: Optional smaller deviation levels for precise analysis.
Dynamic Updates: During the session, high and low lines update in real-time. At session end, all levels are finalized and extended forward for post-session analysis.
Clearing Mechanism: When a new session begins, previous drawings are cleared to avoid clutter.
Usage
Add to Chart: Apply the indicator to your TradingView chart via the Pine Editor or Indicator menu.
Configure Settings:
Adjust the session window and timezone to match your market (e.g., 09:30–16:00 UTC-4 for US equities RTH).
Customize visibility, colors, styles, and thicknesses to suit your chart preferences.
Enable extended levels for deeper analysis or disable them for simplicity.
Interpret Levels:
High/Low: Act as potential support/resistance or breakout levels.
Equilibrium: Represents the session's midpoint, often a pivot point.
25%/75% Quartiles: Indicate intermediate levels within the session range.
Standard Deviation Levels: Highlight statistically significant price zones for potential reversals or breakouts.
Boxes: Emphasize key zones for quick visual reference.
Trading Application: Use levels to identify entry/exit points, set stop-losses, or gauge market volatility.
For example, ±1.0 standard deviation levels often act as strong support/resistance, while ±2.0 levels may indicate overextension.
Notes
Ensure the session window aligns with the market’s trading hours for accurate calculations.
The indicator is designed for intraday and post-session analysis but can be adapted for other timeframes.
Use in conjunction with other technical analysis tools for comprehensive decision-making.
Extended levels (±2.25 and beyond) are disabled by default to reduce chart clutter but can be enabled for specific strategies.
TradingView House Rules Compliance
This indicator contains no copyrighted material and adheres to TradingView’s Pine Script guidelines.
This indicator was approved and created with @TIMELESS1_

Xcalibur Signals & Alerts [AlgoXcalibur]An advanced trend-following algorithm forged to empower retail traders with an edge.
Xcalibur Signals & Alerts is a sophisticated, multi-layered algorithm designed to consistently deliver real-time trend signals—without clutter or unnecessary complexity. The system combines refined trend-following logic with breakout detection, flat-market filtration, false signal failsafes, take profit cues, live alerts, and more — all in a visually simple, easy-to-use indicator built for all assets, timeframes, and market conditions.
🧠 Algorithm Logic
Xcalibur Signals & Alerts operates on a systematic framework that evaluates multiple technical dimensions in harmony—directional alignment, momentum confirmation, relative strength, volume bias, breakout detection, Fibonacci calculations, and more. Rather than reacting to isolated triggers, it filters every opportunity through a multi-layered confirmation engine. It doesn’t just react to every move—it evaluates them. This cohesive approach ensures that each signal results from aligned conditions—not arbitrary thresholds. By combining structural awareness with adaptive filtering, Xcalibur maintains clarity and consistency across a wide range of market environments—delivering actionable signals without unnecessary noise or lag.
⚙️ User-Adjustable Features
• Adjustable Sensitivity:
Choose from 5 pre-tuned Signal Trigger Settings and 3 dynamic Confirmation Filter Modes to tailor the system to your trading style, asset, and timeframe. Candle color reflects the active trigger condition, while an adaptive cyan line displays the selected Confirmation Filter—blocking signals until the filter threshold is crossed.
• Directional Stability Filter: When enabled, this filter uses mean-reversion calculations to determine directional bias and block unreliable signals during choppy, indecisive price action. A magenta line represents this filter threshold and provides higher-confidence signals during periods of low directional conviction.
• Pullback Allowance Filter:
When enabled, this unique filter uses Fibonacci ratios to deliberately block signals from temporary pullbacks during strong trend periods. A green (uptrend) or red (downtrend) line marks the active pullback allowance zone.
• False Signal Failsafe
:
Two selectable modes:
Simple — Cancels the signal if price breaks the signal candle’s high or low.
Advanced — Requires both a price break and opposing momentum confirmation.
When triggered, the system plots a white “X” signal, turns candles gray, disables the background color, sends an alert (if enabled), and enters standby mode until a valid trend condition re-emerges.
• Reaction Zones:
Identifies probable reversal or breakout zones based on recent price action patterns. A yellow line appears when active, with a yellow caution flag plotted if the price reaches this critical area.
• Take-Profit Cues
: Automatically detects potential trend exhaustion using price action structure and momentum shifts. When triggered, a visual “TP” marker is plotted—advising traders to manage profits or prepare for a possible reversal.
• Trailing Stop:
Plots a dynamic, percentage-based trailing stop or trailing take-profit using your selected input. Adjust it to suit your risk tolerance and asset.
• Multi-Timeframe Monitor
: Displays real-time trend direction across 1m, 2m, 5m, 15m, 1H, 4H, and 1D timeframes in a compact, easy-to-read table.
• Alert System
:
Receive desktop and/or mobile alerts for:
* New trend signals
* Failsafe triggers
* 9:00 AM Morning Greeting messages with auto re-arming confirmation
(Alerts are limited to 9:00 AM – 4:00 PM Eastern Time)
• SuperCandles
: Highlights strong momentum moves with a stunning and easily recognizable glow effect.
• Color-Coded Candles & Background
: Candles reflect the current trigger condition, while the background tint tracks the most recent trend—enhancing situational awareness.
*All input settings include tooltips to guide users through setup and interpretation.
⚔️ Not Just Another Signal Tool
Xcalibur Signals & Alerts was built from the ground up to empower retail traders with access to a cohesive, structured algorithmic system—one that reflects the kind of awareness, discipline, and market adaptability found in professional-grade algorithms.
This is not another oversensitive or under-responsive signal indicator that is limited to one specific type of market condition or trader. It does not utilize hyperactive triggers, rely on lagging crossover logic, or need infinitely adjustable and complex sensitivity settings. Instead of cluttered visuals to interpret, this indicator delivers a simple, easy-to-use tool—prioritizing clarity and usability without compromising on depth and sophistication.
Whether the market is trending, breaking out, or moving sideways, Xcalibur adapts—prioritizing trend stability, directional integrity, and visual clarity from one signal to the next.
⚠️ While the Xcalibur Signals & Alerts algorithm is immune to human emotion, you are not. Be mindful not to fall victim to costly emotions that can manipulate your judgment, and understand the unpredictable and complex nature of trading. No algorithm, strategy, or technique can deliver perfect accuracy, and Xcalibur Signals & Alerts is no exception. While AlgoXcalibur strives to be as accurate as possible, incorrect signals can and will occur. Xcalibur Signals & Alerts is a tool, not a guarantee. Users are fully responsible for making their own trading decisions, implementing proper risk management, and always trading responsibly.
🛡️ Wield Xcalibur as a standalone weapon or use it alongside other tools.
🔐 To get access or learn more, visit the Author’s Instructions section.

Momentum Trail Oscillator [AlgoAlpha]🟠 OVERVIEW
This script builds a Momentum Trail Oscillator designed to measure directional momentum strength and dynamically track shifts in trend bias using a combination of smoothed price change calculations and adaptive trailing bands. The oscillator aims to help traders visualize when momentum is expanding or contracting and to identify transitions between bullish and bearish conditions.
🟠 CONCEPTS
The core idea combines two methods. First, the script calculates a normalized momentum measure by smoothing price changes relative to their absolute values, which creates a bounded oscillator that highlights whether moves are directional or choppy. Second, it uses a trailing band mechanism inspired by volatility stops, where bands adapt to the oscillator’s volatility, adjusting the thresholds that define a shift in directional bias. This dual approach seeks to address both the magnitude and persistence of momentum, reducing false signals in ranging markets.
🟠 FEATURES
The momentum calculation applies Hull Moving Averages and double EMA smoothing to price changes, producing a smooth, responsive oscillator.
The trailing bands are derived by offsetting a weighted moving average of the oscillator by a multiple of recent momentum volatility. A directional state variable tracks whether the oscillator is above or below the bands, updating when the momentum crosses these dynamic thresholds.
Overbought and oversold zones are visually marked between fixed levels (+30/+40 and -30/-40), with color fills to highlight when momentum is in extreme areas. The script plots signals on both the oscillator pane and optionally overlays markers on the main price chart for clarity.
🟠 USAGE
To use the indicator, apply it to any symbol and timeframe. The “Oscillator Length” controls how sensitive the momentum line is to recent price changes—lower values react faster, higher values smooth out noise. The “Trail Multiplier” sets how far the adaptive bands sit from the oscillator mid-line, which affects how often trend state changes occur. When the momentum line rises into the upper filled area and then crosses back below +40, it signals potential overbought exhaustion. The opposite applies for the oversold zone below -40. The plotted trailing bands switch visibility depending on the current directional state: when momentum is trending up, the lower band acts as the active trailing stop, and when trending down, the upper band becomes active. Trend changes are marked with circular symbols when the direction variable flips, and optional overlay arrows appear on the price chart to highlight overbought or oversold reversals. Traders can combine these signals with their own price action or volume analysis to confirm entries or exits.

Stochastic SuperTrend [BigBeluga]🔵 OVERVIEW
A hybrid momentum-trend tool that combines Stochastic RSI with SuperTrend logic to deliver clean directional signals based on momentum turns.
Stochastic SuperTrend is a straightforward yet powerful oscillator overlay designed to highlight turning points in momentum with high clarity. It overlays a SuperTrend-style envelope onto the Stochastic RSI, generating intuitive up/down signals when a momentum shift occurs across the neutral 50 level. Built for traders who appreciate simplicity without sacrificing reliability.
🔵 CONCEPTS
Stochastic RSI: Measures momentum by applying stochastic calculations to the RSI curve instead of raw price.
SuperTrend Bands: Dynamic upper/lower bands are drawn around the smoothed Stoch RSI line using a user-defined multiplier.
Momentum Direction: Trend flips when the smoothed Stoch RSI crosses above/below the calculated bands.
Neutral Bias Filter: Directional arrows only appear when momentum turns above or below the central 50 level—adding confluence.
🔵 FEATURES
Trend Detection on Oscillator: Applies SuperTrend logic directly to the Stoch RSI curve.
Clean Entry Signals:
→ 🢁 arrow printed when trend flips bullish below 50 (bottom reversals).
→ 🢃 arrow printed when trend flips bearish above 50 (top reversals).
Custom Multiplier: Adjust sensitivity of SuperTrend band spacing around the oscillator.
Neutral Zone Highlight: Visual zone between 0–50 (green) and 50–100 (red) for quick momentum polarity reference.
Toggle SuperTrend Line: Option to show/hide the SuperTrend trail on the Stoch RSI.
🔵 HOW TO USE
Use 🢁 signals for potential bottom reversals when momentum flips bullish from oversold regions.
Use 🢃 signals for potential top reversals when momentum flips bearish from overbought areas.
Combine with price-based SuperTrend or support/resistance zones for confluence.
Suitable for scalping, swing trading, or momentum filtering across all timeframes.
🔵 CONCLUSION
Stochastic SuperTrend is a simple yet refined tool that captures clean momentum shifts with directional clarity. Whether you're identifying reversals, filtering entries, or spotting exhaustion in a trend, this oscillator overlay delivers just what you need— no clutter, just clean momentum structure.

Volatility-Adjusted Momentum Score (VAMS) [QuantAlgo]🟢 Overview
The Volatility-Adjusted Momentum Score (VAMS) measures price momentum relative to current volatility conditions, creating a normalized indicator that identifies significant directional moves while filtering out market noise. It divides annualized momentum by annualized volatility to produce scores that remain comparable across different market environments and asset classes.
The indicator displays a smoothed VAMS Z-Score line with adaptive standard deviation bands and an information table showing real-time metrics. This dual-purpose design enables traders and investors to identify strong trend continuation signals when momentum persistently exceeds normal levels, while also spotting potential mean reversion opportunities when readings reach statistical extremes.
🟢 How It Works
The indicator calculates annualized momentum using a simple moving average of logarithmic returns over a specified period, then measures annualized volatility through the standard deviation of those same returns over a longer timeframe. The raw VAMS score divides momentum by volatility, creating a risk-adjusted measure where high volatility reduces scores and low volatility amplifies them.
This raw VAMS value undergoes Z-Score normalization using rolling statistical parameters, converting absolute readings into standardized deviations that show how current conditions compare to recent history. The normalized Z-Score receives exponential moving average smoothing to create the final VAMS line, reducing false signals while preserving sensitivity to meaningful momentum changes.
The visualization includes dynamically calculated standard deviation bands that adjust to recent VAMS behavior, creating statistical reference zones. The information table provides real-time numerical values for VAMS Z-Score, underlying momentum percentages, and current volatility readings with trend indicators.
🟢 How to Use
1. VAMS Z-Score Bands and Signal Interpretation
Above Mean Line: Momentum exceeds historical averages adjusted for volatility, indicating bullish conditions suitable for trend following
Below Mean Line: Momentum falls below statistical norms, suggesting bearish conditions or downward pressure
Mean Line Crossovers: Primary transition signals between bullish and bearish momentum regimes
1 Standard Deviation Breaks: Strong momentum conditions indicating statistically significant directional moves worth following
2 Standard Deviation Extremes: Rare momentum readings that often signal either powerful breakouts or exhaustion points
2. Information Table and Market Context
Z-Score Values: Current VAMS reading displayed in standard deviations (σ), showing how far momentum deviates from its statistical norm
Momentum Percentage: Underlying annualized momentum displayed as percentage return, quantifying the directional strength
Volatility Context: Current annualized volatility levels help interpret whether VAMS readings occur in high or low volatility environments
Trend Indicators: Directional arrows and change values provide immediate feedback on momentum shifts and market transitions
3. Strategy Applications and Alert System
Trend Following: Use sustained readings beyond the mean line and 1σ band penetrations for directional trades, especially when VAMS maintains position in upper or lower statistical zones
Mean Reversion: Focus on 2σ extreme readings for contrarian opportunities, particularly effective in sideways markets where momentum tends to revert to statistical norms
Alert Notifications: Built-in alerts for mean crossovers (regime changes), 1σ breaks (strong signals), and 2σ touches (extreme conditions) help monitor multiple instruments for both continuation and reversal setups
