VCAI RSI Divergence +VCAI RSI Divergence+ is an RSI that shows trend, momentum, and divergence using V-CoresAI colour logic instead of a single white line.
What it shows:
Yellow RSI line → bullish momentum (RSI above its MA; buy-side pressure in control)
Purple RSI line → bearish momentum (RSI below its MA; sell-side pressure in control)
Thin blue line → fast RSI moving average that drives the colour flips
Dashed 70/30 lines → classic OB/OS zones
Background bands → soft purple in OB, soft yellow in OS to mark exhaustion areas
How to read it:
Yellow & rising → momentum shifting bullish; pullbacks into yellow OS band can be accumulation zones
Purple & falling → momentum shifting bearish; pushes into purple OB band can be distribution/sell zones
Hard colour flips (yellow ↔ purple) mark trend regime changes, not minor RSI noise
Divergence mode (on/off)
The divergence engine scans RSI and price pivot structure:
Bullish divergence (yellow) → price lower low + RSI higher low
Bearish divergence (purple) → price higher high + RSI lower high
Lines and tags appear only where a meaningful disagreement between price and RSI exists, giving early context for potential reversals or fade setups.
Together, the momentum colours + optional divergence mapping give a far clearer market read than a standard RSI, with zero clutter and no guesswork.
Marketstrength

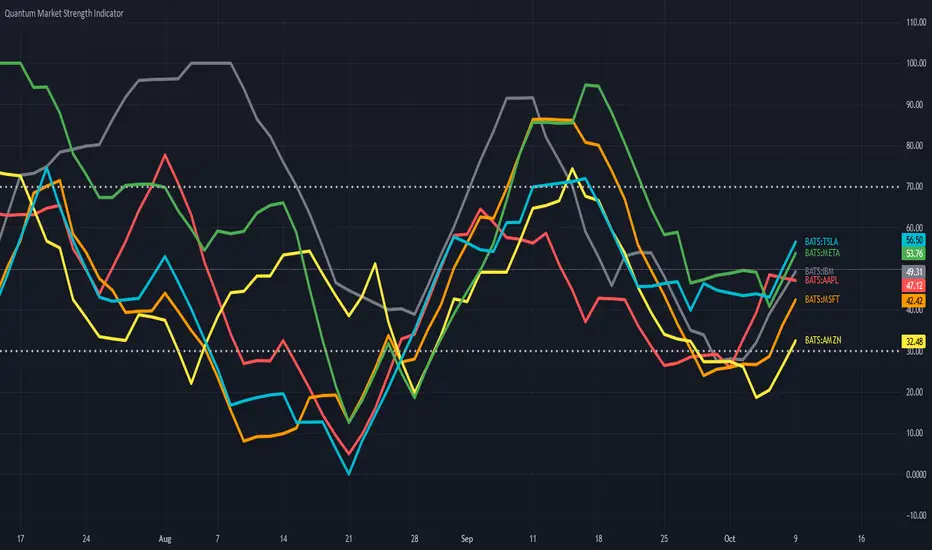
Quantum Market Strength Indicator (MSI)The Market Strength Indicator (MSI) is yet another in our stable of volume-based indicators, and as such, is a must-have tool for trading virtually any type of market and across a myriad of applications from trend trading to swing trading, scalping, and much more. While its sister indicator, the Currency Strength Indicator (CSI), helps you analyze which currencies are oversold, overbought, correlating, and trending, the MSI or Market Strength Indicator does this also, but in this case, for all markets, including stocks, ETFs, futures, and cryptocurrencies, but with one key difference – VOLUME.
As with our core methodology of volume price analysis, volume adds an entirely new dimension to trading analysis as it reveals the driving pressure behind the price action, be it strong or weak, which are all factored into the algorithm that drives the Market Strength Indicator. But with the MSI indicator, its use and application is only limited by your imagination.
For example, we can use it to see which markets are correlating and which are not so that we might use it as an intraday tool for index futures. And, of course, with knowledge gained from the stock trading and investing program, we could then further validate any analysis by setting each against the top five market cap stocks, for confirmation of strength and to give us more confidence in trading an index future.
And not just index futures, but any futures you care to consider, such as energy, metals, softs, currencies or anything else.
For day traders of stocks, you might wish to see which are correlating with one another and which are not, for example, if you are pairs trading, and also whether a particular stock is moving with the primary futures index. If not, this may be a warning sign. And of course, for ETF traders, we have the SPY, a host of ETFs, and alongside them, the sectors, such as the XLK, the XLE, and more, giving you an instant and powerful insight into sentiment across the entire market complex.
The Market Strength Indicator has much to offer; whether you are a stock investor or day trading scalper, index or ETF trader, swing trader or trend trader, it is all here as the indicator signals in a clear and intuitive way when a stock, future or ETF is overbought or oversold in all timeframes, giving you that potent insight into potential reversals from strong to weak and back again. If you enjoy getting into a trend early and trading reversals, then this is the indicator for you, but if you prefer trading trends – no problem, just jump aboard once the move has some momentum and is underway as displayed by the steepness of the line on the indicator.
It’s all here and so much more, from market correlations to market strength and weakness and in all the timeframes from seconds to months.
And just like its sister indicator, the CSI, the MSI is an oscillator that moves seamlessly from overbought to oversold and back again between a value of 100 at the top and zero at the bottom, with each instrument or market represented with a single-colored line. To help further, we’ve included two regions on the indicator to represent these states at 70 and 30, respectively, but you can change these accordingly and perhaps extend them further to 80 and 20. These levels are purely intended as guides to help provide additional information as to the market state and a potential reversal in due course.
Now, in a single indicator, you have the opportunity to gauge sentiment across multiple markets, whether these are correlating or not, and from there develop a myriad of trading opportunities, or alternatively give you that all-important confidence to dive in, or maintain an existing position. Through its unique algorithm based on volume, it is another indicator only limited by your imagination, and like all our other indicators, one we urge you to use in multiple timeframes.
Simple Dominance Momentum IndicatorThe Simple Dominance Momentum Indicator is a powerful tool for tracking market trends in the world of cryptocurrency. By analyzing the relationship between dominance and market movement, this indicator helps traders identify when money is flowing into or out of the market.
Using the pane structure on TradingView, the Dominance Momentum Indicator makes it easy to visualize and track data from CryptoCap charts. Whether you're a seasoned investor or starting out, this indicator can help you make more informed trading decisions.
All this indicator does is create the pane with a line chart using the Dominance charts to allow you to see the data with one button instead of doing it all manually. However with the addition to allow it to toggle between crypto and stables, so if you are using a /BTC pair, you don't have to add a new pane on, it automatically converts. If you are looking at USDT pairs for example, it will highlight that one for you.
While it can work under any conditions, the Dominance Momentum Indicator is particularly effective on higher timeframes, providing valuable insight into the overall plot of the market trend. With a 55EMA and a faster-moving average of 21EMA, this indicator is designed to help you stay ahead of the curve and make smarter trading decisions.
Remember the golden rule for stablecoin dominance. Down = good, and up = bad; however, you can just invert the indicator, so it flows with the market.
When it comes to the dominance of individual cryptocurrencies, for example, DOT.D, you might find that it going up = increasing dominance is STRENGTH. If the dominance of that is increasing it means it's growing.
Creator Credit: Jamie Goodland

(FireflyTA) Algo Score MTFAlgo Score MTF
The Algo Score MTF is a meta-analytic oscillator telling you about the technical market strength . It is analyzing a variety of different indicators and metrics to come up with a score that gives you an impression on whether the medium timeframes have fuel to go higher or if it's running out and the risk increases to see corrective price action.
----------------------
About Technical Market Strength
Algo measures the technical strength with a score between -10 and 10 . A bullish or bearish technical market strength shows a high correlation with bullish or bearish PA soon after the score reaches the significant levels deviating from 0. However, optimal treshold values (meaning the score after which the strength can be considered bullish or bearish) vary depending on the market looked at. For BTCUSD, the default values used can be seen as reference. If you want to apply Algo to other markets, you will have to calibrate the tresholds yourself.
It is important to know that market strength is the fuel to drive price higher or lower, but it is not the trigger. The trend is of superior importance. So when price is in a strong uptrend (in this case on the MTF), and the score reaches a value of -4 or lower (which can be considered bearish), it can still take a while for the trend to shift because of the strong momentum. The score in this case can be used as an indicator to show you times when it is wise to take profits / de-risk or take extra care in your risk management in general.
----------------------
Indicators used
All the indicators mentioned are calculated separately and weighted by the significance value you can customize in the indicator UI. It is also possible to (1) deactivate certain indicators and (2) force them as required, so that a signal in the oscillator only occurs when the indicator(s) that is/are required support the thesis (bullish vs. bearish).
Daily VWAP
MTF Trend
Traditional Bollinger Bands
RSI
MTF RSI Divergence
Stoch RSI
Ichimoku Cloud
Fib Retracement Levels
MACD
TTM Squeeze
Moneyflow
Custom Levels you can define (3 categories: Major, medium, minor)
For some indicators, there are specific settings to customize how they contribute to the overall score (i.e. MACD cross vs. shift vs. trending phase). It is also important to know that Algo fetches the indicator data from multiple timeframes, thereby adding reliability to the overall results.
----------------------
Algo Custom Logic
Algo is using my custom logic on when a certain indicator can be interpreted as bullish or bearish in the MTF horizon. If you want to find out about the reliability of certain indicators, I recommend disabling all the indicators except for the one you want to examine, and then see how the score reacts to price action.
----------------------
Timeframes
Due to script limitations, this version can only analyze the medium timeframes . It is best used with charts 2H+, it works on some 90m as well but ceases to work at 1H and below . It is also not compatible with higher timeframes . Upon using the same settings on the same ticker with different timeframes, you will see that the score shows a minor variance. This is because data is consolidated to match the timeframe, so it ultimately leads to minor differences. Find out for yourself what timeframe is the best to use with which market and which settings.
----------------------
How to Use
I'm going to add tooltips for the settings in the indicator UI with upcoming updates, so it becomes more clear on how to set Algo up properly. To prevent a loss of your customized settings, write them down somewhere in case a script update reverts the settings back to default.
You can find in-depth tutorials on how to use this indicator by browsing the links and resources in my signature.

Stock Market Sherpa by Keiron RichieThis indicator is tested with 15minute charts to provide indication of relative strength, stochastic and market strength displayed as a combined oscillator with buy and sell alerts, in the form of an awesome mountain range. Use of these indicators is at your own risk.

Market Index Strength by Keiron RichieBy combining the true strength of the Nasdaq (NDX) and S&P500 (SPY) we can then compare that against the volatility /fear index (VIX). The true strength of the Volatility Index (VIX) is shown by the red area and the Nasdaq (NDX) and S&P500 (SPY) by the silver/teal areas.
The yellow EMA line shows the average difference between the VIX and the NDX/SPY indexes. When the yellow line crosses above the zero line and is climbing it means that the NDX/SPY are strengthening. When the yellow line is decreasing or crosses under the zero line it means the fear (VIX) is becoming stronger and NDX/SPY are weakening.
When looking at charts of companies/components listed on the Nasdaq and/or S&P 500 you will notice a frequent correlation between the movement of the yellow line depicting index health and the strength of the chart you are viewing. It’s a very quick and effective method of seeing the strength and fear within the market indexes and how they are effecting your chart.
The background color changes based on the market strength combined with the active symbol true strength. Green is a buy zone, Red is a sell zone.
It is tested and works well on all timeframes with Stocks listed on NASDAQ & S&P500. It does not include buy/sell alerts.

Supertrend, MA & Market Strength by Keiron RichieThis script comprises of three separate indicators to give an improved view; a redesign of the Supertrend indicator to identify up/down trend and changes the background colour to red or green accordingly. This is then overlayed with the Mother of Adaptive Moving averages by John Ehlers (MAMA) which adapts to price movement in an entirely new and unique way. The advantage of this method of adaptation is that it features a fast attack average and a slow decay average so that composite average rapidly ratchets behind price changes and holds the average value until the next ratchet occurs. Since the average fallback is slow I can build trading systems that are virtually free of whipsaw trades.
Additionally, there are up & down arrows below and above the bars respectively which demonstrate overall market strength or weakness. By combining the relative strength in a trend with the true strength of the Nasdaq (NDX) and S&P500 (SPY) we can then compare that against the volatility/fear index (VIX) to show if the market is excerpting pressure on the component in either direction. i.e. if the red arrow shows then the market indexes true strength is decreasing & if the small green arrow shows then the market index is gaining strength which may be likely to impact the component/symbol you are viewing. It’s a very quick and effective method of seeing the strength within the market indexes and how they are effecting your chart.
Because of the nature of the script it is tested and works well on all timeframes with Stocks listed on NASDAQ & S&P500.
Alerts are available for a change of background colour state. i.e Green=Buy, Red=Sell
