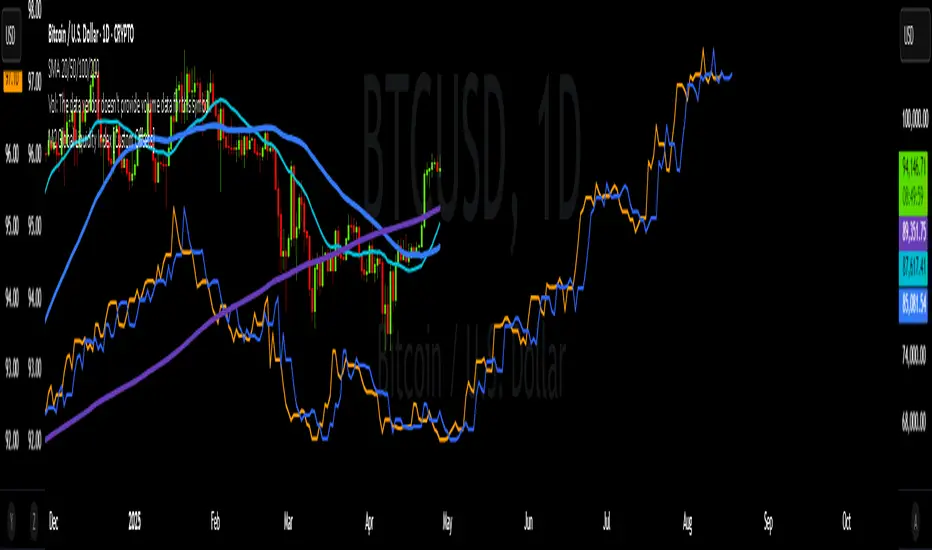
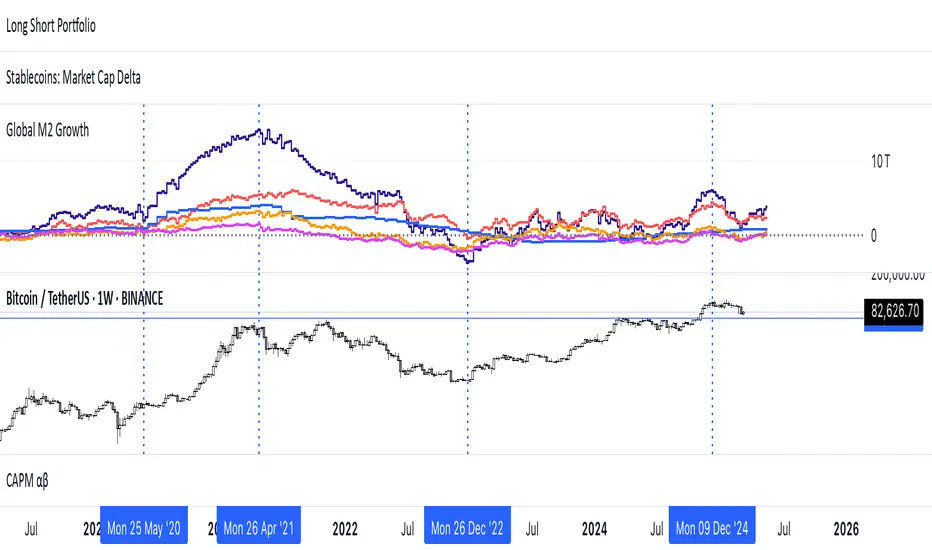
Central Bank Liquidity Gap IndicatorThis indicator measures the gap between global liquidity growth and stock market growth to identify potential buying opportunities.
Liquidity drives markets. When central banks print money, that liquidity eventually flows into stocks and other assets. If we spot when liquidity growth is outpacing market growth, we can spot moments when the market is "due" to catch up.
I like this quote:
Earnings don't move the overall market; it's the Federal Reserve Board... focus on the central banks and
M2
Blockcircle Global Central Bank Balance Sheet and Money SupplyOVERVIEW
This indicator aggregates money supply (M2) and central bank balance sheet data from the world's largest economies into a single, unified view of global liquidity conditions. Rather than manually tracking dozens of separate data feeds or building your own aggregation logic, you get a ready-to-use tool that pulls from FRED, TradingView Economics, and real-time FX rates to convert everything into USD terms automatically.
Global liquidity has historically served as a leading indicator f
Indicador
Liquidity Regime OscillatorThe Liquidity Signal Line is a macro-driven confirmation tool designed to capture the underlying global liquidity regime in a single, smoothed oscillator. It measures the combined directional flow of monetary and financial conditions using high-impact macro data: Federal Reserve assets (WALCL), Treasury General Account (TGA), and the Overnight Reverse Repo facility (RRP) – adjusted by key market proxies such as the U.S. Dollar Index, credit spreads (HYG/LQD), and equity risk appetite (SPHB/SPHQ)
Indicador
[c3s] CWS - M2 Global Liquidity Index & BTC Correlation CWS - M2 Global Liquidity Index with Offset BTC Correlation
This custom indicator visualizes and analyzes the relationship between the global M2 money supply and Bitcoin (BTC) price movements. It calculates the correlation between these two variables to provide insights into how changes in global liquidity may impact Bitcoin’s price over time.
Key Features:
Global M2 Liquidity Index Calculation:
Fetches M2 money supply data from multiple economies (China, US, EU, Japan, UK) and nor
Indicador
SulLaLuna — HTF M2 x Ultimate BB (Fusion) 🌕 **SulLaLuna — HTF M2 x Ultimate BB (Fusion)** 🚀💵
**By SulLaLuna Trading**
(Portions of the Bollinger Band logic adapted with permission/credit from the *Ultimate Buy & Sell Indicator* by its original author — thank you for the brilliance!)
---
🧭 **What This Is**
This is not just another price-following tool.
This is **a macro liquidity detector** — a **Daily Higher Timeframe Hull Moving Average of the Global M2 Money Supply**, smoothed via lower timeframe candles (default 5m, 48 Hull len
Indicador
DECODE Global Liquidity IndexDECODE Global Liquidity Index 🌊
The DECODE Global Liquidity Index is a powerful tool designed to track and aggregate global liquidity by combining data from the world's 13 largest economies. It offers a comprehensive view of financial liquidity, providing crucial insights into the underlying currents that can influence asset prices and market trends.
The economies covered are: United States, China, European Union, Japan, India, United Kingdom, Brazil, Canada, Russia, South Korea, Australia, M
Indicador
Global M2 Money Supply Top20 + Offset & WaveThe M2 Top20 is a global aggregation of the M2 money supply from the 20 largest economies in the world , providing a comprehensive view of the total liquidity in the global financial system. It is expressed in trillions of USD.
This script calculates and visualizes the M2 Money Supply of the Top 20 Global Economies, adjusted to various timeframes (4H, 1D, 1W, 1M) with customizable offset adjustments (in days) from -1000 days to +1000 days. This indicator includes data from the Americas, E
Indicador
My-Indicator - Global Liquidity & Money Supply M2 + Time OffsetThis script is designed to visualize a global liquidity and money supply index by combining data from various regions and, optionally, central bank activity. Visualizing this data on a chart allows you to see how central banks are intervening in the financial system and how the total amount of money in the economy is changing. Let’s take a look at how it works:
Central Bank Liquidity
Shows the actions of central banks (e.g. FED, ECB) providing short-term cash to commercial banks. If you see s
Indicador
M2 Global Liquidity Index [Custom Offsets]M2 Global Liquidity Index
Plots the global M2 money supply alongside price, with two user-configurable forward shifts to help you anticipate macro-driven moves in BTC (or any asset).
Key Features
Current M2 Index (no offset)
Offset A — shift M2 forward by N days (default 78)
Offset B — shift M2 forward by M days (default 109)
Extended Currencies toggle adds 9 additional central banks (CHF, CAD, INR, RUB, BRL, KRW, MXN, ZAR)
All lines share the left-hand axis and scale to trillions
Input
Indicador
Global M2 [BizFing]MARKETSCOM:BITCOIN ECONOMICS:USM2
This is an indicator designed to show the correlation between the global M2 money supply and Bitcoin.
This indicator basically provides a Global M2 index by summing the M2 money supply data from the United States, South Korea, China, Japan, the EU, and the United Kingdom.
Furthermore, it is configured to allow you to add or remove the M2 data of desired countries within the settings.
I hope this proves to be a small aid in predicting the future price of
Indicador
M2 Liqudity WaveGlobal Liquidity Wave Indicator (M2-Based)
The Global Liquidity Wave Indicator is designed to track and visualize the impact of global M2 liquidity on risk assets—especially those highly correlated to monetary expansion, like Bitcoin, MSTR, and other macro-sensitive equities.
Key features include:
Leading Signal: Historically leads Bitcoin price action by approximately 70 days, offering traders and analysts a forward-looking edge.
Wave-Based Projection: Visualizes a "probability cloud"—a
Indicador
M2 Global Liquidity Index [Extended + Offset]M2 Global Liquidity Index
This indicator visualizes global M2 money supply, weighted in USD, based on major economic regions.
Features:
Standard Mode: Includes M2 data from the USA, China, Eurozone, Japan, and the UK.
Extended Mode: Adds Switzerland, Canada, India, Russia, Brazil, South Korea, Mexico, and South Africa.
Offset Function: Adjustable time lag (78 or 108 days) to analyze the delayed impact of liquidity on financial markets.
Use Case:
Designed to help identify glo
Indicador
Global M2 Money Supply (USD) GrowthThe Global M2 Growth indicator evaluates the total liquid money supply, including cash, checking deposits, and assets that can be easily converted to cash. It reflects changes in global liquidity by tracking year-on-year (YoY) changes in the Global M2 money supply rather than its absolute value. This approach highlights the velocity of liquidity expansion or contraction, offering a clearer understanding of its correlation with asset performance, such as Bitcoin.
How It Works
When the Glob
Indicador
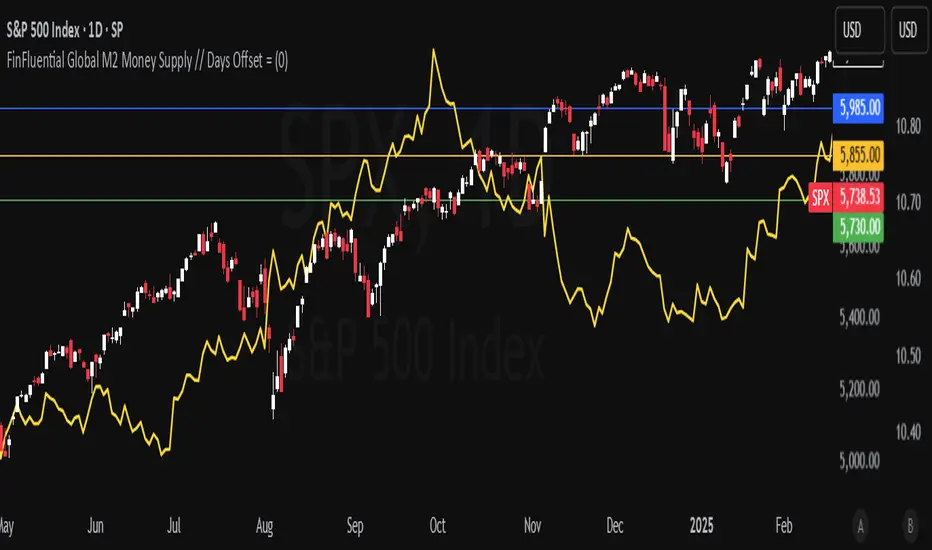
FinFluential Global M2 Money Supply // Days Offset =The "Global M2 Money Supply" indicator calculates and visualizes the combined M2 money supply from multiple countries and regions worldwide, expressed in trillions of USD.
M2 is a measure of the money supply that includes cash, checking deposits, and easily convertible near-money assets. This indicator aggregates daily M2 data from various economies, converts them into a common USD base using forex exchange rates, and plots the total as a single line on the chart.
It is designed as an overla
Indicador
Excess Liquidity IndicatorExcess Liquidity Indicator
This script visualizes excess liquidity trends in relation to risk assets. It estimates excess liquidity by combining various macroeconomic factors such as WW M2 money supply, central bank balance sheets, and interest rates, oil, and the dollar index, and it substracts WW GDP. The tool helps traders analyze liquidity-driven market trends in a structured manner.
Note: This script is for research purposes only and does not provide financial advice.
I cannot point names
Indicador
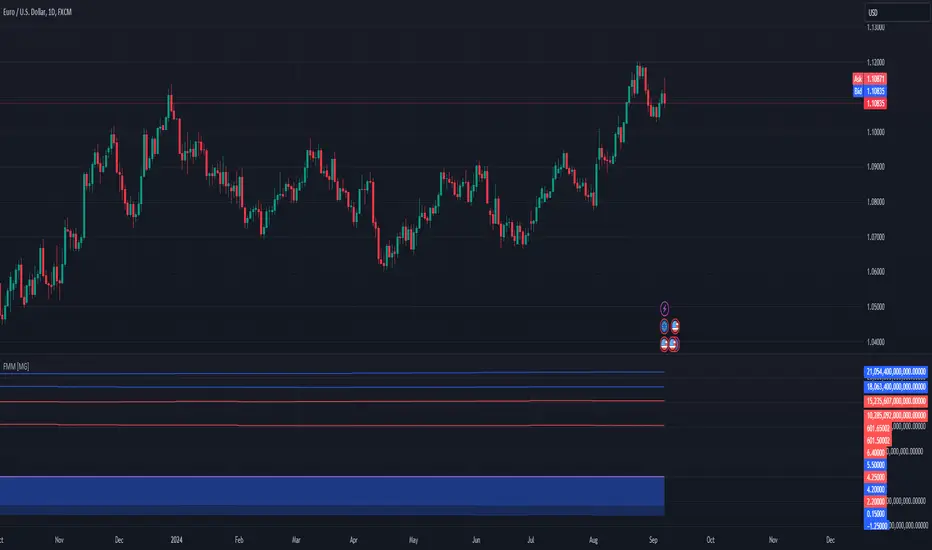
Forex Macro Metrics [MacroGlide]"Forex Macro Metrics " is a powerful tool for analyzing macroeconomic metrics, designed to help traders make more informed decisions in the forex market. This indicator displays key economic indicators such as interest rates, money supply (M1 and M2), unemployment rate, and government debt for various currencies and their pairs, allowing users to assess the macroeconomic differences between the base and quote currencies.
Key Features:
• Interest Rates Display: Includes interest rates for maj
Indicador
Money Flow DivergenceThe Money Flow Divergence indicator is designed to help traders identify periods when there is a significant divergence between the growth of the U.S. M2 money supply and the S&P 500 index (SPX).
This divergence can provide insights into potential market turning points, making it a valuable tool for long-term investors and traders looking to capitalize on macroeconomic trends.
How It Works:
Data Sources:
S&P 500 Index (SPX) and U.S. M2 Money Supply.
Calculating Growth Rates:
SPX Growth:
Indicador
M2 Global Liquidity Index
The M2 Global Liquidity Index calculates a composite index reflecting the aggregate liquidity provided by the M2 money supply of five major currencies: Chinese Yuan (CNY), US Dollar (USD), Euro (EUR), Japanese Yen (JPY), and British Pound (GBP). The M2 money supply includes cash, checking deposits, and easily convertible near money. By incorporating exchange rates (CNY/USD, EUR/USD, JPY/USD, GBP/USD), the script adjusts each country's M2 supply to a common base (USD) and sums them up to produce
Indicador
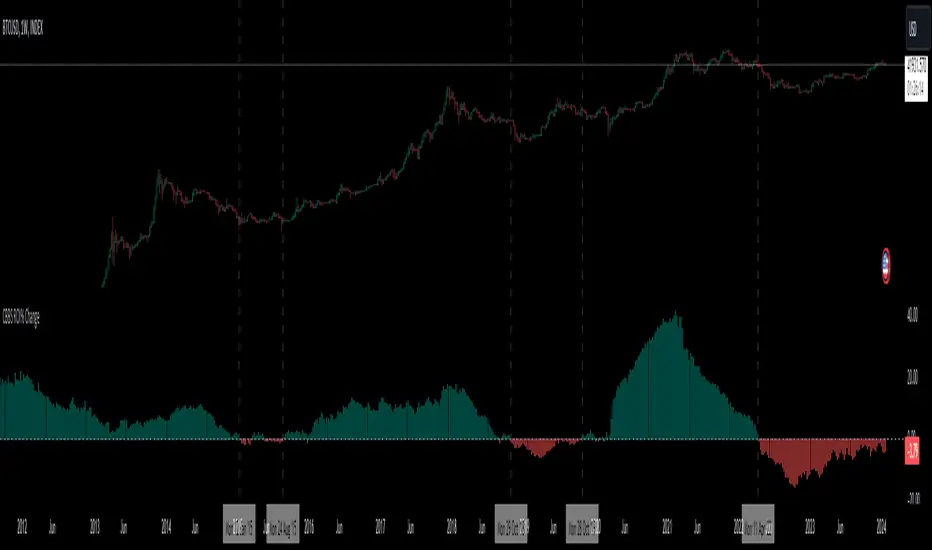
Central Banks Balance Sheets ROI% ChangeIntroducing the "Central Banks Balance Sheets ROI% Change" indicator, a tool designed to offer traders and analysts an understanding of global liquidity dynamics.
This indicator tracks the Return on Investment (ROI) percentage changes across major central banks' balance sheets, providing insights into shifts in global economic liquidity not tied to cumulative figures but through ROI calculations, capturing the pulse of overall economic dynamics.
Key Enhancements:
ROI Period Customiz
Indicador
Global Liquidity IndexThe Global Liquidity Index offers a consolidated view of all major central bank balance sheets from around the world. For consistency and ease of comparison, all values are converted to USD using their relevant forex rates and are expressed in trillions. The indicator incorporates specific US accounts such as the Treasury General Account (TGA) and Reverse Repurchase Agreements (RRP), both of which are subtracted from the Federal Reserve's balance sheet to give a more nuanced view of US liquidity
Indicador
Global (World) Monetary Supply M2 (measured in USD)This is the Global Monetary Supply M2 of the richest and most populous countries that have info from at least 2008
It is measured in USD (converting the M2 of each of the countries respective currencies and virtually converting them into USD)
This is less than the global liquidity as it does not include the countries' assets in other currencies (on their balance sheets), it only focuses on the monetary supply of each of the countries own currencies.
Indicador
Global Monetary Supply M2 Vs the Global GDP This indicator compares the Global (world) Monetary Supply (measured in USD) compared to the Global GDP.
This can be useful to measure the "money printing speed" of the world compare to the "world gdp growth", the higher the slope (angle of growth) the more money printing.
It includes the exact same countries of the Global M2 indicator (done by me), to make fair the comparison, which has the richest and most populous countries so to have a clear overview.
There tough a few very populated co
Indicador
Recession Warning Traffic LightThis is an indicator that uses 6 different metrics to determine the combined probability of a recession and compares the high probability warning periods against actual historical periods of recession.
GREEN tells us that the referenced recession indicators are not exhibiting any warning. Observe the long stretches of “all-green” in between recessionary periods in the chart above.
RED will show a full-on warning level for that particular recession indicator, signaling that monitoring of this s
Annualizer: New Indicator + CPI AnalysisThis indicator calculates the annualized month-over-month percent change of a cumulative index and plots it alongside the year-over-year percent change for comparison. It was developed for the purpose of analyzing the inflation rate of CPI indexes such as “CPIAUCSL.” It can also be used on M2 money supply and pretty much any cumulative index. It will not produce useful outputs on percent change indexes such as “USCCPI” because it performs percent change calculations which are already applied
Indicador