Relative Vigor Index (RVI) with EMD [AIBitcoinTrend]👽 Adaptive Relative Vigor Index with EMD & Signals (AIBitcoinTrend)
The Adaptive Relative Vigor Index (RVI) with Empirical Mode Decomposition (EMD) is an enhanced version of the traditional RVI, designed to improve signal clarity and responsiveness to market conditions. By integrating EMD smoothing and adaptive volatility-based trailing stops.
👽 What Makes the Adaptive RVI with EMD Unique?
Unlike the standard RVI, which often lags in volatile markets, this version refines price momentum detection by applying Empirical Mode Decomposition (EMD), effectively filtering out noise. Additionally, it features ATR-based trailing stops for precise trade execution.
Key Features:
EMD-Enhanced RVI – Filters out short-term noise, improving signal accuracy.
Crossover & Crossunder Signals – Generates trade signals based on RVI trends.
ATR-Based Trailing Stop – Adjusts dynamically based on volatility for optimal risk management.
👽 The Math Behind the Indicator
👾 RVI Calculation with EMD Smoothing
The Relative Vigor Index (RVI) measures trend strength by comparing the relationship between closing and opening prices, relative to the high-low range. Traditional RVI uses fixed smoothing, whereas this version applies Empirical Mode Decomposition (EMD) to extract dominant price cycles and improve trend clarity.
How It Works:
The RVI is initially calculated using a weighted moving average (WMA) over a specified period.
EMD refines the RVI signal by removing high-frequency noise, creating a smoothed RVI component.
This results in a more stable and reliable trend indicator.
👽 How Traders Can Use This Indicator
👾 Trailing Stop & Signal-Based Trading
Bullish Setup:
✅ RVI crosses above EMD → Buy signal.
✅ A bullish trailing stop is placed at low - ATR × Multiplier.
✅ Exit if price crosses below the stop.
Bearish Setup:
✅ RVI crosses below EMD → Sell signal.
✅ A bearish trailing stop is placed at high + ATR × Multiplier.
✅ Exit if price crosses above the stop.
👾 Detecting Overbought & Oversold Areas
This indicator helps traders identify potential reversal zones by highlighting overbought and oversold conditions.
Overbought Zone: When RVI moves above 0.4, the market may be overextended, signaling a potential reversal downward.
Oversold Zone: When RVI moves below -0.4, the market may be undervalued, suggesting a possible upward reversal.
Using these levels, traders can confirm entry and exit points alongside divergence signals for higher probability trades.
👽 Why It’s Useful for Traders
EMD-Based Signal Enhancement: Filters out noise, refining momentum signals.
Adaptive ATR-Based Risk Management: Automatically adjusts stop-loss levels to market conditions.
Works Across Multiple Markets & Timeframes: Effective for stocks, forex, crypto, and futures trading.
👽 Indicator Settings
RVI Length – Defines the period for calculating the Relative Vigor Index.
EMD Period – Controls the level of EMD smoothing applied.
Final Smoothing – Adjusts the degree of additional signal filtering.
Lookback Period – Determines how many bars are used for detecting pivot points.
Enable Trailing Stop – Activates dynamic ATR-based trailing stops.
ATR Multiplier – Adjusts the stop-loss sensitivity.
Disclaimer: This indicator is designed for educational purposes and does not constitute financial advice. Please consult a qualified financial advisor before making investment decisions.
M-oscillator

Pure CocaPure Coca - Trend & Mean Reversion Indicator
Overview
The Pure Coca indicator is a trend and mean reversion analysis tool designed for identifying dynamic shifts in market behavior. By leveraging Z-score calculations, this indicator captures both trend-following and mean-reverting periods, making it useful for a wide range of trading strategies.
What It Does
📉 Detects Overbought & Oversold Conditions using a Z-score framework.
🎯 Identifies Trend vs. Mean Reversion Phases by analyzing the deviation of price from its historical average.
📊 Customizable Moving Averages (EMA, SMA, VWMA, etc.) for smoothing Z-score calculations.
🔄 Adaptable to Any Timeframe – Default settings are optimized for 2D charts but can be adjusted to suit different market conditions.
How It Works
Computes a Z-score of price movements, normalized over a lookback period.
Plots upper and lower boundaries to visualize extreme price movements.
Dynamic Midlines adjust entry and exit conditions based on market shifts.
Background & Bar Coloring help traders quickly identify trading opportunities.
Key Features & Inputs
✔ Lookback Period: Adjustable period for calculating Z-score.
✔ Custom MA Smoothing: Choose from EMA, SMA, WMA, VWAP, and more.
✔ Z-Score Thresholds: Set upper and lower bounds to define overbought/oversold conditions.
✔ Trend vs. Mean Reversion Mode: Enables traders to spot momentum shifts in real-time.
✔ Bar Coloring & Background Highlights: Enhances visual clarity for decision-making.
How to Use It
Trend Trading: Enter when the Z-score crosses key levels (upper/lower boundary).
Mean Reversion: Look for reversals when price returns to the midline.
Custom Optimization: Adjust lookback periods and MA types based on market conditions.
Why It's Unique
✅ Combines Trend & Mean Reversion Analysis in one indicator.
✅ Flexible Z-score settings & MA choices for enhanced adaptability.
✅ Clear visual representation of market extremes.
Final Notes
This indicator is best suited for discretionary traders, quantitative analysts, and systematic traders looking for data-driven market insights. As with any trading tool, use in conjunction with other analysis methods for optimal results.
Market Participation Index [PhenLabs]📊 Market Participation Index
Version: PineScript™ v6
📌 Description
Market Participation Index is a well-evolved statistical oscillator that constantly learns to develop by adapting to changing market behavior through the intricate mathematical modeling process. MPI combines different statistical approaches and Bayes’ probability theory of analysis to provide extensive insight into market participation and building momentum. MPI combines diverse statistical thinking principles of physics and information and marries them for subtle changes to occur in markets, levels to become influential as important price targets, and pattern divergences to unveil before it is visible by analytical methods in an old-fashioned methodology.
🚀 Points of Innovation:
Automatic market condition detection system with intelligent preset selection
Multi-statistical approach combining classical and advanced metrics
Fractal-based divergence system with quality scoring
Adaptive threshold calculation using statistical properties of current market
🚨 Important🚨
The ‘Auto’ mode intelligently selects the optimal preset based on real-time market conditions, if the visualization does not appear to the best of your liking then select the option in parenthesis next to the auto mode on the label in the oscillator in the settings panel.
🔧 Core Components
Statistical Foundation: Multiple statistical measures combined with weighted approach
Market Condition Analysis: Real-time detection of market states (trending, ranging, volatile)
Change Point Detection: Bayesian analysis for finding significant market structure shifts
Divergence System: Fractal-based pattern detection with quality assessment
Adaptive Visualization: Dynamic color schemes with context-appropriate settings
🔥 Key Features
The indicator provides comprehensive market analysis through:
Multi-statistical Oscillator: Combines Z-score, MAD, and fractal dimensions
Advanced Statistical Components: Includes skewness, kurtosis, and entropy analysis
Auto-preset System: Automatically selects optimal settings for current conditions
Fractal Divergence Analysis: Detects and grades quality of divergence patterns
Adaptive Thresholds: Dynamically adjusts overbought/oversold levels
🎨 Visualization
Color-coded Oscillator: Gradient-filled oscillator line showing intensity
Divergence Markings: Clear visualization of bullish and bearish divergences
Threshold Lines: Dynamic or fixed overbought/oversold levels
Preset Information: On-chart display of current market conditions
Multiple Color Schemes: Modern, Classic, Monochrome, and Neon themes
Classic
Modern
Monochrome
Neon
📖 Usage Guidelines
The indicator offers several customization options:
Market Condition Settings:
Preset Mode: Choose between Auto-detection or specific market condition presets
Color Theme: Select visual theme matching your chart style
Divergence Labels: Choose whether or not you’d like to see the divergence
✅ Best Use Cases:
Identify potential market reversals through statistical divergences
Detect changes in market structure before price confirmation
Filter trades based on current market condition (trending vs. ranging)
Find optimal entry and exit points using adaptive thresholds
Monitor shifts in market participation and momentum
⚠️ Limitations
Requires sufficient historical data for accurate statistical analysis
Auto-detection may lag during rapid market condition changes
Advanced statistical calculations have higher computational requirements
Manual preset selection may be required in certain transitional markets
💡 What Makes This Unique
Statistical Depth: Goes beyond traditional indicators with advanced statistical measures
Adaptive Intelligence: Automatically adjusts to current market conditions
Bayesian Analysis: Identifies statistically significant change points in market structure
Multi-factor Approach: Combines multiple statistical dimensions for confirmation
Fractal Divergence System: More robust than traditional divergence detection methods
🔬 How It Works
The indicator processes market data through four main components:
Market Condition Analysis:
Evaluates trend strength, volatility, and price patterns
Automatically selects optimal preset parameters
Adapts sensitivity based on current conditions
Statistical Oscillator:
Combines multiple statistical measures with weights
Normalizes values to consistent scale
Applies adaptive smoothing
Advanced Statistical Analysis:
Calculates higher-order statistical moments
Applies information-theoretic measures
Detects distribution anomalies
Divergence Detection:
Uses fractal theory to identify pivot points
Detects and scores divergence quality
Filters signals based on current market phase
💡 Note:
The Market Participation Index performs optimally when used across multiple timeframes for confirmation. Its statistical foundation makes it particularly valuable during market transitions and periods of changing volatility, where traditional indicators often fail to provide clear signals.

Bollinger Bands MTF & Kalman Filter | Flux Charts📈 Multi-Timeframe Kalman Filtered Bollinger Bands Indicator
Introducing our MTF Kalman Filtered Bollinger Bands – a powerful multi-timeframe Bollinger Bands (BB) indicator enhanced with Kalman filtering for superior smoothing and trend analysis. This indicator dynamically adapts Bollinger Bands across multiple timeframes while incorporating volume-based gradient transparency to highlight significant price movements. This indicator is better optimized for lower timeframes.
❓ How to Interpret the Bands & Volume Gradient:
Our indicator combines Lower Timeframe (LTF) and Higher Timeframe (HTF) Bollinger Bands to provide a comprehensive trend analysis. It applies Kalman filtering to the LTF bands, ensuring smoother, noise-reduced signals. The color gradient and relative volume-based transparency offer deeper insights into price strength.
🔹 LTF Bollinger Bands: Shorter-period bands filtered with a Kalman smoothing algorithm, reducing lag and noise.
🔹 HTF Bollinger Bands: Traditional Bollinger Bands plotted on a higher timeframe, offering macro trend analysis.
🔹 Volume Gradient Transparency: The bands adjust their opacity based on relative buy/sell volume, allowing traders to assess momentum strength.
📌 How Does It Work?
1️⃣ Multi-Timeframe Bollinger Bands Calculation
The LTF BB uses Kalman filtering for a smoother price representation, helping to reduce false signals.
The HTF BB is EMA-smoothed for improved trend clarity.
2️⃣ Adaptive Gradient Transparency
The opacity of the fill color between the bands is determined by relative buy/sell volume.
Higher buy volume = stronger bullish signal (greener bands).
Higher sell volume = stronger bearish signal (redder bands).
3️⃣ Dynamic Trend Signals & Breakouts
Buy Signal: When price breaks below the HTF lower band and LTF bands start rising.
Sell Signal: When price breaks above the HTF upper band and LTF bands start falling.
⚙️ Settings & Customization:
🛠 LTF and HTF Bollinger Bands Settings:
Multiplier: The multiplier applied to the BB to determine the upper and lower bands
Length: Define the number of bars determines the BB calculations.
Custom Timeframe Selection: Choose from predefined options (e.g., 5m, 15m, 1H, 4H, etc).
🎨 Gradient & Transparency Settings:
Bullish/Bearish Color Options: Customize colors for uptrend and downtrend conditions.
Max & Min Opacity: Adjust the transparency levels based on volume intensity.
Solid vs. Gradient Mode: Choose between a gradient fill or a solid color mode for clarity.
📌 Recommended Settings for Optimal Use:
1️⃣ Timeframe Selection (LTF -> HTF):
1 min -> 5 min
2 min -> 5 min
3 min -> 15 min
5 min -> 15 min
15 min -> 1 hr
1 hr -> 4 hr
4 hr -> 1 day
2️⃣ Multiplier: Use 2.0 for LTF and 2.25 for HTF
3️⃣Length: Use a length of 20 - 30 bars
🚀 Why Use This Indicator?
✅ Multi-Timeframe Bollinger Bands with Kalman Filtering – Ideal for traders looking for reduced lag and clearer trend signals.
✅ Volume-Based Transparency – See momentum shifts instantly with adaptive opacity.
✅ Dynamic Buy & Sell Signals – Alerts based on price action + volume trends.
✅ Customizable for Any Strategy – Adjust colors, timeframes, and filtering options for personalized trading.

TEMA OBOS Strategy PakunTEMA OBOS Strategy
Overview
This strategy combines a trend-following approach using the Triple Exponential Moving Average (TEMA) with Overbought/Oversold (OBOS) indicator filtering.
By utilizing TEMA crossovers to determine trend direction and OBOS as a filter, it aims to improve entry precision.
This strategy can be applied to markets such as Forex, Stocks, and Crypto, and is particularly designed for mid-term timeframes (5-minute to 1-hour charts).
Strategy Objectives
Identify trend direction using TEMA
Use OBOS to filter out overbought/oversold conditions
Implement ATR-based dynamic risk management
Key Features
1. Trend Analysis Using TEMA
Uses crossover of short-term EMA (ema3) and long-term EMA (ema4) to determine entries.
ema4 acts as the primary trend filter.
2. Overbought/Oversold (OBOS) Filtering
Long Entry Condition: up > down (bullish trend confirmed)
Short Entry Condition: up < down (bearish trend confirmed)
Reduces unnecessary trades by filtering extreme market conditions.
3. ATR-Based Take Profit (TP) & Stop Loss (SL)
Adjustable ATR multiplier for TP/SL
Default settings:
TP = ATR × 5
SL = ATR × 2
Fully customizable risk parameters.
4. Customizable Parameters
TEMA Length (for trend calculation)
OBOS Length (for overbought/oversold detection)
Take Profit Multiplier
Stop Loss Multiplier
EMA Display (Enable/Disable TEMA lines)
Bar Color Change (Enable/Disable candle coloring)
Trading Rules
Long Entry (Buy Entry)
ema3 crosses above ema4 (Golden Cross)
OBOS indicator confirms up > down (bullish trend)
Execute a buy position
Short Entry (Sell Entry)
ema3 crosses below ema4 (Death Cross)
OBOS indicator confirms up < down (bearish trend)
Execute a sell position
Take Profit (TP)
Entry Price + (ATR × TP Multiplier) (Default: 5)
Stop Loss (SL)
Entry Price - (ATR × SL Multiplier) (Default: 2)
TP/SL settings are fully customizable to fine-tune risk management.
Risk Management Parameters
This strategy emphasizes proper position sizing and risk control to balance risk and return.
Trading Parameters & Considerations
Initial Account Balance: $7,000 (adjustable)
Base Currency: USD
Order Size: 10,000 USD
Pyramiding: 1
Trading Fees: $0.94 per trade
Long Position Margin: 50%
Short Position Margin: 50%
Total Trades (M5 Timeframe): 128
Deep Test Results (2024/11/01 - 2025/02/24)BTCUSD-5M
Total P&L:+1638.20USD
Max equity drawdown:694.78USD
Total trades:128
Profitable trades:44.53
Profit factor:1.45
These settings aim to protect capital while maintaining a balanced risk-reward approach.
Visual Support
TEMA Lines (Three EMAs)
Trend direction is indicated by color changes (Blue/Orange)
ema3 (short-term) and ema4 (long-term) crossover signals potential entries
OBOS Histogram
Green → Strong buying pressure
Red → Strong selling pressure
Blue → Possible trend reversal
Entry & Exit Markers
Blue Arrow → Long Entry Signal
Red Arrow → Short Entry Signal
Take Profit / Stop Loss levels displayed
Strategy Improvements & Uniqueness
This strategy is based on indicators developed by "l_lonthoff" and "jdmonto0", but has been significantly optimized for better entry accuracy, visual clarity, and risk management.
Enhanced Trend Identification with TEMA
Detects early trend reversals using ema3 & ema4 crossover
Reduces market noise for a smoother trend-following approach
Improved OBOS Filtering
Prevents excessive trading
Reduces unnecessary risk exposure
Dynamic Risk Management with ATR-Based TP/SL
Not a fixed value → TP/SL adjusts to market volatility
Fully customizable ATR multiplier settings
(Default: TP = ATR × 5, SL = ATR × 2)
Summary
The TEMA + OBOS Strategy is a simple yet powerful trading method that integrates trend analysis and oscillators.
TEMA for trend identification
OBOS for noise reduction & overbought/oversold filtering
ATR-based TP/SL settings for dynamic risk management
Before using this strategy, ensure thorough backtesting and demo trading to fine-tune parameters according to your trading style.

Adaptive RSI with Real-Time Divergence [AIBitcoinTrend]👽 Adaptive RSI Trailing Stop (AIBitcoinTrend)
The Adaptive RSI Trailing Stop is an indicator that integrates Gaussian-weighted RSI calculations with real-time divergence detection and a dynamic ATR-based trailing stop. This advanced approach allows traders to monitor momentum shifts, identify divergences early, and manage risk with adaptive trailing stop levels that adjust to price action.
👽 What Makes the Adaptive RSI with Signals and Trailing Stop Unique?
Unlike traditional RSI indicators, this version applies a Gaussian-weighted smoothing algorithm, making it more responsive to price action while reducing noise. Additionally, the trailing stop feature dynamically adjusts based on volatility and trend conditions, allowing traders to:
Detects real-time divergences (bullish/bearish) with a smart pivot-based system.
Filter noise with Gaussian weighting, ensuring smoother RSI transitions.
Utilize crossover-based trailing stop activation, for systematic trade management.
👽 The Math Behind the Indicator
👾 Gaussian Weighted RSI Calculation
Traditional RSI calculations rely on simple averages of gains and losses. Instead, this indicator weights recent price changes using a Gaussian distribution, prioritizing more relevant data points while maintaining smooth transitions.
Key Features:
Exponential decay ensures recent price changes are weighted more heavily.
Reduces short-term noise while maintaining responsiveness.
👾 Real-Time Divergence Detection
The indicator detects bullish and bearish divergences using pivot points on RSI compared to price action.
👾 Dynamic ATR-Based Trailing Stop
Bullish Trailing Stop: Activates when RSI crosses above 20 and dynamically adjusts based on low - ATR multiplier.
Bearish Trailing Stop: Activates when RSI crosses below 80 and adjusts based on high + ATR multiplier
This allows traders to:
Lock in profits systematically by adjusting stop-losses dynamically.
Stay in trades longer while maintaining adaptive risk management.
👽 How It Adapts to Market Movements
✔️ Gaussian Filtering ensures smooth RSI transitions while preventing excessive lag.
✔️ Real-Time Divergence Alerts provide early trade signals based on price-RSI discrepancies.
✔️ ATR Trailing Stop dynamically expands or contracts based on market volatility.
✔️ Crossover-Based Activation enables the stop-loss system only when RSI confirms a momentum shift.
👽 How Traders Can Use This Indicator
👾 Divergence Trading
Traders can use real-time divergence detection to anticipate reversals before they happen.
Bullish Divergence Setup:
Look for RSI making a higher low, while price makes a lower low.
Enter long when RSI confirms upward momentum.
Bearish Divergence Setup:
Look for RSI making a lower high, while price makes a higher high.
Enter short when RSI confirms downward momentum.
👾 Trailing Stop Signals
Bullish Signal and Trailing Stop Activation:
When RSI crosses above 20, a trailing stop is placed using low - ATR multiplier.
If price crosses below the stop, it exits the trade and removes the stop.
Bearish Signal and Trailing Stop Activation:
When RSI crosses below 80, a trailing stop is placed using high + ATR multiplier.
If price crosses above the stop, it exits the trade and removes the stop.
This makes trend-following strategies more efficient, while ensuring proper risk management.
👽 Why It’s Useful for Traders
✔️ Dynamic and Adaptive: Adjusts to changing market conditions automatically.
✔️ Noise Reduction: Gaussian-weighted RSI reduces short-term price distortions.
✔️ Comprehensive Strategy Tool: Combines momentum detection, divergence analysis, and automated risk management into a single indicator.
✔️ Works Across Markets & Timeframes: Suitable for stocks, forex, crypto, and futures trading.
👽 Indicator Settings
RSI Length: Defines the lookback period for RSI smoothing.
Gaussian Sigma: Controls how much weight is given to recent data points.
Enable Signal Line: Option to display an RSI-based moving average.
Divergence Lookback: Configures how far back pivot points are detected.
Crossover/crossunder values for signals: Set the crossover/crossunder values that triggers signals.
ATR Multiplier: Adjusts trailing stop sensitivity to market volatility.
Disclaimer: This indicator is designed for educational purposes and does not constitute financial advice. Please consult a qualified financial advisor before making investment decisions.

Weighted Relative Strength Index [SeerQuant]Weighted Relative Strength Index (WRSI)
The Weighted Relative Strength Index (WRSI) is an advanced momentum oscillator that enhances the traditional RSI by incorporating customizable weighting methods and moving average smoothing. With dynamic threshold logic, color-coded visuals, and optional candle coloring, the WRSI provides traders with a versatile tool for identifying trends, overbought/oversold conditions, and momentum shifts.
⚙️ How It Works
1. Weighted Momentum Calculation
The indicator calculates price changes (delta) and applies a user-defined weighting method (e.g., Volume, Momentum, Volatility, or Reversion Factor) to emphasize specific market dynamics.
2. Custom Moving Average Integration
Weighted upward and downward price movements are smoothed using a selectable moving average type (e.g., SMA, EMA, TEMA, etc.), producing a weighted RSI that blends momentum and trend data.
3. Smoothed RSI Output
An additional moving average is applied to the weighted RSI for a smoothed version, offering a clearer view of momentum trends.
4. Threshold Logic
Bullish (Uptrend): WRSI exceeds the upper neutral zone boundary (50 + Neutral Zone).
Bearish (Downtrend): WRSI falls below the lower neutral zone boundary (50 - Neutral Zone).
Neutral: WRSI remains within the neutral zone.
Extreme overbought (90+) and oversold (20-) levels are marked with X’s for quick identification.
5. Dynamic Visual Representation
A color-coded line reflects the WRSI, adjusting hues based on trend direction.
Gradient fills highlight overbought/oversold zones and neutral areas.
Optional candle coloring ties price action to WRSI or smoothed RSI values.
A histogram-style fill between the WRSI and midline enhances trend strength visibility.
✨ Customizable Settings
Calculation Settings:
Calculation Source: Select the price source (default: close).
Calculation Length: Set the lookback period for RSI calculation (default: 14).
Moving Average Type: Choose from SMA, EMA, RMA, WMA, VWMA, LSMA, HMA, ALMA, DEMA, or TEMA (default: RMA).
Moving Average Length: Adjust the smoothing period for the weighted RSI (default: 8).
Neutral Zone Range: Define the width of the neutral zone around the midline (default: 5).
RSI Weighting Method:
Volume: Weights by trading volume.
Momentum: Weights by absolute price momentum.
Volatility: Weights by standard deviation.
Reversion Factor: Weights inversely to variance for mean-reversion emphasis (default: Momentum).
Style Settings:
Colour Choice: Pick from predefined schemes: Default, Modern, Cool, or Monochrome (default: Default).
Use Custom Colors?: Toggle to use custom bull, bear, and neutral colors (default: false).
Bull/Bear/Neutral Colors: Set custom colors when enabled (default: green/red/gray).
Candle Color Mode: Color candles based on WRSI or smoothed RSI (default: RSI).
Color Candles?: Enable/disable candle coloring (default: false).
🚀 Features and Benefits
Weighted Momentum Analysis: Enhances RSI with dynamic weighting for deeper market insights.
Flexible Smoothing: Multiple MA types and adjustable lengths adapt to various trading styles.
Visual Intuition: Color-coded outputs, gradient fills, and optional candle coloring simplify trend analysis.
Customizable Thresholds: Neutral zone and extreme levels cater to individual strategies.
Overbought/Oversold Signals: Clear markers for extreme conditions improve decision-making.
📜 Disclaimer
This indicator is for educational purposes only and does not constitute financial advice. Past performance does not guarantee future results. Always consult a licensed financial advisor before making trading decisions. Use at your own risk.

AntoQQE - HistogramThis script displays a QQE-based momentum histogram, derived from the RSI line’s deviation around a neutral 50 level. It uses a smoothed RSI, monitors volatility with a dynamically adjusted multiplier, and then plots a color-coded histogram that helps traders see when the RSI is entering strong bullish or bearish territory:
• Smoothed RSI Calculation
The script calculates RSI for a user-defined period and then smooths it with an EMA. This reduces noise in the indicator’s readings.
• Dynamic Average Range (DAR)
The script computes volatility by taking the absolute change of the smoothed RSI, applying two EMAs, and multiplying by a QQE factor. This produces a band around the RSI that adapts to changes in market volatility.
• Histogram Centering and Thresholds
Rather than plotting the RSI itself, the script subtracts 50 from the RSI to center it around zero. Columns are plotted for each bar:
Blue when momentum is significantly above zero (over a threshold value).
Red when momentum is significantly below zero (under a negative threshold).
Gray when momentum is within a neutral range.
• Usage
By observing when columns turn blue or red—and how far they extend above or below zero—traders can quickly gauge the market’s momentum. The horizontal threshold lines (dashed by default) provide clear breakout levels for bullish or bearish conditions, which can help confirm entries or exits based on shifting market sentiment. It is best paired with the AntoQQE - Bars indicator for better chart visualization.

AntoQQE - BarsThis script is a variation on the QQE (Quantitative Qualitative Estimation) concept applied to RSI. It calculates a smoothed RSI line, then determines a “Dynamic Average Range” around that line. By tracking the RSI’s movement relative to these upper (shortBand) and lower (longBand) levels, it determines when price momentum shifts enough to suggest a possible trend flip. The script plots color-coded candles based on these momentum conditions:
• RSI Calculation and Smoothing
An RSI value is obtained over a specified period, then smoothed by an EMA. This smoothed RSI serves as the core measure of momentum.
• Dynamic Average Range (DAR)
The script computes the volatility of the smoothed RSI using two EMAs of its bar-to-bar movements. It multiplies this volatility factor by a QQE multiplier to create upper and lower bands that adapt to changes in RSI volatility.
• Trend Flips
When the smoothed RSI crosses above or below its previous band level (shortBand or longBand), the script interprets this as a shift in momentum and sets a trend state accordingly (long or short).
• Candle Coloring
Finally, the script colors each candle according to how far the smoothed RSI is from a neutral baseline of 50:
Candles turn green when the RSI is sufficiently above 50, suggesting bullish momentum.
Candles turn red when the RSI is sufficiently below 50, indicating bearish momentum.
Candles turn orange when they are near the 50 level, reflecting a more neutral or transitional phase.
Traders can use these colored candles to quickly see when the RSI’s momentum has moved into overbought/oversold zones—or is shifting between bullish and bearish conditions—without needing to consult a separate oscillator window. The adaptive nature of the band calculations can help in spotting significant shifts in market sentiment and volatility.
Pearson OscillatorThe Pearson Oscillator is a custom TradingView indicator that leverages statistical correlation analysis to gauge the trend strength of a given price series. By calculating the Pearson correlation coefficient between time (as an index) and price over a user-defined period, the indicator provides traders with an insight into how strongly the market is trending or oscillating.
──────────────────────────────
Key Features
- User-Defined Parameters:
– Set the calculation length, price source, and smoothing period.
– Adjust upper and lower threshold levels to suit your trading strategy.
– Customize color settings for increasing, decreasing, and neutral conditions.
- Dynamic Trend Analysis:
– Computes the Pearson correlation coefficient to measure the relationship between time and price.
– Applies a simple moving average to smooth out fluctuations in the coefficient, offering a more stable reading.
- Visual Representation:
– Plots the smoothed Pearson coefficient as a continuous line.
– Displays a histogram showing the variation (first derivative) of the coefficient to highlight changes in trend strength.
– Draws horizontal reference lines at the specified upper and lower thresholds as well as at the zero level for quick visual assessment.
- Alerts and Dynamic Labeling:
– Automatically triggers alerts when the smoothed Pearson coefficient crosses the predefined threshold levels, so you never miss a potential market turning point.
– Generates a dynamic label on the last bar that displays important statistical information, including:
- The current Pearson coefficient (rounded to three decimals).
- A classification of correlation strength (e.g., STRONG, MEDIUM, WEAK, NEUTRAL) based on the absolute value of the coefficient.
- The trend direction (Upward, Downward, or Stable).
- The delta of the coefficient, offering insight into how quickly the trend is evolving.
──────────────────────────────
How It Works
1. Calculation of the Pearson Coefficient:
- A custom function iterates over a specified number of price bars, summing time indices, price values, and their squared and cross-products.
- Using the Pearson correlation formula, it computes a coefficient that ranges between -1 and 1—values close to ±1 indicate a strong trend or linear relationship, while values near 0 suggest a weak or non-existent trend.
2. Smoothing Process:
- The raw Pearson coefficient is then smoothed using a simple moving average (SMA) to reduce noise and provide a clearer view of the underlying trend.
3. Delta (Variation) Computation:
- The script calculates the change (delta) between the current smoothed coefficient and its value on the previous bar.
- This derivative is plotted as a histogram, signaling the speed at which the correlation (and thus the trend) is changing.
4. Visual and Alert Mechanisms:
- The smoothed coefficient and its delta are plotted with colors that dynamically update to reflect increasing or decreasing trends.
- Horizontal lines set at user-defined thresholds help to quickly identify overbought or oversold (or extreme correlation) scenarios.
- Alerts are defined to notify you when the smoothed coefficient crosses these key levels, ensuring timely trade decisions.
5. Dynamic Label:
- At the last bar, a dynamic label is created displaying the current Pearson value, its strength, the direction of the trend, and the delta.
- This quick snapshot helps traders assess the market condition at a glance without diving into detailed analysis.
──────────────────────────────
Why Use the Pearson Oscillator?
This indicator is particularly useful for traders who need a quantitative measure of trend strength that goes beyond traditional moving averages. By integrating statistical correlation directly into market analysis, the Pearson Oscillator helps you:
- Identify periods of strong trending behavior or potential reversals.
- Enhance your risk management through early alerts.
- Visualize the rate of change in market sentiment, enabling more informed entry and exit decisions.
Whether you are a technical analyst or a systematic trader, this indicator provides a robust tool to complement your existing trading toolkit.
──────────────────────────────
The Pearson Oscillator merges statistical insights with technical charting, creating an intuitive yet powerful tool for market analysis. With its adjustable parameters, visual cues, dynamic labeling, and automated alerts, it assists traders in monitoring and responding to evolving market conditions efficiently. This makes it a valuable addition to any TradingView chart, particularly for those looking to quantify the strength and evolution of market trends.
Feel free to adapt the parameters and visual settings to best align the indicator with your trading strategy. Happy trading!
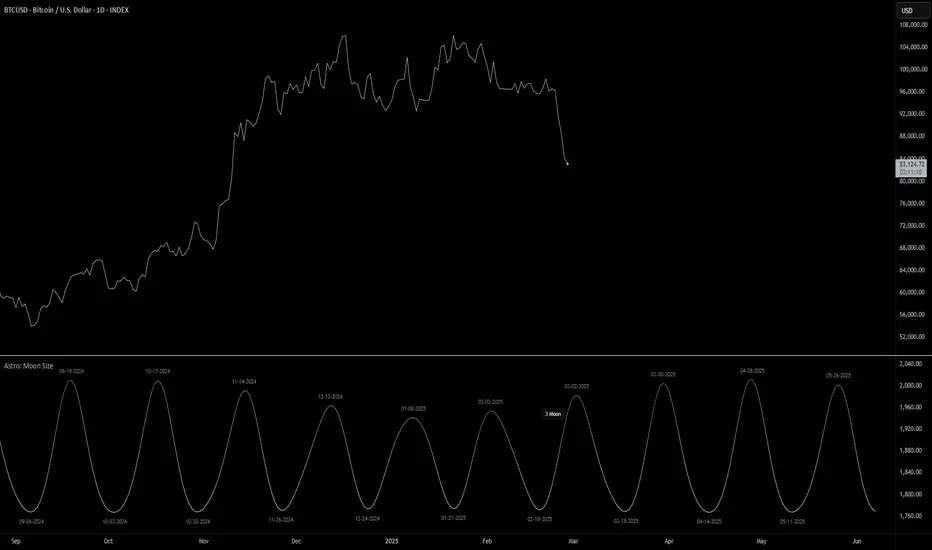
Astro: Moon SizeThe Astro: Moon Size indicator, built using AstroLib , calculates the distance and visualizes the apparent size of the Moon based on astronomical positioning. This script is tailored for the 1D timeframe and provides insights into lunar perigees (closest approach) and apogees (farthest distance), making it useful for astrologically-informed trading strategies.
New Astro Indicators Feature:
By setting the Julian Date to X number of days in the future, and offsetting the plot by X number of bars accordingly, it is now possible to visualize future projections of TradingView indicators that reference the AstroLib . This feature has been long requested and is far overdue, so thank you to everyone who pushed for this feature release. Enjoy, time travelers from the future!!
Key Features:
Moon Size Calculation: Uses Julian Date (J2000) conversion and AstroLib functions to determine the Moon's apparent distance.
Future Projection: Displays the Moon's distance from 28 up to 500 days ahead, with color gradients indicating proximity/size.
Pivot Identification: Marks local maxima (apogees) and minima (perigees) with labeled date stamps for easy reference.
Dynamic Labeling: Adapts label positioning and size based on the Moon's current trend and relative size.
Usage Notes:
⚠️ Timeframe Restriction: For now, the script only functions on the 1D timeframe and will prompt an error otherwise.
⚠️ Asset Restriction: This script is meant to be loaded on charts for assets that trade 24/7, like BTCUSD historical index.
Trend Detector [victhoreb]Trend Detector is a streamlined indicator that uses the Pearson correlation coefficient between the average price and time to determine market trends. It measures how closely price movement follows the progression of time over a user-defined period, providing a clear gauge of trend direction on a scale from -1 to 1.
How It Works:
The indicator calculates the correlation between price and time. A positive correlation means that as time advances, the price generally rises—signaling an uptrend. Conversely, a negative correlation indicates that the price tends to fall over time, highlighting a downtrend.
With its simple yet effective approach, Trend Detector offers traders an immediate visual and quantitative insight into prevailing market trends.

RSI Trend Bias█ OVERVIEW
The RSI Trend Bias indicator is a custom technical analysis tool that utilizes the Relative Strength Index (RSI) to gauge market momentum and identify potential trend shifts. By monitoring RSI crossovers and crossunders relative to customizable threshold levels, the indicator provides clear visual cues that distinguish between bullish and bearish market conditions. This flexible approach makes it suitable for both short-term scalping and longer-term trend analysis.
█ KEY FEATURES
Dynamic RSI Trend Detection
The indicator dynamically determines market bias by monitoring the RSI for crossovers above the upper threshold and crossunders below the lower threshold. This method ensures that only significant momentum shifts trigger a change in trend, reducing false signals in volatile markets.
Adaptive Visualizations
The RSI Trend Bias indicator enhances clarity by plotting the RSI with colors that reflect current market conditions. Additionally, it offers an optional background color change to further emphasize bullish or bearish states, providing immediate visual feedback to traders.
Clear Threshold Indicators
Upper and lower threshold levels are plotted as constant reference lines, clearly delineating overbought and oversold regions. These markers help traders quickly assess market conditions at a glance.
Customizable Settings
Users have full control over key parameters including the RSI length, threshold levels, and visual settings. This customization allows the indicator to be tailored for different markets and trading styles, ensuring optimal performance across various timeframes.
█ UNDERLYING METHODOLOGY & CALCULATIONS
RSI Calculation
The indicator computes the Relative Strength Index over a user-defined period (default is 14), providing a measure of market momentum that reflects price changes over time.
Trend Determination Logic
By detecting when the RSI crosses above the upper threshold, the indicator signals a shift towards bullish momentum. Conversely, a crossunder below the lower threshold indicates bearish conditions. This straightforward binary approach filters out minor fluctuations, ensuring clarity in trend analysis.
Visual Signal Integration
Based on the detected trend, the RSI line is dynamically colored—green for bullish conditions and red for bearish conditions. An optional background color change further reinforces these signals, offering an immediate visual cue of prevailing market sentiment.
█ HOW TO USE THE INDICATOR
1 — Apply the Indicator
• Add the RSI Trend Bias indicator to a separate pane in your trading platform.
2 — Adjust Settings for Your Market
• RSI Length – Define the period for RSI calculation (default is 14).
• Threshold Levels – Set the upper (default 70) and lower (default 30) thresholds to identify overbought and oversold conditions.
• Visual Customization – Choose the bullish (green) and bearish (red) colors, and enable background color changes to enhance visual trend recognition.
3 — Interpret the Signals
• RSI Line – Observe the dynamically colored RSI line; a shift to green signals bullish momentum, while red indicates bearish conditions.
• Threshold Levels – Use the constant upper and lower lines as reference points for overbought and oversold states.
• Signal Timing – A crossover above the upper threshold or a crossunder below the lower threshold suggests potential entry or exit points.
4 — Integrate with Your Trading Strategy
• Combine RSI Trend Bias signals with other technical analysis tools to confirm market direction.
• Utilize the visual cues for fine-tuning your entry and exit decisions, ensuring robust risk management and optimized trade timing.
█ CONCLUSION
The RSI Trend Bias indicator offers a streamlined yet effective approach to monitoring market momentum. By leveraging the established principles of RSI analysis alongside dynamic visual cues, it enables traders to quickly identify bullish and bearish trends. Its customizable features and clear threshold indicators make it a valuable tool for enhancing technical analysis and making informed trading decisions.

Crypto Fear & Greed Score [Underblock]Crypto Fear & Greed Score - Methodology & Functioning
Introduction
The Crypto Fear & Greed Score is a comprehensive indicator designed to assess market sentiment by detecting extreme conditions of panic (fear) and euphoria (greed). By combining multiple technical factors, it helps traders identify potential buying and selling opportunities based on the emotional state of the market.
This indicator is highly customizable, allowing users to adjust weight parameters for RSI, volatility, Bitcoin dominance, and trading volume, making it adaptable to different market conditions.
Key Components
The indicator consists of two primary sub-scores:
Fear Score (Panic) - Measures the intensity of fear in the market.
Greed Score (Euphoria) - Measures the level of overconfidence and excessive optimism.
The difference between these two values results in the Net Score, which indicates the dominant market sentiment at any given time.
1. Relative Strength Index (RSI)
The indicator utilizes multiple RSI timeframes to measure momentum and overbought/oversold conditions:
RSI 1D (Daily) - Captures medium-term sentiment shifts.
RSI 4H (4-hour) - Identifies short-term market movements.
RSI 1W (Weekly) - Helps detect long-term overbought/oversold conditions.
2. Volatility Analysis
High volatility is often associated with fear and panic-driven selling.
Low volatility in bullish markets may indicate complacency and overconfidence.
3. Bitcoin Dominance (BTC.D)
Bitcoin dominance provides insights into capital flow between Bitcoin and altcoins:
Rising BTC dominance suggests fear as investors move into BTC for safety.
Declining BTC dominance indicates increased risk appetite and potential market euphoria.
4. Buying and Selling Volume
The indicator analyzes both buying and selling volume, ensuring a clearer confirmation of market sentiment.
High buying volume in uptrends reinforces bullish momentum.
Spikes in selling volume indicate panic and possible market bottoms.
Calculation Methodology
The indicator allows users to adjust weight parameters for each component, making it adaptable to different trading strategies. The formulas are structured as follows:
Fear Score (Panic Calculation)
Fear Score = (1 - RSI_1D) * W_RSI1D + (1 - RSI_4H) * W_RSI4H + (1 - Dominance) * W_Dominance + Volatility * W_Volatility + Sell Volume * W_SellVolume
Greed Score (Euphoria Calculation)
Greed Score = RSI_1D * W_RSI1D + RSI_4H * W_RSI4H + Dominance * W_Dominance + (1 - Volatility) * W_Volatility + Buy Volume * W_BuyVolume
Net Fear & Greed Score
Net Score = (Greed Score - Fear Score) * 100
Interpretation:
Above 70: Extreme greed -> possible overbought conditions.
Below -70: Extreme fear -> potential buying opportunity.
Near 0: Neutral market sentiment.
Trend Reversal Detection
The indicator includes two moving averages for enhanced trend detection:
Short-term SMA (50-periods) - Reacts quicklier to changes in sentiment.
Long-term SMA (200-periods) - Captures broader trend reversals.
How Crossovers Work:
Short SMA crossing above Long SMA -> Potential bullish reversal.
Short SMA crossing below Long SMA -> Possible bearish trend shift.
Alerts for SMA crossovers help traders act on momentum shifts in real-time.
Customization and Visualization
The Net Score dynamically changes color: green for greed, red for fear.
Users can adjust weightings directly from settings, avoiding manual script modifications.
Reference levels at 70 and -70 provide clarity on extreme market conditions.
Conclusion
The Crypto Fear & Greed Score provides a powerful and objective measure of market sentiment, helping traders navigate extreme conditions effectively.
🟢 If the Net Score is below -70, panic may present a buying opportunity.
🔴 If the Net Score is above 70, excessive euphoria may indicate a selling opportunity.
⚖️ Neutral values suggest a balanced market sentiment.
By customizing weight parameters and utilizing trend reversal alerts, traders can gain a deeper insight into market psychology and make more informed trading decisions. 🚀

MACD Highs and Lows - Dynamic Support & ResistanceDescription:
Enhance your trading strategy with the MACD Highs and Lows indicator, designed to identify dynamic support and resistance levels based on MACD crossovers. This tool plots key price levels triggered by shifts in MACD momentum, helping traders spot potential reversal zones, breakout points, and trend confirmation signals.
Key Features
Dynamic Levels: Automatically plots recent highs/lows when MACD crosses above/below the zero line.
Customizable MACD Parameters:
Adjustable fast/slow lengths (default: 12/26).
Choose between SMA or EMA for oscillator/signal line.
Flexible signal smoothing (1-50 periods).
Visual Clarity:
Clear green/red lines for highs and lows.
Tracks both price extremes and adjacent candle levels (e.g., high-of-low-bar, low-of-high-bar).
Multi-Timeframe Utility: Works across charts for swing trading, scalping, or trend analysis.
How It Works
Bullish Signal: When MACD crosses above zero, the indicator marks the recent lowest low (support) and its corresponding high.
Bearish Signal: When MACD crosses below zero, it plots the recent highest high (resistance) and its corresponding low.
Levels persist until the next crossover, creating actionable reference zones.
Use Cases
Trend Confirmation: Validate breakouts when price closes above/below plotted levels.
Stop Loss Placement: Set stops beyond recent dynamic highs/lows.
Divergence Detection: Spot discrepancies between MACD momentum and price action.
Settings Tips:
Increase Fast Length for responsiveness or Slow Length for smoother signals.
Use EMA for faster reactions, SMA for reduced noise.

Quantum Momentum FusionPurpose of the Indicator
"Quantum Momentum Fusion" aims to combine the strengths of RSI (Relative Strength Index) and Williams %R to create a hybrid momentum indicator tailored for volatile markets like crypto:
RSI: Measures the strength of price changes, great for understanding trend stability but can sometimes lag.
Williams %R: Assesses the position of the price relative to the highest and lowest levels over a period, offering faster responses but sensitive to noise.
Combination: By blending these two indicators with a weighted average (default 50%-50%), we achieve both speed and reliability.
Additionally, we use the indicator’s own SMA (Simple Moving Average) crossovers to filter out noise and generate more meaningful signals. The goal is to craft a simple yet effective tool, especially for short-term trading like scalping.
How Signals Are Generated
The indicator produces signals as follows:
Calculations:
RSI: Standard 14-period RSI based on closing prices.
Williams %R: Calculated over 14 periods using the highest high and lowest low, then normalized to a 0-100 scale.
Quantum Fusion: A weighted average of RSI and Williams %R (e.g., 50% RSI + 50% Williams %R).
Fusion SMA: 5-period Simple Moving Average of Quantum Fusion.
Signal Conditions:
Overbought Signal (Red Background):
Quantum Fusion crosses below Fusion SMA (indicating weakening momentum).
And Quantum Fusion is above 70 (in the overbought zone).
This is a sell signal.
Oversold Signal (Green Background):
Quantum Fusion crosses above Fusion SMA (indicating strengthening momentum).
And Quantum Fusion is below 30 (in the oversold zone).
This is a buy signal.
Filtering:
The background only changes color during crossovers, reducing “fake” signals.
The 70 and 30 thresholds ensure signals trigger only in extreme conditions.
On the chart:
Purple line: Quantum Fusion.
Yellow line: Fusion SMA.
Red background: Sell signal (overbought confirmation).
Green background: Buy signal (oversold confirmation).
Overall Assessment
This indicator can be a fast-reacting tool for scalping. However:
Volatility Warning: Sudden crypto pumps/dumps can disrupt signals.
Confirmation: Pair it with price action (candlestick patterns) or another indicator (e.g., volume) for validation.
Timeframe: Works best on 1-5 minute charts.
Suggested Settings for Long Timeframes
Here’s a practical configuration for, say, a 4-hour chart:
RSI Period: 20
Williams %R Period: 20
RSI Weight: 60%
Williams %R Weight: 40% (automatically calculated as 100 - RSI Weight)
SMA Period: 15
Overbought Level: 75
Oversold Level: 25
