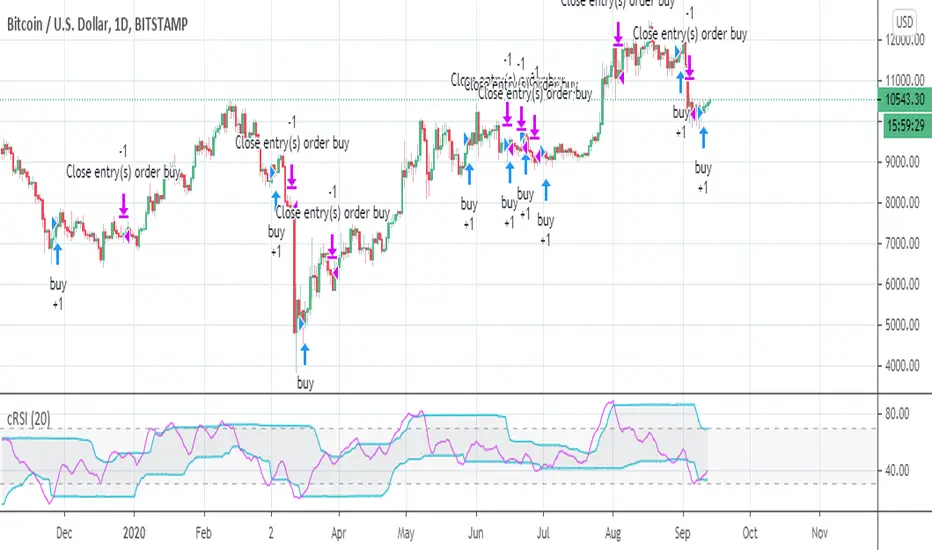
Combo Backtest 123 Reversal & Fractal Chaos Oscillator This is combo strategies for get a cumulative signal.
First strategy
This System was created from the Book "How I Tripled My Money In The
Futures Market" by Ulf Jensen, Page 183. This is reverse type of strategies.
The strategy buys at market, if close price is higher than the previous close
during 2 days and the meaning of 9-days Stochastic Slow Oscillator is lower than 50.
The strategy sells at market, if close price is lower than the previous close price
during 2 days and the meaning of 9-days Stochastic Fast Oscillator is higher than 50.
Second strategy
The value of Fractal Chaos Oscillator is calculated as the difference between
the most subtle movements of the market. In general, its value moves between
-1.000 and 1.000. The higher the value of the Fractal Chaos Oscillator, the
more one can say that it follows a certain trend – an increase in prices trend,
or a decrease in prices trend.
Being an indicator expressed in a numeric value, traders say that this is an
indicator that puts a value on the trendiness of the markets. When the FCO reaches
a high value, they initiate the “buy” operation, contrarily when the FCO reaches a
low value, they signal the “sell” action. This is an excellent indicator to use in
intra-day trading.
WARNING:
- For purpose educate only
- This script to change bars colors.
M-oscillator

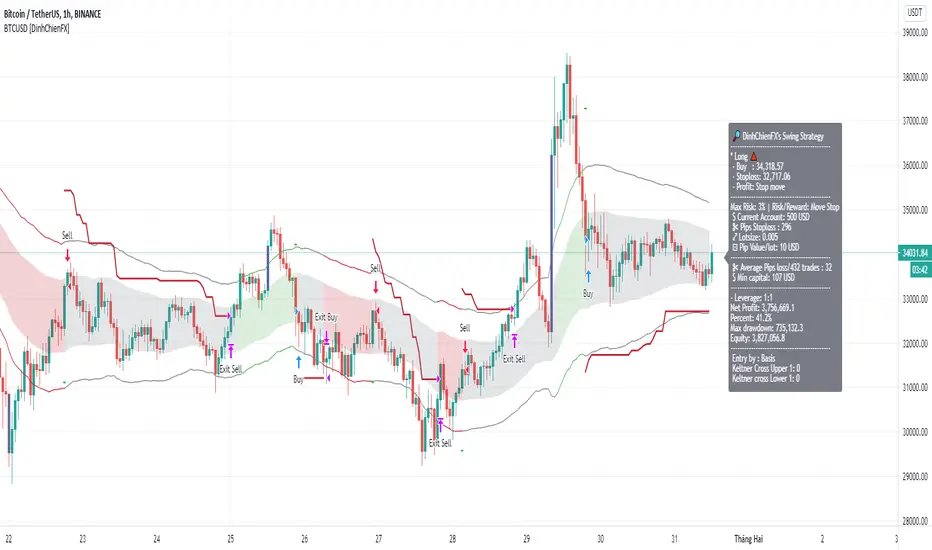
BTCUSD signal [DinhChienFX Corner] Ver 2.01. How to use Keltner Channel
a_ Length of Keltner's basis line is 50. It gives the best result in finding rule of BTCUSD.
b_ How to confirms a trend.
- Upper 2 is used to confirm Keltner channel at Uptrend.
- Lower 2 is used to confirm Keltner channel at Downtrend.
c. How to determine a swing Entry.
_ Upper 1 is used to buy when the market make a corrective.
_ Lower 1 is used to sell when the market make a corrective.
2. Long signal is confirmed when Closed of candle crossover the Upper 2.
3. Short signal is confirmed when Closed of candle crossunder the Lower 2.
4. Stoploss is calculated by the price closed candle +/- the value of Average true range (length=20 bars)
Stoploss = previous Close +/- atr(20)x2
-> To move the stoploss every 1 hour.
5. Filter the Candle is over 93% for Not Entry.
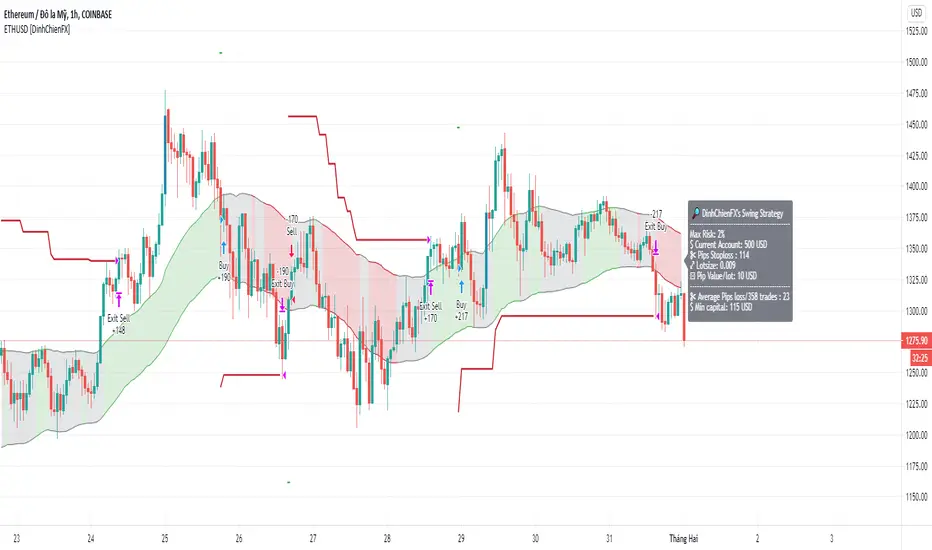
ETHUSD signal [DinhChienFX Corner] Ver 1.01. How to use Keltner Channel
a_ Length of Keltner's basis line is 50. It gives the best result in finding rule of ETHUSD.
b_ How to confirms a trend.
- Upper 1 is used to confirm Keltner channel at Uptrend to give Buy_1.
- Lower 1 is used to confirm Keltner channel at Downtrend to give Sell_1.
c. How to determine a swing Entry.
- Upper 1 is used to buy when the market make a corrective.
- Lower 1 is used to sell when the market make a corrective.
d. Color count calculate
- Color count = Green + Red
- If Color count > 0 is Uptrend to give Buy_2
- If Color count < 0 is Downtrend to give Sell_2
2. Long signal is confirmed when Closed of candle crossover the Upper 1 & Color count for Uptrend.
3. Short signal is confirmed when Closed of candle crossunder the Lower 1 & Color count for Downtrend.
4. Stoploss is calculated by the price closed candle +/- the value of Average true range (length=20 bars)
Stoploss = previous Close +/- atr(20)x2x0.9
-> To move the stoploss every 1 hour.
5. Filter the Candle is over 93% for Not Entry.
6. Report the result at Backtest:
a. Longterm result 2018-23/9/2020:
b. Midterm result (every year)
_ 2018-2019:
_ 2019-2020:
c. Shortterm 01/01/2020 to 09/23/2020
--------------
"Use the link below to obtain access to this indicator" or "PM us to obtain access"
Combo Backtest 123 Reversal & Fractal Chaos Bands This is combo strategies for get a cumulative signal.
First strategy
This System was created from the Book "How I Tripled My Money In The
Futures Market" by Ulf Jensen, Page 183. This is reverse type of strategies.
The strategy buys at market, if close price is higher than the previous close
during 2 days and the meaning of 9-days Stochastic Slow Oscillator is lower than 50.
The strategy sells at market, if close price is lower than the previous close price
during 2 days and the meaning of 9-days Stochastic Fast Oscillator is higher than 50.
Second strategy
Stock market moves in a highly chaotic way, but at a larger scale, the movements
follow a certain pattern that can be applied to shorter or longer periods of time
and we can use Fractal Chaos Bands Indicator to identify those patterns. Basically,
the Fractal Chaos Bands Indicator helps us to identify whether the stock market is
trending or not. When a market is trending, the bands will have a slope and if market
is not trending the bands will flatten out. As the slope of the bands decreases, it
signifies that the market is choppy, insecure and variable. As the graph becomes more
and more abrupt, be it going up or down, the significance is that the market becomes
trendy, or stable. Fractal Chaos Bands Indicator is used similarly to other bands-indicator
(Bollinger bands for instance), offering trading opportunities when price moves above or
under the fractal lines.
The FCB indicator looks back in time depending on the number of time periods trader selected
to plot the indicator. The upper fractal line is made by plotting stock price highs and the
lower fractal line is made by plotting stock price lows. Essentially, the Fractal Chaos Bands
show an overall panorama of the price movement, as they filter out the insignificant fluctuations
of the stock price.
WARNING:
- For purpose educate only
- This script to change bars colors.

CC - Moon TraderMakes trades based on the moon's elliptical cycle. Only "works" at a 1m, 1h, 1d scale, highly experimental and is only using the crudest orbital math. Please do not use this strategy for anything other than research. At this point, it was just a feasibility test. Let me know your opinions. Thank you.

ADX strategy (considering ADX and +DI only )I have been checking the strategies on ADX indicator.
I have found that +DI crossing above ADX line under threshold 30 and exit on crossdown when ADX above 30 has better results than just following crossovers of +DI and -DI , ADX crossing above 30 .
BUY Rule
========
fast ema is above slow ema (default 13 and 55 , you can change these values in settings)
+DI cross above ADX well beloe threshold level (default 30)
Exit reule
========
when +DI cross down ADX , well above on threshold level
Stop Loss
=========
Default is set to 8%
Take a look and let me know how your symbol works with this strategy
Note : Bar color changes to yellow when the BUY condition is met.
Bar color and Background color shows to blue --- if Long position is active
fast ema and long ema doesnt print on the chart -- please add manually to the chart
Warning : for the use of educational purposes only

Combo Backtest 123 Reversal & Floor Pivot Points This is combo strategies for get a cumulative signal.
First strategy
This System was created from the Book "How I Tripled My Money In The
Futures Market" by Ulf Jensen, Page 183. This is reverse type of strategies.
The strategy buys at market, if close price is higher than the previous close
during 2 days and the meaning of 9-days Stochastic Slow Oscillator is lower than 50.
The strategy sells at market, if close price is lower than the previous close price
during 2 days and the meaning of 9-days Stochastic Fast Oscillator is higher than 50.
Second strategy
The name ‘Floor-Trader Pivot,’ came from the fact that Pivot points can
be calculated quickly, on the fly using price data from the previous day
as an input. Although time-frames of less than a day can be used, Pivots are
commonly plotted on the Daily Chart; using price data from the previous day’s
trading activity.
WARNING:
- For purpose educate only
- This script to change bars colors.

Gladiator USDJPY1 ) This strategy is based on VWAP.
2 ) This strategy is based on BB+.
3 ) This strategy is based on a range.
4 ) This strategy has only longs. Shorts are separate.
It buys according to a flat position 10000 JPY per order.
Maximum positions are 1000 000 JPY which is 10x leverage with an initial balance of 100 000 JPY.
Take profit scales with a recent price range during an uptrend.
During a downtrend, there is a static take profit.
Commisions are 0.02JPY per contract.
Slippage is 5 pips.

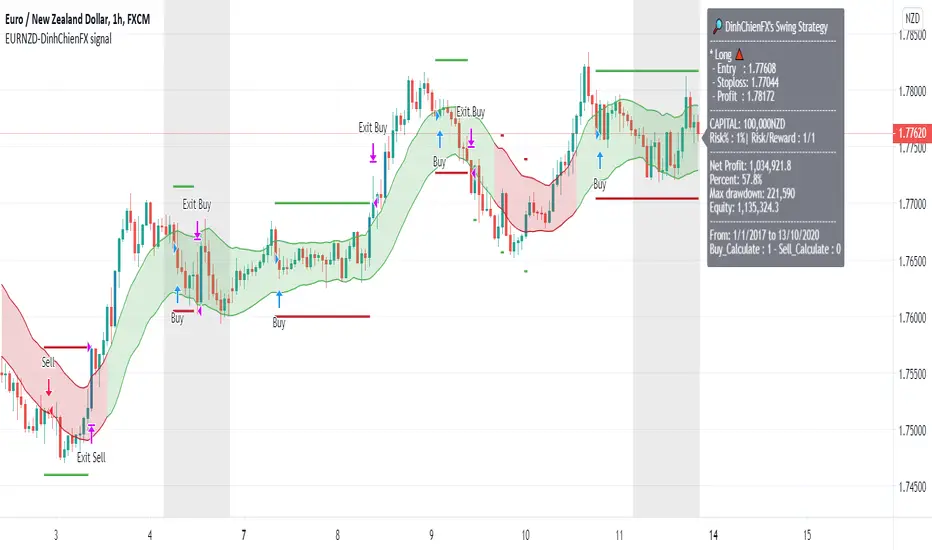
EURNZD signal [DinhChienFX Corner] V1.0The right screen is never predicting before. Just a the best result at the history for confident to using for Trade.
------------------------
Risk: 1%.
1. The Long signal is calculate by the RSI indicator crossover 70, wait to Buy when the price corrects and crossunders the Upper Keltner Channel.
2. The Short signal is calculate by the RSI indicator crossunder 30, wait to Sell when the price corrects and crossovers the Lower Keltner Channel.
3. Stoploss and Take Profit is calculated by Plus or Minus the Average True Range indicator from the Price Entry.
4. Report the result at Backtest:
a. The Long-term result: 1/1/2017 - 13 Sep 2020
b. The Mid-tern result (every year):
- From 1/1/2017 to 1/1/2018:
- From 1/1/2018 to 1/1/2019:
- From 1/1/2019 to 1/1/2020:
c. The Short-term result:
- From 1/1/2020 - 13 Sep 2020
---------------------------------------
The right screen is never predicting before. Just a the best result at the history for confident to using for Trade.
---------------------------------------
"Use the link below to obtain access to this indicator" or "PM us to obtain access"
RSI cyclic smoothed strategy backtestI added a few lines of code to "when to trade"'s code to see that backtest result of "RSI cyclic smoothed v2".
Daytrader strategies for major currenciesHello,
This technique is for those who want the most simple method that is almost fool-proof. It must be done only during the busiest trading hours, 3 am to 11 am EST. This method doesn't work in sideways markets, only in volatile trending markets.
Indicators:
Ema 3
MA 20
Awesome Oscillator.
Enter Long: when the red 3 EMA has crossed up through the middle band at the same time, the AO should be approaching or crossing it's zero line, going up.
Enter Short: when the red 3 EMA has crossed down through the middle band at the same time, the AO should be approaching or crossing it's zero line, going down.
In this strategy, both the entry and exit happen only during the london session.

Wavetrend strategy with trading session for any time chartHello there
Today I am glad to provide you a strategy based on the wave trend oscillator. If you want to use it as an indicator, just disable long and short to not make any shops.
It works on all time frames.
The way it works its like an RSI .
We have overbought and oversold levels, and together with a channel and length we calculate the wave trend.
And then like in RSI, when we cross those lines we buy or sell depending on which lines we cross.
For risk management, so far its not implemented, but it can be done in many ways.
The only thing I applied is to always close a trade at the end of friday day. At the same time it can be applied the rule to sell when % of equity is lost, or at the end of a trading session like london,neywork and so on.
For any questions or doubts, let me know.
Hope you enjoy it :)

Kitti-PlayBook Stoch RSI + RSI V6.5 1) Strategy Versions develop from Version 4.0
2) Entry and Exit Conditions
Logic :
Entry Long conditions.
Entry When
Case 1 : Fast > Slow and Yesterday Fast < Slow ( 1st day Bullish ) ==> LongC1
Case 2 : %K crossover Stoch Lower Line and Bullish ==> LongC2
Case 3 : %K crossover %D in The Zone between Stoch Lower Line and Stoch Upper Line and Bullish ==> LongC3
Case 4 : %K crossover Stoch Upper Line and Bullish ==> LongC4
==============================
Exit When
Case 1 : Fast < Slow and Yesterday Fast > Slow ( 1st day Bearish )
Case 2 : %K cross under Stoch Upper Line
====== System 1 : Trend & Multi positions ========================
LS1 = Case 1 or Case 2 or Case3
Exit SYS1 = Exit Case 1
====== System 2 : Micro Trend ===================================
LS2 = Case2 or Case 4
Exit SYS2 = Exit Case2 or Exit case1
3) Can Adjust Number of Hold Positions

Scalper v1A trend following strategy which uses regression to estimate buying and selling, the regression is done using oscillators and filters. This strategy can be used to scalp if you can wait till the candle is fully painted and you have a good sense of market.
Trade at your own risk no one can guarantee a 100% strike rate!

Coppock Curve StrategyThis strategy makes use of a not widely known technical indicator called "Coppock Curve".
The indicator is derived by taking a weighted moving average of the rate-of-change (ROC) of a market index such as the S&P 500 or a trading equivalent such as the S&P 500 SPDR ETF. For more info: (www.investopedia.com)
This strategy uses $SPY Coppock curve as a proxy to generate buy signals on other ETF's and stocks.
Buy signals are generated when the Coppock Curve crosses above zero, and sell signals are generated when it crosses below.
An optional, trailing stop loss is available, with default settings to 100% so that it does not currently affect the buy and sell signals solely generated by the Coppock Curve. But you may find adding a Trailing stop loss may improve results on certain ETF's/Stocks.
You may also change the symbol for which signals are generated for, default is $SPY.
The published example shows using this strategy on a leverage ETF $TQQQ w/ starting capital of 10k, w/ 10k per trade. Try it on other stocks such as $AAPL, $AMZN $NFLX ect... I have found it to be an effective strategy that has a favorable risk to reward profile.
Any questions, please let me know!

NZDJPY signal [DinhChienFX Corner] Ver 1.0The right screen is never predicting before. Just a the best result at the history for confident to using for Trade.
------------------------
Risk: 1%.
1. The Long signal is calculate by the Close of candle crossing up The Keltner Channel Upper.
2. The Short {Sell] signal is calculate by the Close of candle crossing down The Keltner Channel Lower.
3. Reset the Up/Down confirm at Entry.
4. Don''t entry when occurs the Reversal Candle (over 80% the Heigh of Keltner Channel).
a. Not filter the Candel is over 80%.
b. Filter the Candel is over 80% for Not Entry.
5. Stoploss and Take Profit is calculated by Plus or Minus from the Price Entry.
6. Report the result at Backtest:
a. The Long-term result:
b. The Mid-tern result (every year):
- From 1/1/2017 to 1/1/2018:
- From 1/1/2018 to 1/1/2019:
- From 1/1/2019 to 1/1/2020:
c. The Short-term result:
- From 1/1/2020 to 5 Sep 2020
---------------------------------------
The right screen is never predicting before. Just a the best result at the history for confident to using for Trade.
Thanks for watching .

EURUSD signal [DinhChienFX Corner] Ver 3.0* Signals are tested successfully for 3.5 years with a steady win rate year on year until now.
Risk: 1%.
* Backtest time: 3.5 years / Premium, varies between currency pairs (Cryto default backtest time is shorter since the market is open both Saturday and Sunday: about 2 years).
The price rule of EURUSD in 20,000 past H1 candles past:
- Upterm (Long): Buy
+ When the price crossing up (Crossover) the Upper line gives 1 point.
- Downterm (Short): Sell
+ When the price crossing down (Crossunder) the Lower line gives 1 point.
- 2 or more points (> = 2), the entry conditions are met
- The entry point for the highest winning rate: when the price adjusts to the Upper / Lower line, the order price is at the closing price of the adjustment candle.
- When the above conditions are met, the Indicator shows a Buy / Sell signal according to the trend.
-----------------------------------
- Maximum risk / reward winning ratio: 1 / 1.05
- Stoploss: Calculated from the entry point + - actual fluctuation with the formula ATR (20) * risk ratio (risk).
- Profit: Calculated from the entry point + - actual fluctuation by the formula ATR (20) * reward ratio (reward).
- Profit: So the product has a stable profit of over 30% / year.
- Should backtest 3 Years (long term), every Year (medium term) and quarterly or 6 months (short term). If each year the success rate is always over 50%, it can be used for real trade.

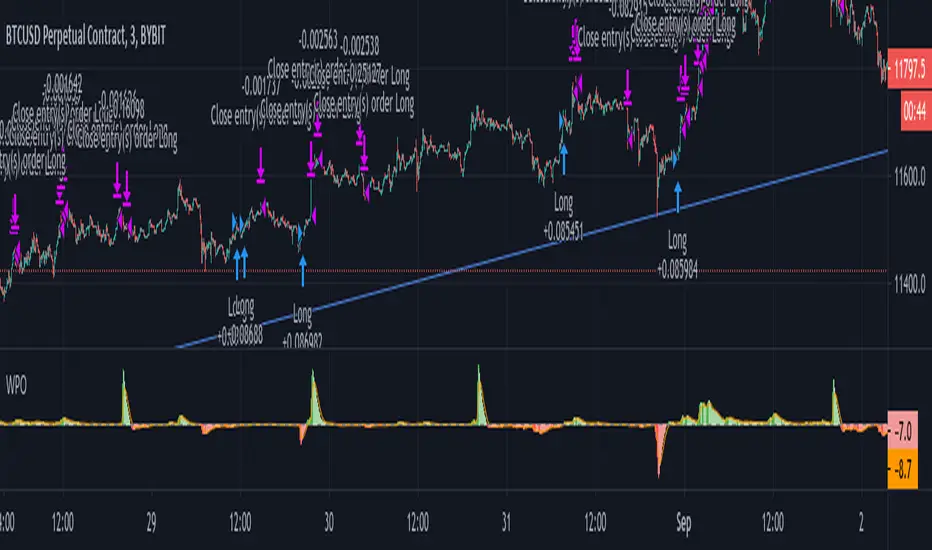
Weighted Price Oscillator (STRATEGY)Weighted Price Oscillator is an unique indicator that shows the relationship between two custom variables that trigger signals upon specific conditions. When WPO (short for weighted price oscillator) crosses over the signal or zero line, it creates a buy signal and conversely below the signal or zero line, it generates a take profit signal. All of which are provided that the specific conditions are met.
Inside the script's options, the following options are: signal sensitivity, enable signal background color, and take profit percentage. The signal sensitivity allows you to adjust the script's trigger sensitivity, so that the script can fire signals appropriate for a specific timeframe. Enabling signal background color will provide a visual on the oscillator when a buy or take profit signal is being created. And lastly, the take profit percentage option is for configuring the trade size percentage of which you want to take profit with.
PM me for access.
Combo Backtest 123 Reversal & Future Lines of Demarcation This is combo strategies for get a cumulative signal.
First strategy
This System was created from the Book "How I Tripled My Money In The
Futures Market" by Ulf Jensen, Page 183. This is reverse type of strategies.
The strategy buys at market, if close price is higher than the previous close
during 2 days and the meaning of 9-days Stochastic Slow Oscillator is lower than 50.
The strategy sells at market, if close price is lower than the previous close price
during 2 days and the meaning of 9-days Stochastic Fast Oscillator is higher than 50.
Second strategy
An FLD is a line that is plotted on the same scale as the price and is in fact the
price itself displaced to the right (into the future) by (approximately) half the
wavelength of the cycle for which the FLD is plotted. There are three FLD's that can be
plotted for each cycle:
An FLD based on the median price.
An FLD based on the high price.
An FLD based on the low price.
WARNING:
- For purpose educate only
- This script to change bars colors.

EURUSD 5min london session strategyHey, today I bring you another strategy that I pull up together.
Its a KISS system ( keep it stupid simple )
We have 2 ma of 5 lenght each, one applied to the high and the other to low. With this we create a channel.
If the candle close above or below the channel we got a signal. Then we can optionally verify with the RSI to increase our chances.
At the same time, this system, only trades during the london session ( can be changed), and it has 2 rules, preferably no more than 5 trades / day, and no more than 2% risk of equity lost .
We also have a TP/SL system made of pips.
Enjoy it.

Simple and efficient 1h strategyThis strategy is made from a crossover of 2 ema : 4 and 8 in this case, together with a RSI of lenght 10 applied to hl2
The strategy is simple : we enter when we have a cross between the 2 ma's and rsi at the same time is in ascending or descending position crossing the middle line of 50.
For exit we have : at the end of a session( we trade only between london and newyork in this case, so we exit newyork), or through a tp/sl pip point system.
Hope you enjoy it.

Ema-Weighted-GainStrategy Inputs: Capital=$10,000, Pyramiding=3, Default Quantity=1
Please note that the strategy buys when the WMA (Blue line) cross under zero and sell above it, your experience is very important in using this indicator. Do not follow the buy/sell signals. Read the plot as I explain in the Uses Section and make your own conclusion on how to use it.
Description,
This Strategy uses multiple Ema’s to calculate Weighted HPR's.
I have calculated the weight numbers based on Fibonacci.
Uses:
NOTE!! (Please Do not take those uses to be 100% Guaranteed. User your experience and judgment to decide your trade).
Zoom out to see all the arrows
White line (MA)
Blue line (WMA)
First
Ride Trends,
1-Downtrend: short
a-MA IS going down
b-Entry: WMA cross above or near the MA (White Arrows).
2-Uptrend:long
a-MA is going up
b-Entry: WMA goes below MA or Near it(Green Arrows).
Second
Trend Reversal
1-buy entry.
WMA at zero, or very close to it, in pullback (Yellow Arrows).
2-short entry
WMA at zero, or very close to it, in a bounce (Orange Arrows).
Third
Divergence as explained in the Red Arrows.
Conclusion,
Red Arrows= Divergence
Green Arrows= Buy entry (The stock is in uptrend)
Yellow Arrows= Buy entry (the stock is in downtrend and could reverse)
White arrows= short entry (the stock is in downtrend)
Orange arrows=short entry (the stock in uptrend and can reverse)
If you are interested, send a private message

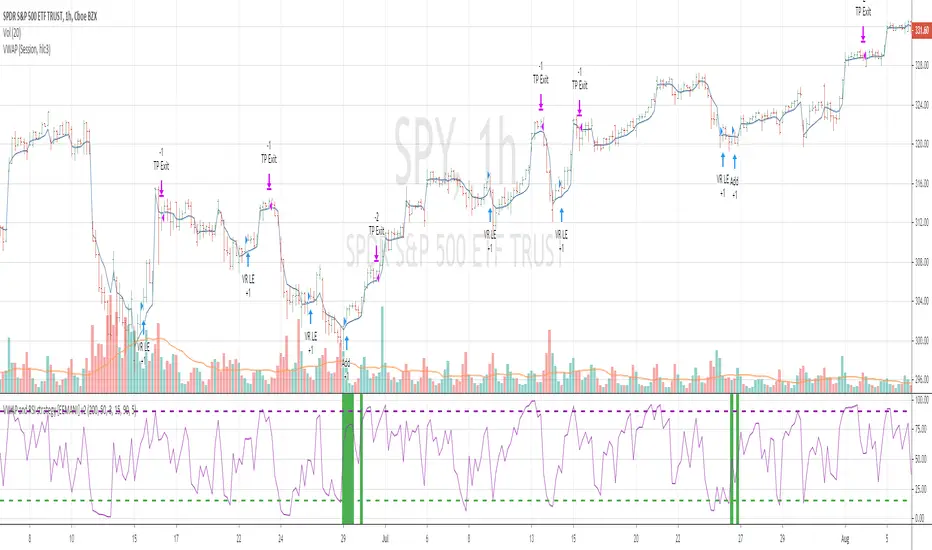
VWAP and RSI strategyThis strategy combines VWAP and RSI indicators
BUY RULE
1. EMA50 > EMA 200
2. if current close > vwap session value and close>open
3. check if RSI3 is dipped below 10 for any of last 10 candles (as defined rsi_buy_level)
EXIT RULE
1. RSI3 crossing down 90 level (as defined in rsi_sell_level)
STOP LOSS EXIT
1. default is set to 5%
you need to add EMA 50 , EMA 200 and VWAP (session) indicators to the chart to see how these signals are generated
This strategy is tested on SPY and QQQ index stocks on hourly chart.
Warning
for educational purposes only