Candle Overlay htf embedHTF Candle Overlay for mltf candle
A candle overlay that provides ease of use for the 1m chart to see candle structures of 30m or more from 1m. (with OHLC)
Lowtimeframe

TTC EMA Scalping Machine with RSI Filter and MACDTTC EMA Scalping Machine with RSI Filter and MACD
TTC EMA Scalping Machine with RSI Filter and MACD is a multi-layered technical analysis tool designed for traders looking to scalp the markets with a combination of trend-following and momentum-based indicators. This strategy leverages Exponential Moving Averages (EMAs) , Relative Strength Index (RSI) , MACD , and Volume Analysis to help traders identify high-probability entry points for short and long trades. The indicator can be used in multiple market conditions and is suited for both beginners and experienced traders looking for clear entry signals.
---
Key Features :
1. EMA-Based Trend Filtering :
- The indicator uses four Exponential Moving Averages (EMAs) with different periods:
- EMA 10 (Short-Term) : The fastest-moving average for detecting quick price movements.
- EMA 20 (Medium-Term) : A central trendline for market momentum.
- EMA 30 (Long-Term) : To observe broader market trends.
- EMA 50 (Longest-Term) : To identify the overall market direction.
- These EMAs are plotted on the chart and used to create EMA bands , visually displaying potential support and resistance levels. Price action inside these bands helps identify scalping opportunities.
2. RSI Filter :
- RSI (Relative Strength Index) is used to gauge overbought and oversold conditions in the market:
- Overbought condition (RSI > 70) : The market may be overextended, signaling the possibility of a short.
- Oversold condition (RSI < 30) : The market may be undervalued, signaling the possibility of a long.
- The RSI filter ensures that trades are not taken when the market is overextended, offering a more conservative approach to trade entries.
3. MACD Momentum Analysis :
- The MACD (Moving Average Convergence Divergence) indicator is included to confirm the trend and momentum direction:
- Long Condition : The MACD line crosses above the signal line, confirming a bullish momentum.
- Short Condition : The MACD line crosses below the signal line, confirming a bearish momentum.
- This serves as an additional filter to verify if the market momentum aligns with the long or short entry criteria.
4. Long Entry (Buy Signal) :
- A long entry signal is triggered when the following conditions are met:
- The price is above EMA 20 (indicating an overall bullish market).
- The price is within the green EMA band (EMA 10 and EMA 20), suggesting short-term support.
- The RSI is below 70 (indicating the market is not overbought).
- The MACD line is above the signal line , showing bullish momentum.
- These conditions combined suggest an ideal environment for entering a long position.
5. Short Entry (Sell Signal) :
- A short entry signal is triggered when the following conditions are met:
- The price is below EMA 20 (indicating an overall bearish market).
- The price is within the green EMA band (EMA 20 and EMA 30), suggesting short-term resistance.
- The RSI is above 30 (indicating the market is not oversold).
- The MACD line is below the signal line , showing bearish momentum.
- These conditions combined suggest an ideal environment for entering a short position.
6. Signal Alerts :
- Long Alerts : Users can set alerts to notify them when a long condition is met. These alerts are triggered when all the criteria for a long entry are satisfied.
- Short Alerts : Similarly, users can set alerts for short signals, notifying them when all the conditions for a short entry are satisfied.
7. EMA Bands :
- The EMA bands are visually represented with colored fills between the EMAs, providing a visual aid to recognize potential trading zones. These zones can serve as a reference for traders to make quick decisions regarding entries and exits.
8. Volume Filter :
- The indicator also includes a volume filter , which compares the current volume to its 20-period simple moving average. Higher volumes provide confirmation of price movement, which can indicate stronger potential for the trade.
---
How It Works :
- Long Trades : The indicator suggests a long position when the price is above the EMA 20, within the green EMA band, the RSI is not overbought, and MACD confirms bullish momentum (MACD line above the signal line).
- Short Trades : The indicator suggests a short position when the price is below the EMA 20, within the green EMA band, the RSI is not oversold, and MACD confirms bearish momentum (MACD line below the signal line).
- Volume Confirmation : The indicator uses a volume-based filter to ensure the trade is backed by sufficient market participation.
---
Usage :
- Best for Scalping : This strategy is designed for short-term trades ( scalping ) and can be applied to any time frame, though it works best on intraday charts, such as 5-minute or 15-minute charts.
- Ideal for Trend-Following : With the use of EMAs and MACD, the strategy is best suited for markets that exhibit clear trends. It helps to avoid whipsaw trades and focuses on capturing medium-term trends.
- Risk Management : By using RSI, MACD, and volume analysis together, this strategy reduces the likelihood of entering a trade in an overextended market, which helps with risk management.
---
Alerts and Signals :
- Long Signals : When all conditions are met for a long trade, a green label appears below the price bar, indicating a potential buy opportunity. An alert is also generated, notifying the user.
- Short Signals : When all conditions are met for a short trade, a red label appears above the price bar, indicating a potential sell opportunity. An alert is also generated, notifying the user.
---
This combination of EMA , RSI , MACD , and volume-based filters creates a balanced approach to scalping, ensuring that traders receive clear, actionable entry signals with trend confirmation, while avoiding overbought and oversold conditions that may lead to false signals. The indicator is designed to help traders confidently identify high-probability trades while maintaining simplicity and clarity in its setup.

Overlay Mini Plot(s) of Correlated Asset(s)Overlay a small plot of a correlated asset of your choosing. Shrink/expand, Set vertical and horizontal position, plot multiple mini-plots via duplicate indicators with varied settings.
Plots the last X bars of any asset; including the live candle currently painting
Useful for low time frame trading when you want to see correlated asset price movement right alongside the price movement you're watching.
Useful for quick and simple comparisons; when you don't want the clutter of split screen or multi-pane view.
Useful for backtesting.
Price scale agnostic; just plots the shape of the recent price action, with several optional labels: Asset+timeframe | Live Price | Highest price over X bars | Lowest price over X bars.
Works fine with all the assets i've tested it on.
~~User inputs~~
-number of bars to paint.
-horizontal offset: plot to right X bars or to left X bars
-vertical offset: shift up or down, shrink or expand; by using 2 'spacer' inputs
-color/transparancy of candles and price labels.
-width (pixels) of candle bodies.
-choose to display price labels or not
-choose to display asset label or not
~~Tips~~
--Add several of these indicators; changing the vertical 'Shift/Shrink' settings on each to visually separate them.
--In the above chart or EurUsd, there are three indicators =>> three mini-plots overlaid: DXY, EurGbp and GbpUsd. Using the following settings for Space Above:Space Below: DXY- 0.1:4.5 | EurGbp- 1.8:1.8 | GbpUsd- 4.5:0.1
--the more you add, the more you'll have to vertically shrink the plots
© twingall

MACD EMA - TradingRush StrategyHey there!
Today I present you a rather simple, but very profitable MACD strategy. Since I trade it with cryptocurrencies, the settings have been adjusted.
I discovered the strategy on a YouTube channel and tried to transfer it as a strategy into a script.
Tested with the crypto pair ETH/USDT in the 15 minute chart.
There is the possibility to switch between short and long positions.
-----------------------------------------------------------------------------------
How does the strategy work?
ENTRY
The MACD indicator must cross below the histogram. If it crosses when the price is below the EMA, only short positions are traded. Above the EMA - long.
EXIT
The Lowest Low (long) / highest high (short) serves as the stop loss. The TP is formed on the basis of a factor. (SL multiplied by factor 2.1 = TP).
The red lines are used to illustrate the SL. Above for short positions below for long positions.
The results of the strategy are without commissions and levers.
If you have any questions or feedback, please let me know in the comments.
If you need more information about the strategy and want to know exactly how to apply it, check out my profile.
I wish you good luck with the strategy!

EMA RSI ATR Hidden Div Strat - 1 MinHey there!
Hereby I present you the EMA RSI Lowest Low Hidden Divergence strategy, which I discovered on a youtube channel.
He has tested the strategy hundreds of times manually, herewith I try to automate the whole thing.
Since I use the strategy with a bot, it can only enter long positions for now. But in the future I will add the possibility to trade short positions.
The strategy was tested with BTC/ USDT in 1m chart (8 days). The values must be adjusted depending on the timeframe and coin.
-----------------------------------------------------------------------------------
How does the strategy work?
First of all, we need a bullish hidden divergence.
Once this is detected, the following parameters are checked:
The 50 EMA must cross the 250 EMA .
Then, the candle must close above the 50 EMA .
The K line of the RSI STOCH indicator need to crosses the D line.
If the next candle closes above the 50 EMA , a long position is opened.
The stop loss is determined with the "lowest low/highest high lookback".
The profit factor is multiplied by the value of the lowest low/highest high lookback.
The results of the strategy are without commissions and levers.
If you have any questions or feedback, please let me know in the comments.
In the future I will add other types of stop loss / take profits. (ATR; %; eg.)
I wish you good luck with the strategy!

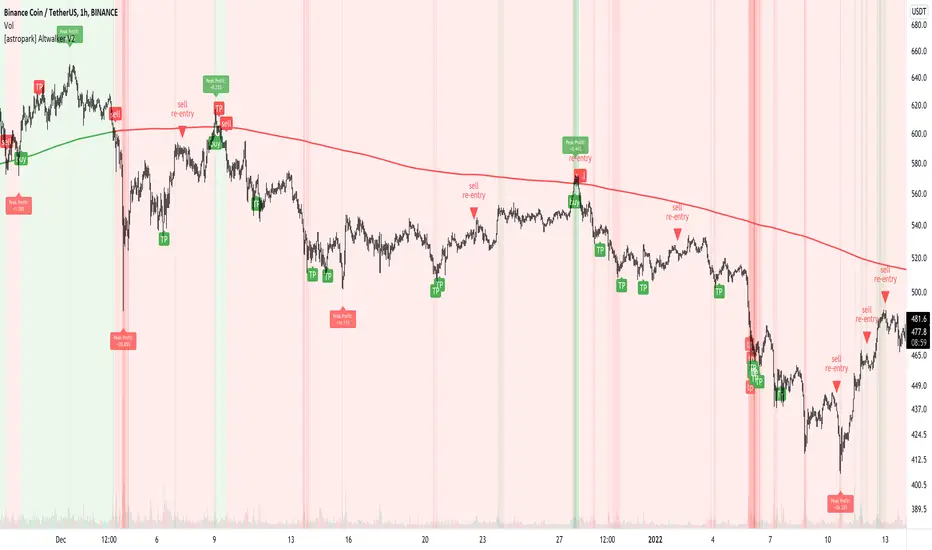
[astropark] Altwalker V2Dear Followers,
today I'm happy to share with you Altwalker V2 , an updated version of the former Altwalker for lower timeframes (from 5 minutes to 4 hours).
It is both a Swing and Scalping Strategy indicator , based on a simple trend following theory , mainly designed for Cryptocurrencies, Altcoins and of course Bitcoin.
Here you can see the Altwalker V1:
Based on Moving Average, Altwalker V2 on low timeframes dynamically identifies market resistance and support, so in which trend a cryptocurrency is during time:
green trendline and background means bullish trend , in fact it start with a "buy" signal
red trendline and background means bearish trend , in fact it start with a "sell" signal
if a series of buy and sell appears (this may happen especially in lower timeframes), this means price is in consolidation or distribution phase, so be prepared for a new trending phase coming soon, always remembering that taking profits is awesome and managing your risk by defining you position size and having a stoploss is a must in trading
To help in Taking Profits, Altwalker integrates also 2 special tools besides the trend highlighter:
Overbought and Oversold RSI Signals , which appear both as darker background (the darker the color, the more the price is in overbought/oversold) and green "ob"-"tp" / red "os"-"tp" labels (they optionally pop up only on a configurable stronger overbought/oversold condition) (you can enable/disable it optionally)
Peak Profit Tracker , which resets every time a new trade start and keeps track of price fluctuation during the trade: the message is don't be too much greedy and take profits or lock them with a stoploss in profit (you can enable/disable it optionally)
You can edit many options in order to
enable/disable showing buy/sell signals
enable/disable showing trendline
edit trendline variant (you have 2 options, by default variant 1 is selected)
enable/disable showing trend as background
enable/disable showing RSI TP signals
edit RSI length, overbought (OB) and oversold (OS) levels
enable/disable showing peak profits on each trade
The user who wants to use this strategy, especially via an automated bot, must always set a stoploss (example 150$ from entry on bitcoin ) or use a proper risk management strategy .
This is not the "Holy Grail", so use it with caution. It's highly suggested to use a proper money management .
This script will let you set all notifications you may need in order to be alerted on each triggered signals.
Here there are some examples how Altwalker V2 works on many timeframes and markets:
LINK/USDT 1h
XLM/BTC 1h
ETH/BTC 1h
ETH/USDT 1h
COMP/USDT 1h
YFI/USDT 15m
NEO/BTC 5m
VET/USDT 15m
This is a premium indicator , so send me a private message in order to get access to this script .
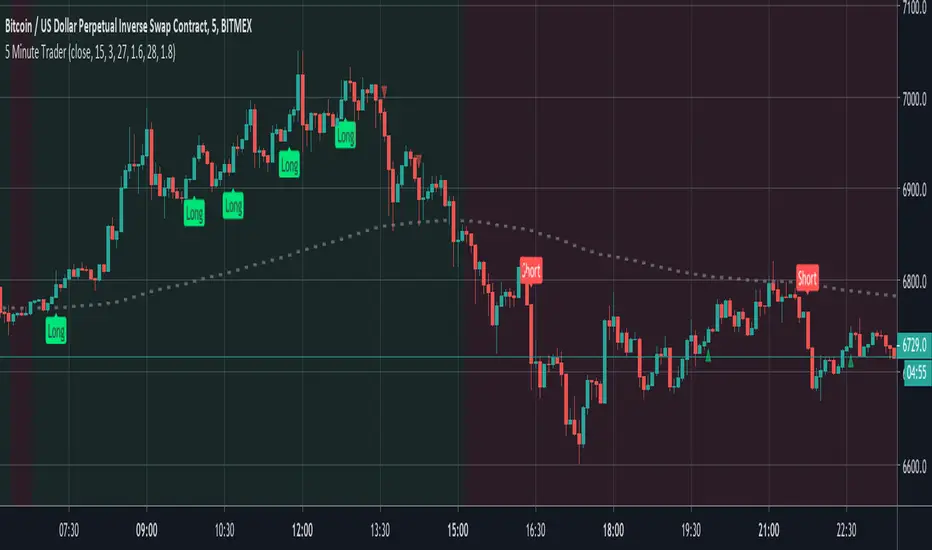
5 Minute TraderBy request, this is an amalgamation of my most popular indicator features but tailored for lower timeframes.
Signals are generated by simple EMA crosses (with adjustable values) in the direction of the current trend and then validated against a scoring system that's comprised of 20 other indicators. When the majority of them agree then the trade can be taken. The tolerance score that permits a trade can be adjusted within the indicator preference panel and the values can be printed above/below the candle to help you tune your entry points.
To further reassure you, the smoothed candle direction from the 4 hour chart is printed in the background to validate the trend direction and a floating trade helper panel translates the scores in to practical terms (buy, sell etc)
Alerts are built in.
Note: This is a premium script. Please DM me for access.
Scalping QuantitativeThis is a tool designed to help with mean reverting trades but at the same time provide trend to determine direction. Bar coloring is based on a logarithmic oscillator with red meaning overbought and green meaning oversold.
By giving trend, it can help decide if a trade should be taken. This tool isn't designed for highly volatile markets.

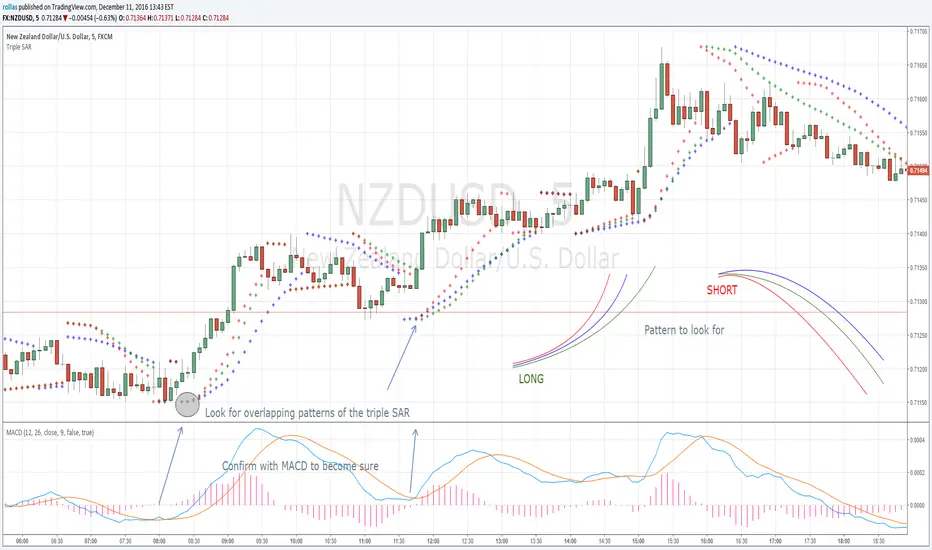
Triple SAR Scalping 5MTriple SAR scalping method must be used with a 5 minute chart. Look for the patterns that 3 bands overlap. Close deal within 4-5 pip profit or build your own style after getting comfortable with this technique and share your approach with us for maybe higher profits.