Sessions[Lenny Kiruthu]The script below is designed to show up to 4 different trading sessions i.e. London, New York, Tokyo and Sydney sessions, it also displays the days each session is taking place in as well as two horizontal lines one for the previous days high and the other for the previous days low.
It also displays a table that shows the user the highest and lowest price for 4 different currency pairs the previous day as well as their current prices and below it a confirmation row that shows whether price is currently above, below or within yesterdays range. Note that it only states "High Broken" or "Low Broken" if the current close is above or below the lines.
What you can change
Your time zone for example GMT -4 or GMT +3
The session start and end time
The colors, border type and border width of the session ranges
Displaying the table
Ability to choose the 4 symbols to view on the table
London

Sessions - AlgoLabA script in UTC for London, New York, Tokyo, & Sydney sessions.
Recommended on any timeframe < 1H.
---
Using this script, a box is plotted on the opening candle of each session; this can show us valuable areas on each chart where price may mediate to show a standing move.
You may also select each of the session boxes, in the settings; this will show you a box of the opening, low, high, and close of each selected sessions.
Each and all boxes are closed at the end of each session.
-The script produces a time table that will show you when each session occurs, and if the current time is within one of those sessions.
---
On this chart you can see boxes formed on the opening candles of the sessions,
London is red, New York is blue, Sydney is green, Tokyo is yellow.
-A key point to notice, before using this script, is how price may mediate around each box, before causing a move.
-Some boxes may be larger / smaller than others, due to the size of the opening candle.
---
Lots of updates to come, any recommendations? Feel free to leave a comment.
Hope it helps, enjoy!

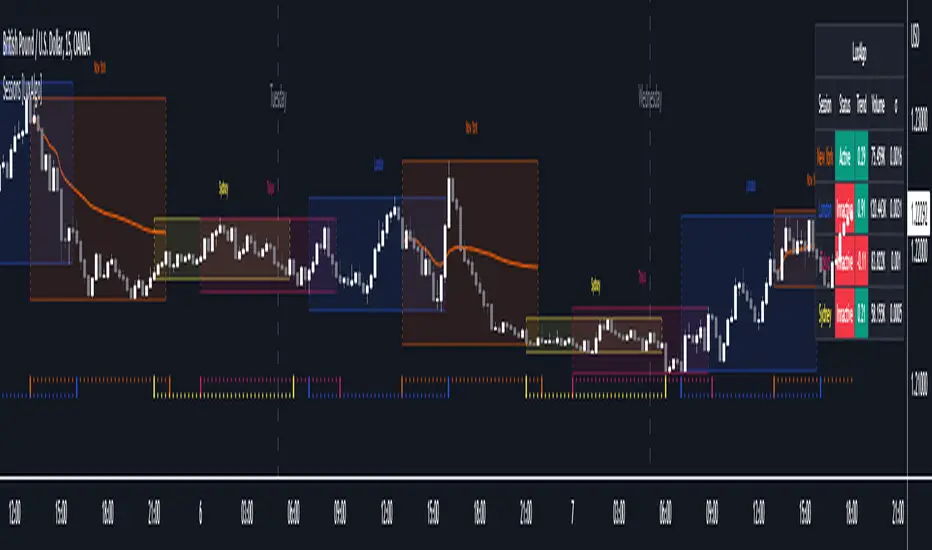
Sessions [LuxAlgo]This indicator shows when user set sessions are active and returns various tools + metrics using the closing price within active sessions as an input. Users have the option to change up to 4 session times.
The indicator will increasingly lack accuracy when the chart timeframe is higher than 1 hour.
Settings
Sessions
Enable Session: Allows to enable or disable all associated elements with a specific user set session.
Session Time: Opening and closing times of the user set session in the hh:mm format.
Range: Highlights the associated session range on the chart.
Trendline: Returns the associated session trendline on the chart.
Mean: Returns the associated session mean average on the chart.
VWAP: Returns the associated session volume weighted average price on the chart.
Ranges Settings
Range Area Transparency: Transparency of the area highlighting sessions ranges.
Range Outline: Highlights the borders of the session range area.
Range Label: Shows the session label at the mid-point of the session interval.
Dashboard
Show Dashboard: Enables sessions dashboard on the chart.
Advanced Dashboard: Returns more information regarding user set sessions on the dashboard.
Dividers
Show Session Divider: Highlights active sessions using intervals on the bottom of the chart (this can lead to less responsive charts)
Show Daily Divider: Highlights days on the chart.
Usage
This tool is versatile and allows the user to perform a wide variety of tasks all focusing on highlighting and analyzing price movements within a specific user set session in a periodic fashion.
Significant forex trading sessions are used by default, but the users are free to choose the opening and closing time of their choices.
Using ranges can indicate which sessions returned the most volatile price movements.
Trendlines can be useful to estimate the underlying trend of a specific session, but they can also offer a quick way to see which session started a trend reversal.
The session Mean highlights the equilibrium level within a session, extrapolating these levels can provide potential support and resistances levels of interest.
Finally, users can use the sessions VWAP's for real time applications, using them as trailing supports and resistances.
Using The Advanced Dashboard
The advanced dashboard returns useful information regarding the user set sessions. Each dashboard elements are described below:
Status: Highlights whether the user set session is active (open) of inactive (closed).
Trend: Shows correlation coefficient between the session prices and a linear sequence of values. Values above 0 indicates an up-trending session, while values under 0 indicates a down-trending session. Values closer to (1, -1) indicates a more trending session.
Volume: Shows accumulated volume within the session
σ (Standard Deviation): Shows standard deviation of the session, while this value is not bounded it can be useful to compare it with the other ones to see which session was the most volatile.
Note that when a session becomes inactive the value on the dashboard will hold until the specific session becomes active again.
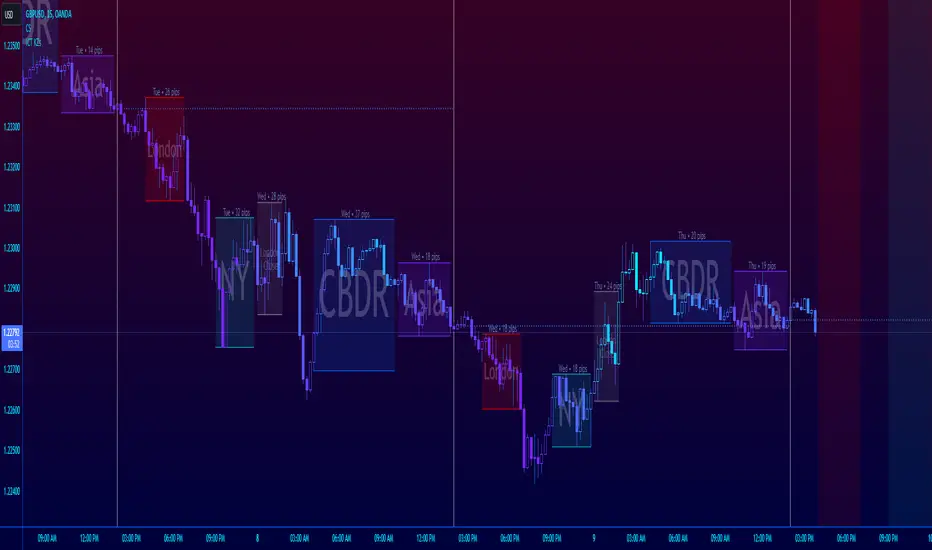
ICT Session Killzone Boxes & DeviationsICT Killzone Sessions Boxes & Deviations is a convenience indicator that marks out past and future ICT killzones for Asia, London, and New York, London Close and CBDR.
The boxes highlights the highest and lowest candle opens of that session/killzone, which is what the deviations are based on. Two lines mark out the highest high and lowest low of that session.
This indicator also includes New York midnight opening price and a vertical divider showing you that time.
Future killzones are also marked out.
All times are set to GMT-4 so these boxes should work across most exchanges. Times and code can be changed if a few don't match up.
Included are week of day labels for your convenience.
For those who are unfamiliar, ICT Killzones are optimal times to look for trades during or before a session, often providing entry for trades with orderblock tests, FVG fills or stophunts.
Please note: This indicator only works well on 1HR timeframe and below. The default max timeframe setting is set to 15min, which can be changed in the menu.
There may be some bugs so please highlight anything you find in the comments below :)
Shout out to @Ryazn for all the ideas!
All Forex Sessions in One Script OnlyDraws all Forex Sessions:
*it works only with forex*
These Sessions can show Daily Highs and Lows:
- Pre-London / London
- Pre-New York / New York
It's possible to hide Highs and Lows having full background for these sessions
Daily Session Breaks
- Mondays use a different color
- Asian Boxes every day
- All Sessions Ranges/Colors are editable
-All elements (pre-London/London/Pre-New York/New York/Asian Boxes/Session Breaks) can be switched off independently

AltSessionHello World
It’s no secret that trading sessions play a massive role in market movement and liquidity. We can clearly see in the image about how important identifying international trading hours are for a trader.
The Asian session starts around 1am GMT and often has a bearish bias through this session lasting for a few hours, after which Frankfurt and London traders start to come online and can often reverse the Asian sentiment.
The London session is the best session to trade traditionally starting around 7am GMT before the American traders come online and reverse market once again.
We have designed this indicator to help identify different trading hours easily with a background shade on the chart and also high/lows of the training session, as these levels can often be revisited.
We hope you find this indicator useful and please feel free to drop a comment if you have any updates you wish to be made or any future indicator script ideas, thank you.

[astropark] Kill ZonesDear Followers,
today I'm glad to present you an indicator which highlights for you the most important market Kill Zones .
This indicator will color background of the time sessions when Asia, London and New York sessions are going to be most active .
This way you can understand easier what istitutions and big hedge funds made during the session.
You can change colors and transparency in the indicator options, default colors are yellow for Asia, blue for London and red for New York sessions.
You can enable the indicator to show background also during the weekend (disabled by default).
This indicator works on all markets, I suggest not to use it above 1h timeframe, 5m-15m is great.
This is a premium indicator , so send me a private message in order to get access to this script.

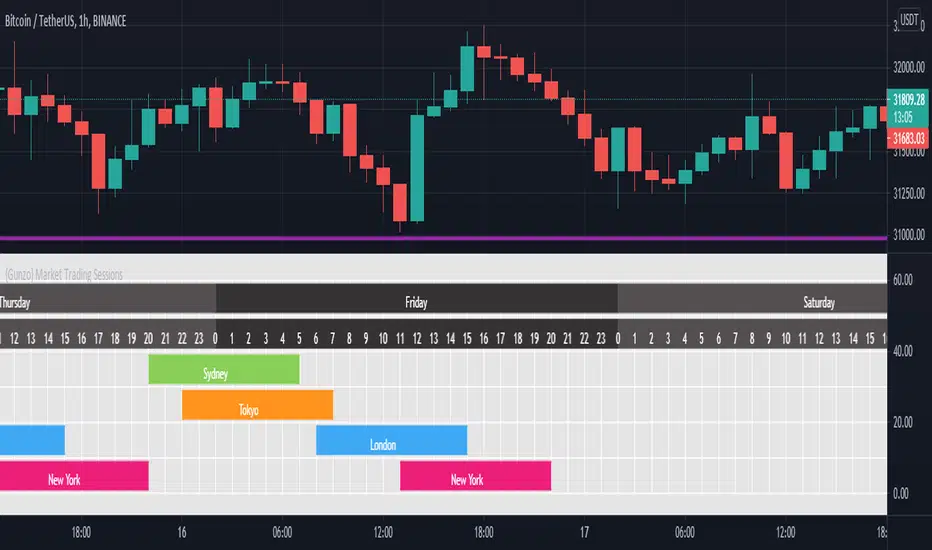
{Gunzo} Market Trading Sessions (Tokyo, London, New York)Market Trading Sessions is a tool designed to help traders to find the best times of the day for price action trading. It displays non-overlapping visuals for the major trading sessions : Oceania, Asia, Europe, and USA.
OVERVIEW :
This tool has been designed to match all the following requirements that I needed for optimal usage :
Display opening and closing of main markets
See clearly market sessions (non-overlapping colors)
Display Sydney session if wanted
Display GMT hours and days
Visually pleasing design and colors
Highly configurable
As I had trouble finding a script matching all these criteria, I created this tool and I'm sharing it with the TradingView community, hoping you will find it useful too.
SETTINGS :
Display market sessions on weekends : Display theoretical market sessions times on the weekend which can be useful for non forex markets.
Display session for Oceania\Sydney : Display "Oceania\Sydney" trading session
Display session for Asia\Tokyo : Display "Asia\Tokyo" trading session
Display session for Europe\London : Display "Europe\London" trading session
Display session for USA\New York : Display "USA\New York" trading session
Display session names : Display names of the session on the visual
Oceania color : Configurable color for the "Oceania\Sydney" sessions
Asia color : Configurable color for the "Asia\Tokyo" sessions
Europe color : Configurable color for the "Europe\London" sessions
USA color : Configurable color for the "USA\New York" sessions
Background color : Configurable color for the table background
Border color : Configurable color for the table borders
Text color : Configurable color for the table text
Header color : Configurable color for the table header (even days)
Header color (alternate) : Configurable color for the table header (odd days)
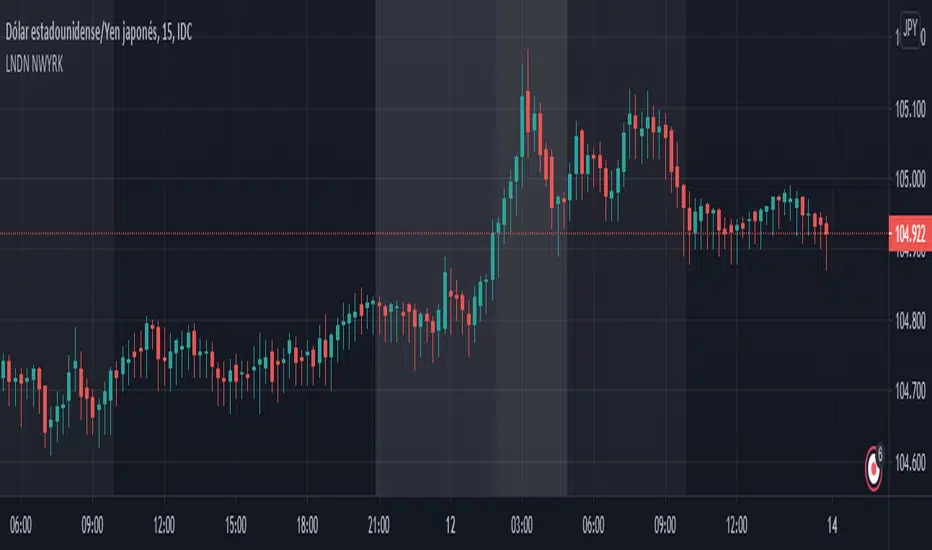
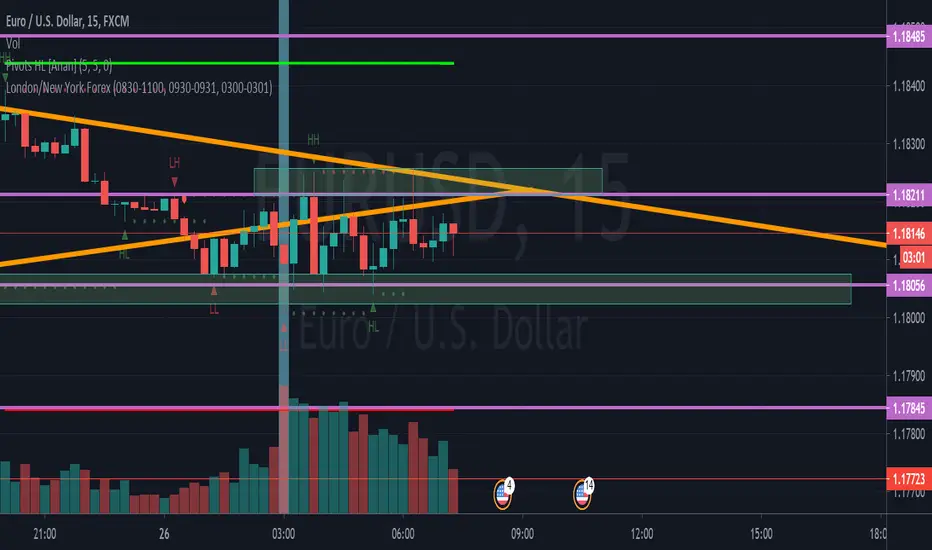
LONDON NEWYORK SESION BY dobleRBackground colors that show open-close of London and New York market sessions
Written for CDMX, MEXICO (UTC-6).
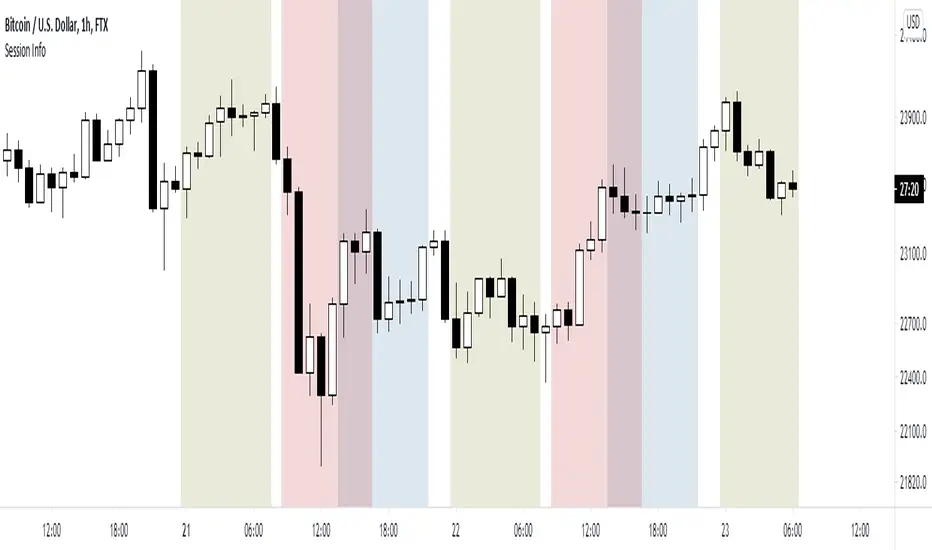
World market Session Information for bitcoinIt marks out different world markets active timings on the bitcoin charts.
You can also modify the script to a strategy and test out different strategies.
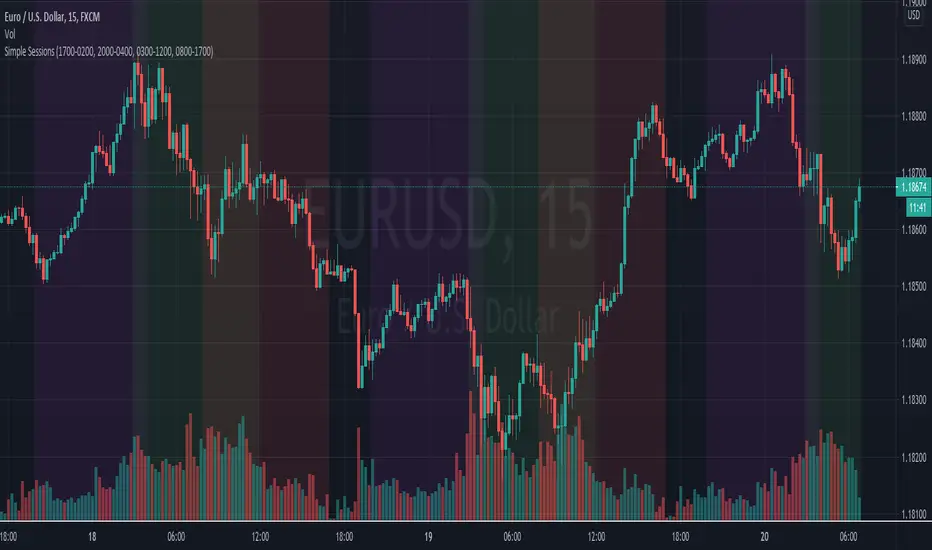
Simple Sessions## Background ##
Simple Sessions is based on the very awesome "Sessions on Chart" by Aurocks_AIF.
I really liked how the background colours worked but wanted to simplify it by removing some parts that I didn't use. I then simplified much of the code, put it into my standard template format and re-published. Hopefully the code is a bit cleaner and easier to read now.
## Usage ##
The default indicator shows the following sessions:
* Sydney in Navy
* Tokyo in Purple
* London in Green
* New York in Red
The good news is that using Green and Red for London and New York, gives a nice distinct yellow for the overlapping sessions. Sydney and Tokyo are by in similar colors by design.
By default, only London and New York show, but you may turn on Sydney and Tokyo in the settings.
## Use, Share, Like, etc #
Have fun!
-- chilts
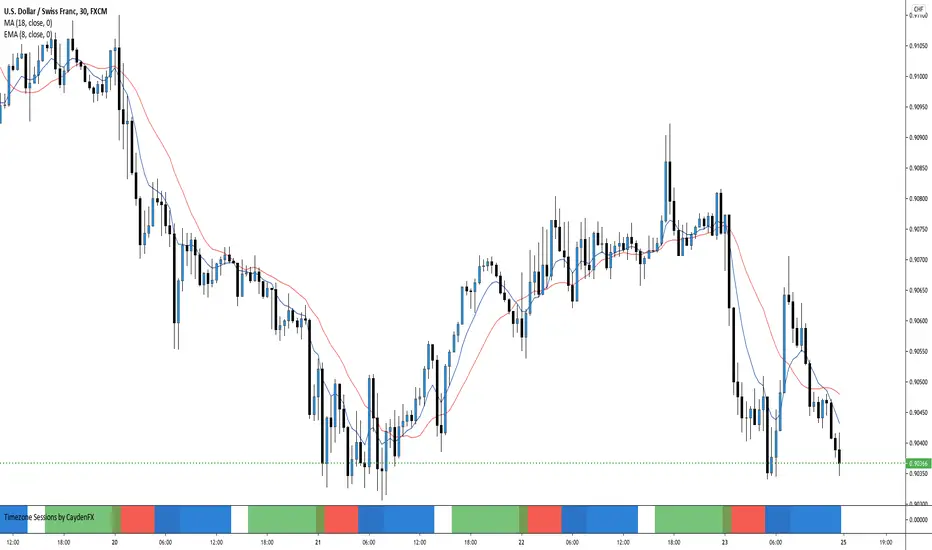
Timezone Sessions by CaydenFXThis indicator is used to tell when each market is in session. This is based on the Los Angeles time frame. You can customize the colors and opacity of each session. The sessions include London, New York, Sydney, and Tokyo. I only have three sessions being displayed in the picture.
London&NY Sessions with DaysOnly has certain time frames for New York and London which can be changed. Does not included other sessions. Also has options to include the market open.

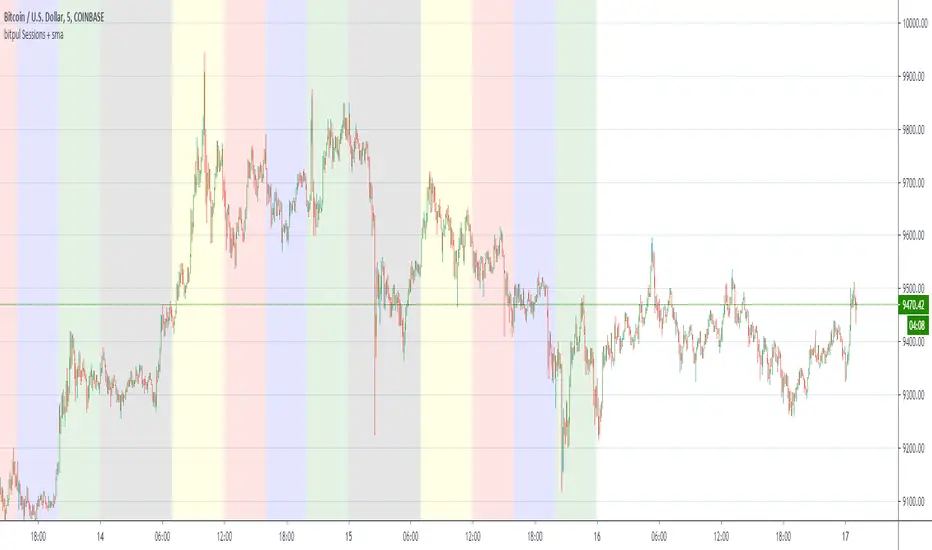
bitpul Sessions + sma [MHMK]Background colors that show open-close of the major market sessions ( Tokyo, London, joint time, New York, free time).
I added two sma to get more confirmation for the reversal - You can hide smas
Codex NY|LDN SessionsPRIVATE SCRIPT published strictly for use/testing by close acquaintances for the Bitcoin and cryptocurrency markets.
Study shows London and New York trading sessions to help provide a closer look at how traditional hours/futures can/do effect the market.

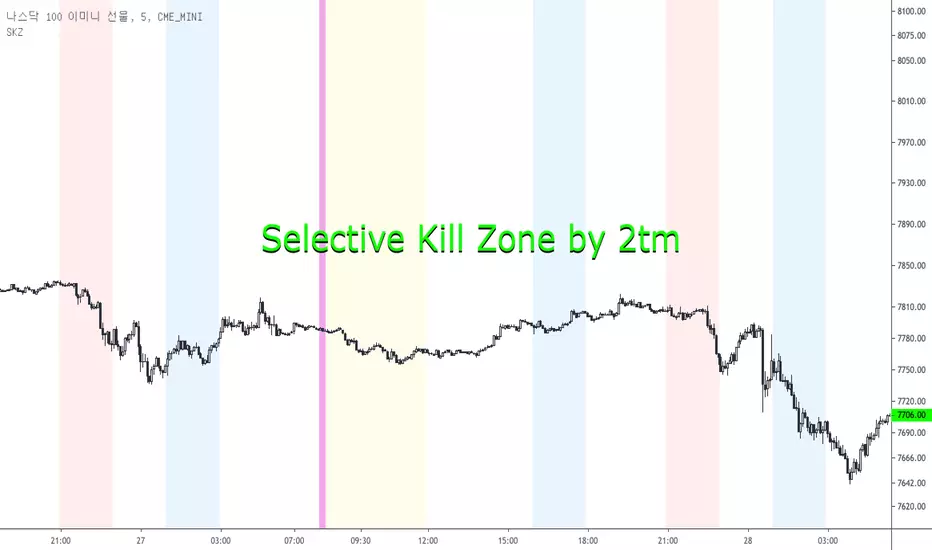
Selective Kill Zones by 2tm1. I think if you know how to use Kill Zone the this is very helpful to you but the Newbies must find out how to use the Kill Zone.
2. I've colored each Time Zone based on Olympic Flag, So the Yellow is Asia KZ, the blue is Europe I mean London and the Red is America for New York KZ.
3. There are Session Opens / Closes and Market Sessions in each Time Zone.
4. If you need adjust for Summer Time, then just click check box.
5. There are some options for the Period, that is a day, 3 days, a week, a month and a year.
6. It shows on weekends, so you can use on the crypto markets also.
7. Thanks and I hope your successful investment.
London_NYThis is a session indicator that is one color from beginning of London Session to end of New York Session.


Trading Sessions v.2 - Max WarrenUpdated to work with Pine updates:
London DST timezone still broken. Will fix later.
As always full customization visually, with London fix I'll add more options.
Keep in mind the render resolution option
