itradesize /\ Previous Liquidity x ICTI’d like to introduce a clean and simple RTH gap and liquidity levels indicator with additional Asian and London ranges, along with standard deviation levels and many customizable options.
Previous D/W/M highs and lows are areas where liquidity tends to accumulate. This is because many traders place stop-loss orders around these levels, creating a concentration of buy stops above the previous day's high and sell stops below the previous day's low. High-frequency trading algorithms and institutional traders often target these areas to capture liquidity.
What the indicator could show in summary?
- Regular trading hours gap with deviations
- Asia with deviations (lines or boxes)
- London with deviations (lines or boxes)
- Weekdays on chart
- 3 AM candle marker
- Previous D/W/M levels
- Important opening times (08:00, 09:30, 10:00, 14:00, 00:00, 18:00)
- Daily separators
By marking out the previous day's highs and lows, traders can create a framework for their trading day. This helps in identifying potential setups and understanding where significant price action might occur. It also aids in filtering out noise and focusing on the most relevant price levels.
These levels can also act as potential reversal points. When the market reaches a previous high or low, it might reverse direction, especially if it has raided the liquidity resting there. This concept is part of a strategy where traders look for the market to raid these levels and then reverse, providing trading opportunities
The indicator shows previous liquidity levels on a daily, weekly, and monthly basis. It also displays opening times at 8:30, 9:30-10:00, 14:00-00:00, and 18:00. Opening times are crucial in trading because they help define specific periods when market activity is expected to be higher, which can lead to better trading opportunities. The script has been made mostly for indices.
You can create various entry and exit strategies based on the indicator. Please remember, that adequate knowledge of ICT is necessary for this to be beneficial.
You might wonder why only these times are shown. This is because these are the times when the futures market is active or should be active. It's important to note that opening times can vary between different asset classes.
18:00 A new daily candle open
00:00 Midnight open
02:00 New 4-hour candle open
08:30 High-impact news
09:30 NY Equities open
10:00 New 4-hour candle open
The concept of "Asian Killzone Standard Deviations" involves using the Asian trading session's price range to project potential price movements during subsequent trading sessions, such as the London or New York sessions. This is done by calculating standard deviations from the Asian range, which can help traders identify potential support and resistance levels.
You can create a complete model by exclusively focusing on the Asian time zone. Deviations within this zone may have varying impacts on future price movements, and the Interbank Price Delivery Agreement (IPDA) often reflects Asia's high, close, and low prices.
A similar approach can be taken with the London time zone. The standard deviation levels within each zone could potentially serve as support or indicate reversals, including liquidity hunts. It's important to backtest these ideas to gain reliable insights into when and where to apply them.
* Asian Range: This is the price range established during the Asian trading session. It serves as a reference point for calculating standard deviations.
* London Range: The same applies to the London range as well. Combine standard deviation projections with other technical analysis tools, such as order blocks or fair value gaps, to enhance accuracy.
* Standard Deviations: These are statistical measures that indicate the amount of variation or dispersion from the average. In trading, they are used to project potential price levels beyond the current range.
You can also use regular trading hours gap as a standalone model. The 4 STDV and 2.5 STDV levels are important for determining the high or low of the current price action.
The RTH gap is created when there is a difference between the closing price of a market at the end of one trading day and the opening price at the start of the next trading day. This gap can be upward (gap higher), downward (gap lower), or unchanged. It is significant because it often indicates market sentiment and can create inefficiencies that traders look to exploit.
Alternatively, you can combine these elements to create a complete strategy for different scenarios.
Liquidity
Pure Price Action ICT Tools [LuxAlgo]The Pure Price Action ICT Tools indicator is designed for pure price action analysis, automatically identifying real-time market structures, liquidity levels, order & breaker blocks, and liquidity voids.
Its unique feature lies in its exclusive reliance on price patterns, without being constrained by any user-defined inputs, ensuring a robust and objective analysis of market dynamics.
🔶 MARKET STRUCTURES
A Market Structure Shift, also known as a Change of Character (CHoCH), is a pivotal event in price action analysis indicating a potential change in market sentiment or direction. An MSS occurs when the price reverses from an established trend, signaling that the prevailing trend may be losing momentum and a reversal might be underway. This shift is often identified by key technical patterns, such as a higher low in a downtrend or a lower high in an uptrend, which indicate a weakening of the current trend's strength.
A Break of Structure typically indicates the continuation of the current market trend. This event occurs when the price decisively moves beyond a previous swing high or low, confirming the strength of the prevailing trend. In an uptrend, a BOS is marked by the price breaking above a previous high, while in a downtrend, it is identified by the price breaking below a previous low.
While a Market Structure Shift (MSS) can indicate a potential trend reversal and a Break of Structure (BOS) often confirms trend continuation, they do not assure a complete reversal or continuation. MSS and BOS levels can also function as liquidity zones or areas of price consolidation rather than definitively signaling a change in market direction. Traders should approach these signals cautiously and validate them with additional factors before making trading decisions. For further details on other components of the tool, please refer to the following sections.
🔶 ORDER & BREAKER BLOCKS
Order and Breaker Blocks are key concepts in price action analysis that help traders identify significant levels in the market structure.
Order Blocks are specific price zones where significant buying or selling activity has occurred. These zones often represent the actions of large institutional traders or market makers, who execute substantial orders that impact the market.
Breaker Blocks are specific price zones where a strong reversal occurs, causing a break in the prevailing market structure. These blocks indicate areas where the price encountered significant resistance or support, leading to a reversal.
In summary, Order and Breaker Blocks are essential tools in price action analysis, providing insights into significant market levels influenced by institutional trading activities. These blocks help traders make informed decisions about potential support and resistance levels, trend reversals, and breakout confirmations.
🔶 BUYSIDE & SELLSIDE LIQUIDITY
Both buy-side and sell-side liquidity zones are critical for identifying potential turning points in the market. These zones are where significant buying or selling interest is concentrated, influencing future price movements.
In summary, buy-side and sell-side liquidity provide crucial insights into market demand and supply dynamics, helping traders make informed decisions based on the availability of orders at different price levels.
🔶 LIQUIDITY VOIDS
Liquidity voids are gaps or areas on a price chart where there is a lack of trading activity. These voids represent zones with minimal to no buy or sell orders, often resulting in sharp price movements when the market enters these areas.
In summary, liquidity voids are crucial areas on a price chart characterized by a lack of trading activity. These voids can lead to rapid price movements and increased volatility, making them essential considerations for traders in their analysis and decision-making processes.
🔶 SWING POINTS
Reversal price points are commonly referred to as swing points. Traders often analyze historical swing points to discern market trends and pinpoint potential trade entry and exit points.
Do note that in this script these are subject to backpainting, that is they are not located where they are detected.
The detection of swing points and the unique feature of this script rely exclusively on price action, eliminating the need for numerical user-defined settings. The process begins with detecting short-term swing points:
Short-Term Swing High (STH): Identified as a price peak surrounded by lower highs on both sides.
Short-Term Swing Low (STL): Recognized as a price trough surrounded by higher lows on both sides.
Intermediate-term and long-term swing points are detected using the same approach but with a slight modification. Instead of directly analyzing price candles, previously detected short-term swing points are utilized. For intermediate-term swing points, short-term swing points are analyzed, while for long-term swing points, intermediate-term ones are used.
This method ensures a robust and objective analysis of market dynamics, offering traders reliable insights into market structures. Detected swing points serve as the foundation for identifying market structures, buy-side/sell-side liquidity levels, and order and breaker blocks presented with this tool.
In summary, swing points are essential elements in technical analysis, helping traders identify trends, support, and resistance levels, and optimal entry and exit points. Understanding swing points allows traders to make informed decisions based on the natural price movements in the market.
🔶 SETTINGS
🔹 Market Structures
Market Structures: Toggles the visibility of the market structures, both shifts and breaks.
Detection: An option that allows users to detect market structures based on the significance of swing levels, including short-term, intermediate-term, and long-term.
Market Structure Labels: Controls the visibility of labels that highlight the type of market structure.
Line Style: Customizes the style of the lines representing the market structure.
🔹 Order & Breaker Blocks
Order & Breaker Blocks: Toggles the visibility of the order & breaker blocks.
Detection: An option that allows users to detect order & breaker blocks based on the significance of swing levels, including short-term, intermediate-term, and long-term.
Last Bullish Blocks: Number of the most recent bullish order/breaker blocks to display on the chart.
Last Bearish Blocks: Number of the most recent bearish order/breaker blocks to display on the chart.
Use Candle Body: Allows users to use candle bodies as order block areas instead of the full candle range.
🔹 Buyside & Sellside Liquidity
Buyside & Sellside Liquidity: Toggles the visibility of the buyside & sellside liquidity levels.
Detection: An option that allows users to detect buy-side & sell-side liquidity based on the significance of swing levels, including short-term, intermediate-term, and long-term.
Margin: Sets margin/sensitivity for a liquidity level detection.
Visible Levels: Controls the amount of the liquidity levels/zones to be visualized.
🔹 Liquidity Voids
Liquidity Voids: Enable display of both bullish and bearish liquidity voids.
Threshold Multiplier: Defines the multiplier for the threshold, which is hard-coded to the 200-period ATR range.
Mode: Controls the lookback length for detection and visualization. Present considers the last X bars specified in the option, while Historical includes all available data.
Label: Enable display of a label indicating liquidity voids.
🔹 Swing Highs/Lows
Swing Highs/Lows: Toggles the visibility of the swing levels.
Detection: An option that allows users to detect swing levels based on the significance of swing levels, including short-term, intermediate-term, and long-term.
Label Size: Control the size of swing level labels.
🔶 RELATED SCRIPTS
Pure-Price-Action-Structures.
Market-Structures-(Intrabar).
Buyside-Sellside-Liquidity.
Order-Breaker-Blocks.

Liquidity strategy tester [Influxum]This tool is based on the concept of liquidity. It includes 10 methods for identifying liquidity in the market. Although this tool is presented as a strategy, we see it more as a data-gathering instrument.
Warning: This indicator/strategy is not intended to generate profitable strategies. It is designed to identify potential market advantages and help with identifying effective entry points to capitalize on those advantages.
Once again, we have advanced the methods of effectively searching for liquidity in the market. With strategies, defined by various entry methods and risk management, you can find your edge in the market. This tool is backed by thorough testing and development, and we plan to continue improving it.
In its current form, it can also be used to test well-known ICT or Smart Money concepts. Using various methods, you can define market structure and identify areas where liquidity is located.
Fair Value Gaps - one of the entry signal options is fair value gaps, where an imbalance between buyers and sellers in the market can be expected.
Time and Price Theory - you can test this by setting liquidity from a specific session and testing entries as that liquidity is grabbed
Judas Swing - can be tested as a market reversal after a breakout during the first hours of trading.
Power of Three - accumulation can be observed as the market moving within a certain range, identified as cluster liquidity in our tool, manipulation occurs with the break of liquidity, and distribution is the direction of the entry.
🟪 Methods of Identifying Liquidity
Pivot Liquidity
This refers to liquidity formed by local extremes – the highest or lowest prices reached in the market over a certain period. The period is defined by a pivot number and determines how many candles before and after the high/low were higher/lower. Simply put, the pivot number represents the number of adjacent candles to the left and right, with a lower high for a pivot high and a higher low for a pivot low. The higher the number, the more significant the high/low is. Behind these local market extremes, we expect to find orders waiting for breakout as well as stop-losses.
Gann Swing
Similar to pivot liquidity, Gann swing identifies significant market points. However, instead of candle highs and lows, it focuses on the closing prices. A Gann swing is formed when a candle closes above (or below) several previous closes (the number is again defined by a strength parameter).
Percentage Change
Apart from ticks, percentages are also a key unit of market movement. In the search for liquidity, we monitor when a local high or low is formed. For liquidity defined by percentage change, a high must be a certain percentage higher than the last low to confirm a significant high. Similarly, a low must be a defined percentage away from the last significant high to confirm a new low. With the right percentage settings, you can eliminate market noise.
Session Range (3x)
Session range is a popular concept for finding liquidity, especially in smart money concepts (SMC). You can set up liquidity visualization for the Asian, London, or New York sessions – or even all three at once. This tool allows you to work with up to three sessions, so you can easily track how and if the market reacts to liquidity grabs during these sessions.
Tip for traders: If you want to see the reaction to liquidity grab during a specific session at a certain time (e.g., the well-known killzone), you can set the Trading session in this tool to the exact time where you want to look for potential entries.
Unfinished Auction
Based on order flow theory, an unfinished auction occurs when the market reverses sharply without filling all pending orders. In price action terms, this can be seen as two candles at a local high or low with very similar or identical highs/lows. The maximum difference between these values is defined as Tolerance, with the default setting being 3 ticks. This setting is particularly useful for filtering out noise during slower market periods, like the Asian session.
Double Tops and Bottoms
A very popular concept not only from smart money concepts but also among price pattern traders is the double bottom and double top. This occurs when the market stops and reverses at a certain price twice in a row. In the tool, you can set how many candles apart these bottoms/tops can be by adjusting the Length parameter. According to some theories, double bottoms are more effective when there is a significant peak between the two bottoms. You can set this in the tool as the Swing value, which defines how large the movement (expressed in ticks) must be between the two peaks/bottoms. The final parameter you can adjust is Tolerance, which defines the possible price difference between the two peaks/bottoms, also expressed in ticks.
Range or Cluster Liquidity
When the market stays within a certain price range, there’s a chance that breakout orders and stop-losses are accumulating outside of this range. Our tool defines ranges in two ways:
Candle balance calculates the average price within a candle (open, high, low, and close), and it defines consolidation when the centers of candles are within a certain distance from each other.
Overlap confirms consolidation when a candle overlaps with the previous one by a set percentage.
Daily, Weekly, and Monthly Highs or Lows
These options simply define liquidity as the previous day’s, week’s, or month’s highs or lows.
Visual Settings
You can easily adjust how liquidity is displayed on the chart, choosing line style, color, and thickness. To display only uncollected liquidity, select "Delete grabbed liquidity."
Liquidity Duration
This setting allows you to control how long liquidity areas remain valid. You can cancel liquidity at the end of the day, the second day, or after a specific number of candles.
🟪 Strategy
Now we come to the part of working with strategies.
Max # of bars after liquidity grab – This parameter allows you to define how many candles you can search for entry signals from the moment liquidity is grabbed. If you are using engulfing as an entry signal, which consists of 2 candles, keep in mind that this number must be at least 2. In general, if you want to test a quick and sharp reaction, set this number as low as possible. If you want to wait for a structural change after the liquidity grab, which may require more candles, set the number a bit higher.
🟪 Strategy - entries
In this section, we define the signals or situations where we can enter the market after liquidity has been taken out.
Liquidity grab - This setup triggers a trade immediately after liquidity is grabbed, meaning the trade opens as the next candle forms.
Close below, close above - This refers to situations where the price closes below liquidity, but then reverses and closes above liquidity again, suggesting the liquidity grab was a false breakout.
Over bar - This occurs when the entire candle (high and low) passes beyond the liquidity level but then experiences a pullback.
Engulfing - A popular price action pattern that is included in this tool.
2HL - weak, medium, strong - A variation of a popular candlestick pattern.
Strong bar - A strong reactionary candle that forms after a liquidity grab. If liquidity is grabbed at a low, this would be a strong long candle that closes near its high and is significantly larger compared to typical volatility.
Naked bar - A candlestick pattern we’ve tested that serves as a good confirmation of market movement.
FVG (Fair Value Gap) - A currently popular concept. This is the only signal with additional settings. “Pending FVG order valid” means if a fair value gap forms after a liquidity grab, a limit order is placed, which remains valid for a set number of candles. “FVG minimal tick size” allows you to filter based on the gap size, measured in ticks. “GAP entry model” lets you decide whether to place the limit order at the gap close or its edge.
🟪 Strategy - General
Long, short - You can choose whether to focus on long or short trades. It’s interesting to see how long and short trades yield different results across various markets.
Pyramiding - By default, the tool opens only one trade at a time. If a new signal arises while a trade is open, it won’t enter another position unless the pyramiding box is checked. You also need to set the maximum number of open trades in the Properties.
Position size - Simply set the size of the traded position.
🟪 Strategy - Time
In this section, you can set time parameters for the strategy being tested.
Test since year - As the name implies, you can limit the testing to start from a specific year.
Trading session - Define the trading session during which you want to test entries. You can also visualize the background (BG) for confirmation.
Exclude session - You can set a session period during which you prefer not to search for trades. For example, when the New York session opens, volatility can sharply increase, potentially reducing the long-term success rate of the tested setup.
🟪 Strategy - Exits
This section lets you define risk management rules.
PT & SL - Set the profit target (PT) and stop loss (SL) here.
Lowest/highest since grab - This option sets the stop loss at the lowest point after a liquidity grab at a low or at the highest point after a liquidity grab at a high. Since markets usually overshoot during liquidity grabs, it’s good practice to place the stop loss at the furthest point after the grab. You can also set your risk-reward ratio (RRR) here. A value of 1 sets an RRR of 1:1, 2 means 2:1, and so on.
Lowest/highest last # bars - Similar to the previous option, but instead of finding the extreme after a liquidity grab, it identifies the furthest point within the last number of candles. You can set how far back to look using the # bars field (for an engulfing pattern, 2 is optimal since it’s made of two candles, and the stop loss can be placed at the edge of the engulfing pattern). The RRR setting works the same way as in the previous option.
Other side liquidity grab - If this option is checked, the trade will exit when liquidity is grabbed on the opposite side (i.e., if you entered on a liquidity grab at a low, the trade will exit when liquidity is grabbed at a high).
Exit after # bars - A popular exit strategy where you close the position after a set number of candles.
Exit after # bars in profit - This option exits the trade once the position is profitable for a certain number of consecutive candles. For example, if set to 5, the position will close when 5 consecutive candles are profitable. You can also set a maximum number of candles (in the max field), ensuring the trade is closed after a certain time even if the profit condition hasn’t been met.
🟪 Alerts
Alerts are a key tool for traders to ensure they don’t miss trading opportunities. They also allow traders to manage their time effectively. Who would want to sit in front of the computer all day waiting for a trading opportunity when they could be attending to other matters? In our tool, you currently have two options for receiving alerts:
Liquidity grabs alert – if you enable this feature and set an alert, the alert will be triggered every time a candle on the current timeframe closes and intersects with the displayed liquidity line.
Entry signals alert – this feature triggers an alert when a signal for entry is generated based on the option you’ve selected in the Entry type. It’s an ideal way to be notified only when a trading opportunity appears according to your predefined rules.

[DarkTrader] Swing OrderflowSwing Orderflow is a indicator that helps traders detect key swing highs and lows in price action. It is designed to enhance your charting experience by highlighting important support and resistance levels while providing clear visual cues on market structure changes. By tracking swing pivots and price trends, this indicator enables traders to make more informed decisions regarding potential entry and exit points in the market.
This indicator is inspired by @Fractalyst Indicator :
The core functionality of the script revolves around detecting swing highs and lows based on a customizable swing period. It identifies these pivots by comparing price movements over a specific time window, marking the points where price either peaks or bottoms out. Swing highs are plotted as resistance levels when the price breaks above a certain threshold, while swing lows are plotted as support levels when price breaks below it. These key points are represented with dotted lines and labels on the chart for easy reference.
Indicator In Use :
Swing High Calculation
A swing high occurs when the high of a specific bar (or candle) is greater than the highs of the surrounding bars within a defined range (called the swing period).
Function used to find the highest price within a specified range : ta.highest(period)
If the current price is greater than the highest price of this period, it's marked as a potential swing high.
A swing high generally represents a resistance level, where the price has reached a peak before declining.
Swing Low Calculation
A swing low occurs when the low of a specific bar is lower than the lows of the surrounding bars within the swing period.
Function used to find the lowest price within a specified range : ta.lowest(period)
If the current price is lower than this lowest price, it's identified as a swing low.
Swing lows represent support levels, where the price reaches a bottom before bouncing back.
These points are plotted on the chart, and the script also tracks whether price breaks above the swing high or below the swing low to determine trends or possible reversals.
BSL (Buy Side Liquidity)
BSL represents the Buy Side Liquidity, where traders are expected to have their buy orders (usually stop-loss orders for short positions).
When the price reaches a swing high, traders who are short may have stop orders placed above this level. Once these levels are breached, the script identifies this as a liquidity area where stop orders get triggered, causing potential upward price movement.
The script marks the swing high with a "BSL" label and line to indicate this key resistance and liquidity zone.
SSL (Sell Side Liquidity)
SSL refers to the Sell Side Liquidity, where traders place sell orders (usually stop-loss orders for long positions).
Swing lows are important levels where traders holding long positions place their stop orders. When the price drops below a swing low, it triggers these sell orders, causing potential downward price movement.
The script marks the swing low with an "SSL" label and line, signaling this key support and liquidity zone.
In essence, BSL and SSL represent areas where liquidity is pooled, making them critical points in price action. These liquidity areas, when breached, often lead to aggressive price moves, allowing traders to anticipate trends.

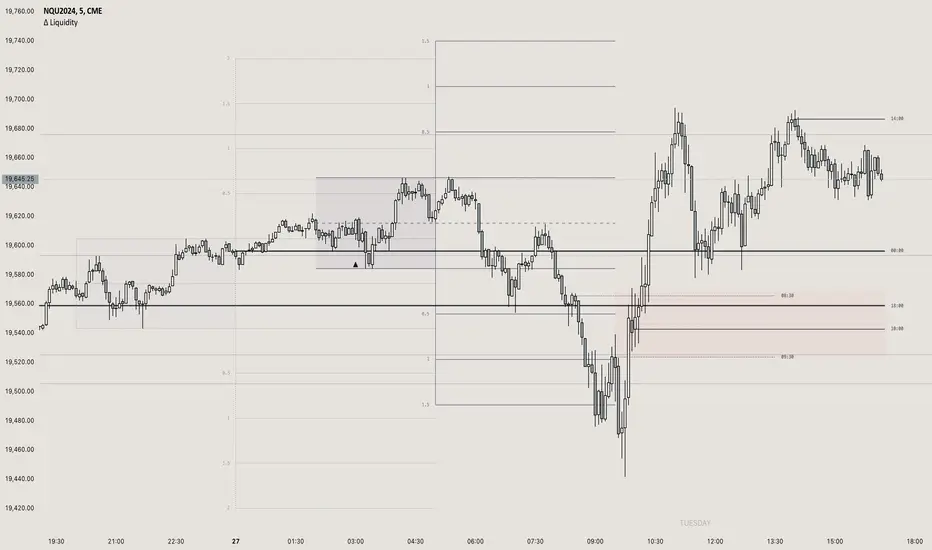
[DarkTrader] Liquidity Regression MapLinear Regression Function Reference by @RicardoSantos :
Liquidity Regression Map is an advanced indicator designed to assist traders in identifying key liquidity zones, reversals, and potential breakout areas within the market. By visualizing liquidity shifts and regression patterns, this tool provides a powerful visual guide to price movements that often go unnoticed by conventional indicators. The indicator's dynamic and adaptive approach helps traders better navigate complex market environments.
Purpose :
This indicator focuses on analyzing the behavior of liquidity in the market and mapping it out in a visual format on your TradingView charts. It provides a deeper understanding of where large clusters of liquidity exist, helping traders pinpoint potential areas where price is likely to react. It aims to highlight key liquidity zones and assess when price is likely to reverse or continue its trend, providing a comprehensive view of the market's internal structure.
Liquidity Regression Map supports multiple timeframes and multiple assets, providing traders with flexibility to analyze different market conditions. Whether you're analyzing short-term charts for scalping or higher timeframes for swing trades, the indicator adjusts its liquidity and regression calculations accordingly, ensuring accurate insights across all timeframes. Additionally, it is compatible with various asset classes, including stocks, forex, cryptocurrencies, and commodities, allowing you to apply the same powerful liquidity analysis across multiple markets for a unified trading strategy.
How It Works :
The indicator identifies liquidity zones by looking at the highs and lows of recent price action within a user-defined period, known as the lookback period. These zones represent areas where market participants are likely to have placed a significant number of stop orders or large positions, creating pockets of liquidity. The zones are visualized as levels on the chart, showing where the market is likely to react.
Next, the indicator performs a linear regression analysis on the price data. Linear regression helps smooth out the price action and gives an indication of the overall trend within the defined liquidity zone. This analysis is critical for determining the slope and direction of price movement, which provides insights into the market's momentum and strength in these liquidity areas.
A key feature of this indicator is its ability to detect liquidity swipes—sharp moves in price that sweep liquidity levels. When price approaches a liquidity zone and crosses it aggressively, the indicator highlights this as a swipe. Swipes often signal significant price reversals or trend continuation because they indicate that liquidity has been absorbed. The Akastra Liquidity Regression Map highlights these areas, helping traders anticipate where a reversal or continuation may occur.
As new price data comes in, the liquidity zones and regression lines dynamically adjust. This real-time update ensures that traders are always working with the most relevant and up-to-date liquidity information. The indicator recalculates the liquidity levels based on the recent highs and lows and repositions the regression lines accordingly. This makes it adaptive to both short-term volatility and long-term trends.
To make the analysis intuitive and easy to interpret, the liquidity levels are color-coded based on their strength and importance. Liquidity zones are shown using a gradient of colors, from weak liquidity (indicating potential minor reactions) to strong liquidity (where a significant price reaction is more likely). The heatmap visually communicates how liquidity is distributed across different levels and timeframes.
Liquidity Condition Filtering :
Another important aspect of the mechanism is the liquidity condition filtering, which only highlights significant liquidity shifts. The indicator evaluates if price movement meets certain thresholds, such as exceeding a 1.618 threshold for liquidity absorption or rejection . This filtering ensures that only the most relevant and impactful liquidity conditions are displayed, minimizing noise and false signals on the chart.
Finally, the indicator calculates and displays liquidity levels across multiple timeframes simultaneously, providing a more comprehensive view. For example, liquidity from a higher timeframe may interact with liquidity from a lower timeframe, providing traders with an overlapping view of where significant liquidity is concentrated. This multi-layer analysis helps to confirm trading setups and increases the probability of successful trades.

Matrix Glitch | FractalystThe Matrix Glitch indicator is a visually engaging tool for traders, inspired by the iconic Matrix movie effects. It overlays price charts with dynamic, multi-colored glitches that sync with market data, creating a striking, almost surreal visual experience.
The indicator uses characters from various languages (e.g., Japanese, Chinese, Russian, English) to mimic the digital rain effect from the movies. Users can select a language, which activates a corresponding array of characters. These characters are randomly picked from the chosen array and displayed on the chart.
Underlying Calculations and Logic
Arrays in the Indicator
1- Character Management:
The script uses arrays to store sets of characters representing different symbols or alphabets. These arrays allow the indicator to dynamically select and update characters for display. Each element in these arrays corresponds to a specific character that will be used to populate the grid.
2- Current and Previous States:
Arrays are employed to keep track of the current state of characters that are displayed on the grid. Simultaneously, another set of arrays records the previous state of these characters. This dual-state management allows the script to smoothly transition between updates, handling changes in characters and visual effects like fading.
3- Transparency Control:
Transparency levels for each character in the grid are managed through arrays. These arrays store the opacity values, ensuring that each character has the appropriate level of transparency. By comparing the current and previous transparency states, the script can create effects like gradual fading or intensifying visibility.
4- Rain Effect Simulation:
To create the "rain" effect, the script maintains arrays that simulate the falling text by continuously updating the position and visibility of characters. As new characters enter the top of the grid, older ones are removed from the bottom, with their transparency levels adjusted to simulate movement.
5- Operational Flow:
Initialization : Arrays are initialized to manage both the characters and their transparency. This setup allows the script to handle the dynamic display efficiently.
Updates : During each cycle, new characters are selected and old characters are shifted accordingly. The arrays ensure that both the content and appearance of the grid are updated seamlessly.
Rendering : The arrays dictate how characters and their transparency are rendered on the grid, ensuring a cohesive and visually appealing effect.
Here's how to use the indicator step-by-step:
1- Apply the Indicator to Your Charts:
Begin by adding the indicator to your chart. This will activate the visual effect on your selected trading instrument or time frame.
Select Your Preferred Language of the Matrix Characters:
In the settings, choose the language or symbol set you want the matrix characters to display. This could be anything from traditional matrix-style characters to different alphabets or custom symbols.
2- Choose the Matrix Effect (Rain, Burst):
Decide on the type of visual effect you prefer. You can select from options like the classic "rain" effect, where characters fall from the top of the screen, or a "burst" effect, where characters explode outward or appear in a different dynamic pattern.
3- Adjust the Color According to Your Preference:
Customize the color of the matrix characters to suit your aesthetic or chart theme. You can select from a range of colors or even set up a gradient for more complex visual effects.
4- Adjust the Width and Height of the Matrix According to Your Screen:
Fine-tune the dimensions of the matrix display. Set the width and height so that the matrix fits perfectly on your screen, ensuring that it aligns well with other chart elements and doesn't obstruct your view.
------
What Makes the Matrix Glitch Indicator Unique?
Language Selection:
Customizable Language: Unlike many indicators that might offer static or limited visual elements, the Matrix Glitch Indicator allows users to choose from a variety of languages for the characters displayed. This feature not only personalizes the user experience but also adds a cultural or linguistic element to trading charts. Users can select languages like Japanese, Chinese, Russian, or English, and many more.
This flexibility ensures that traders from different backgrounds can feel a connection with their charts through familiar or exotic scripts.
Dynamic Effects:
Effect Modes: The indicator offers two distinct modes - Rain Mode and Burst Mode. In Rain Mode, characters fall from the top of the chart, mimicking the iconic digital rain from the Matrix films.
In Burst Mode, characters radiate outward from a central point, creating a unique visual effect that can be synchronized with market volatility.
This dual-mode functionality allows traders to choose how they want their data to be visually represented, providing both aesthetic variety and potentially different insights into market behavior.
Color Customization:
Full Color Control: The ability to fully customize the color of the characters is a standout feature. Traders can match the indicator's colors to their trading platform's theme, their mood, or even specific market conditions (e.g., red for downturns, green for upturns). This level of customization not only aids in creating a personalized trading environment but can also serve as a visual cue for different market states.
Universal Display Compatibility:
Adjustability for All Displays: The indicator is designed to be fully adjustable for various screen resolutions and sizes. This ensures that whether you're trading on a high-resolution monitor, a laptop, or even a mobile device, the Matrix Glitch effect remains clear and impactful without compromising on the functionality of the trading chart. This adaptability is crucial in an era where trading can happen anywhere, making the indicator a versatile tool for traders on the go or in a static setup.
------
Terms and Conditions | Disclaimer
Our charting tools are provided for informational and educational purposes only and should not be construed as financial, investment, or trading advice. They are not intended to forecast market movements or offer specific recommendations. Users should understand that past performance does not guarantee future results and should not base financial decisions solely on historical data.
Built-in components, features, and functionalities of our charting tools are the intellectual property of @Fractalyst use, reproduction, or distribution of these proprietary elements is prohibited.
By continuing to use our charting tools, the user acknowledges and accepts the Terms and Conditions outlined in this legal disclaimer and agrees to respect our intellectual property rights and comply with all applicable laws and regulations.

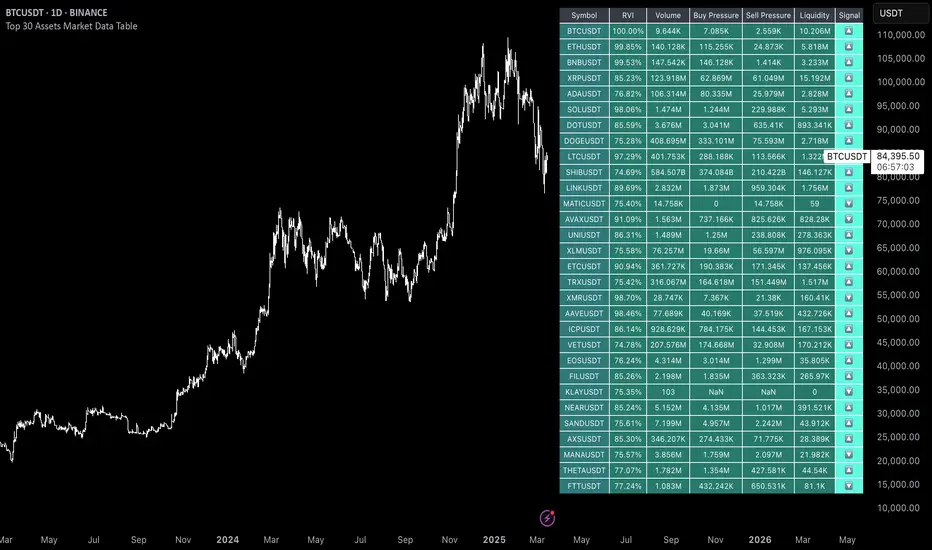
Screener | FractalystWhat’s the purpose of this indicator?
This indicator is part of the Optirange suite , which analyzes all timeframes using a mechanical top-down approach to determine the overall market bias. It helps you identify the specific timeframes and exact levels for positioning in longs, shorts, or guiding you on whether to stay away from trading a particular market condition.
The purpose of the Screener indicator is to track the contextual bias of multiple markets simultaneously on the charts without the need to switch between pairs. This allows traders to monitor various assets in real-time, enhancing decision-making efficiency and identifying potential trading opportunities more effectively.
-----
How does this indicator identify the overall market bias?
This indicator employs a systematic top-down approach, analyzing market structure, fractal blocks, and their mitigations from the 12M timeframe down to the 1D timeframe to uncover the story behind the market. This method helps identify the overall market bias, whether it’s bullish, bearish, or in consolidating conditions.
Below is a flowchart that illustrates the calculation behind the market context identification, demonstrating the systematic approach:
-----
According to the above trade plan, why do we only look for mitigations within Fractal Blocks of X1/X2?
In this context, "X" stands for a break in the market's structure, and the numbers (1 and 2) indicate the sequence of these breaks within the same trend direction, either up or down.
We focus on mitigations within Fractal Blocks during the X1/X2 stages because these points mark the early phase (X1) and the continuation (X2) of a trend. By doing so, we align our trades with the market's main direction and avoid getting stopped out in the middle of trends.
-----
How does this indicator identify ranges in a mechanical way?
Since the indicator is part of the Optirange suite , it follows the exact rules that Optirange utilizes to identify breaks of market structures in a mechanical manner.
Let’s take a closer look at how the ranges are calculated:
1- First, we need to understand the importance of following a set of mechanical rules in identifying market structure:
The image above illustrates the difference between a subjective and a mechanical approach to analyzing market structure. The subjective method often leads to uncertainty, where traders might struggle to pinpoint exact breaks in structure, resulting in inconsistent decision-making. Questions like “Is this a break?” or “Maybe this one...?” reflect the ambiguity of manual interpretation, which can cause confusion and errors in trading.
On the other hand, the mechanical approach depicted on the right side of the image follows a clear, rule-based method to define breaks in market structure. This systematic approach eliminates guesswork by providing precise criteria for identifying structural changes, such as marking structural invalidation levels where market bias shifts from bullish to bearish or vice versa. The mechanical method not only offers consistency but also integrates statistical probabilities , enhancing the trader's ability to make data-driven decisions.
By adhering to these mechanical rules, the Screener indicator ensures that ranges are identified consistently, allowing traders to rely on objective analysis rather than subjective interpretation . This approach is crucial for accurately defining market structures and making informed trading decisions.
2- Now let's take a look at a practical example of how the indicator utilizes Pivot points with a period of 2 to identify ranges:
In this image, we see a Bearish Scenario on the left and a Bullish Scenario on the right. The indicator starts by identifying the first significant swing on the chart. It then validates this swing by checking if there is a preceding swing high (for a bearish scenario) or swing low (for a bullish scenario). Once validated, the indicator confirms a break of structure when price closes below or above these points, respectively.
For instance, in the Bearish Scenario:
The first significant swing is identified.
The script checks for a preceding swing high before confirming any structural break.
A candle closure below the swing low confirms the first bearish break of structure.
This results in a confirmed market bias towards bearishness, with structural liquidity levels indicated for potential price targets.
In the Bullish Scenario:
The process is mirrored, identifying the first swing low and validating it with a preceding swing low.
A closure above this swing confirms the bullish break of structure.
This leads to a market bias towards bullishness, with invalidation levels to watch if the trend shifts.
This practical example demonstrates how the indicator systematically identifies market ranges, ensuring that traders can make informed decisions based on clear, rule-based criteria.
-----
How does this indicator identify ranges in a mechanical way, What are the underlying calculations?
Fractal blocks refer to the most extreme swing candle within the latest break. They can serve as significant levels for price rejection and may guide movements toward the next break, often in confluence with topdown analysis for added confirmation.
-----
What are mitigations, What are the underlying calculations?
Mitigations refer to specific price action occurrences identified by the script:
1- When the price reaches the most recent fractal block and confirms a swing candle, the script automatically draws a line from the swing to the fractal block bar and labels it with a checkmark.
2- If the price wicks through the invalidation level and then retraces back to the fractal block while forming a swing candle, the script labels this as a double mitigation on the chart.
This level will serve as the next potential invalidation level if a break occurs in the same direction.
-----
What does the right table display?
The table located at the right of your chart displays five colored symbols that represent the contextual market bias:
Green: The market is in a bullish condition.
Red: The market is in a bearish condition.
White: The market condition is uncertain, and it is advisable to stay away from trading.
-----
What does the bottom table display?
The bottom table can be turned on in the Optirange indicator and serves multiple purposes:
Range Counts and Mitigations: It shows the range counts and their mitigations across multiple timeframes, providing a comprehensive view of market dynamics.
Hourly Timeframe Probabilities: The bottom row of the bias table displays the probabilities for various hourly timeframes, helping to identify potential entry levels based on the multi-timeframe bias determined by the Screener.
In a bullish market context, you should look for long positions by focusing on hourly timeframes where buy-side probability exceeds 50%.
In a bearish market context, you should look for short positions by focusing on hourly timeframes where the sell-side probability exceeds 50%.
When the symbol is white within the Screener table, it signals that the market bias is unclear, and it's recommended to stay away from trading in such conditions.
-----
How the range probabilities are calculated?
Each break of market structure, denoted as X, is assigned a unique ID, starting from X1 for the first break, X2 for the second, and so on.
The probabilities are calculated based on breaks holding, meaning price closing through the liquidity level, rather than invalidation. This probability is then divided by the total count of similar numeric breaks.
For example, if 75 out of 100 bullish X1s become X2, then the probability of X1 becoming X2 on your charts will be displayed as 75% in the following format: ⬆ 75%
-----
What does the top table display?
The top table on the charts displays the current market context, offering insights into the underlying bias. It highlights the high-timeframe (HTF) bias and guides you on which timeframes you should use to enter long or short positions, based on the probability of success.
Additionally, when the market bias is unclear, the table clearly signals that it's best to avoid trading that specific market until the context or market story becomes clearer. This helps traders make informed decisions and avoid uncertain market conditions.
-----
How does the Screener indicator identify the market bias/context/story ?
- Market Structure: The Optirange indicator analyzes market structure across multiple timeframes, from a top-down perspective, including 12M, 6M, 3M, 1M, 2W, 1W, 3D, and 1D.
- Fractal Blocks: Once the market structure or current range is identified, the indicator automatically identifies the last push before the break and draws it as a box. These zones acts as a key area where the price often rejects from.
- Mitigations: After identifying the Fractal Block, the indicator checks for price mitigation or rejection within this zone. If mitigation occurs, meaning the price has reacted or rejected from the Fractal Block, the indicator draws a checkmark from the deepest candle within the Fractal Block to the initial candle that has created the zone.
- Bias Table: After identifying the three key elements—market structure, Fractal Blocks, and price mitigations—the indicator compiles this information into a multi-timeframe table. This table provides a comprehensive top-down perspective, showing what is happening from a structural standpoint across all timeframes. The Bias Table presents raw data, including identified Fractal Blocks and mitigations, to help traders understand the overall market trend. This data is crucial for the screener, which uses it to determine the current market bias based on a top-down analysis.
- Screener: Once all higher timeframes (HTF) and lower timeframes (LTF) are calculated using the indicator, it follows the exact rules outlined in the flowchart to determine the market bias. This systematic approach not only helps identify the current market trend but also suggests the exact timeframes to use for finding entry, particularly on hourly timeframes.
Example:
12M Timeframe:
OANDA:EURUSD
6M Timeframe :
OANDA:EURUSD
3M Timeframe :
OANDA:EURUSD
1M Timeframe :
OANDA:EURUSD
2W Timeframe :
OANDA:EURUSD
1W Timeframe :
OANDA:EURUSD
-----
User-input settings and customizations
Terms and Conditions | Disclaimer
Our charting tools are provided for informational and educational purposes only and should not be construed as financial, investment, or trading advice. They are not intended to forecast market movements or offer specific recommendations. Users should understand that past performance does not guarantee future results and should not base financial decisions solely on historical data. By utilizing our charting tools, the buyer acknowledges that neither the seller nor the creator assumes responsibility for decisions made using the information provided. The buyer assumes full responsibility and liability for any actions taken and their consequences, including potential financial losses. Therefore, by purchasing these charting tools, the customer acknowledges that neither the seller nor the creator is liable for any unfavorable outcomes resulting from the development, sale, or use of the products.
The buyer is responsible for canceling their subscription if they no longer wish to continue at the full retail price. Our policy does not include reimbursement, refunds, or chargebacks once the Terms and Conditions are accepted before purchase.
By continuing to use our charting tools, the user acknowledges and accepts the Terms and Conditions outlined in this legal disclaimer.
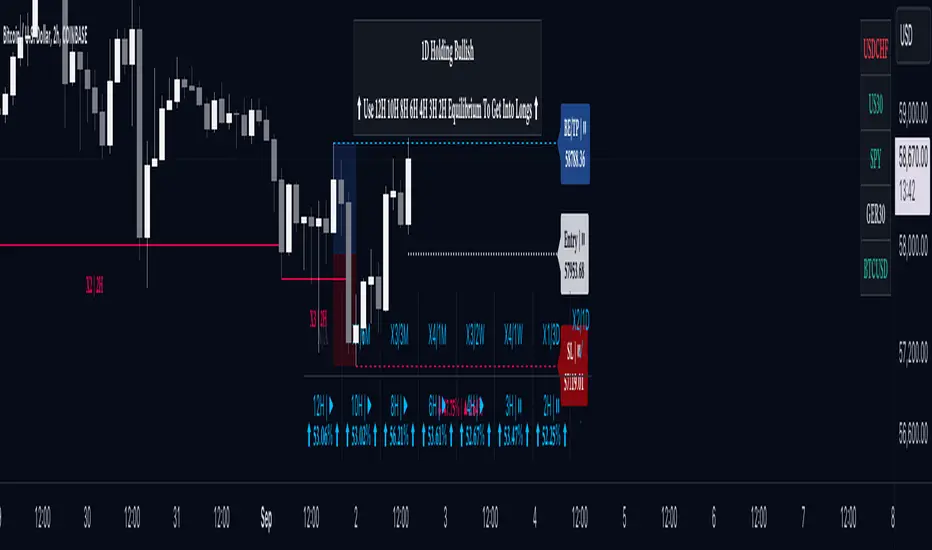
AutoPilot | FractalystWhat’s the purpose of this indicator?
The AutoPilot indicator automates the management of your active trades by:
Breaks Even: Moves the stop-loss to the entry price once the trade reaches a 1:1 risk-reward ratio.
Closes Trades: Automatically exits trades when trailing stop-losses are triggered.
This automation is facilitated through PineConnector and TradingView webhook integration, allowing traders to manage multiple positions across various markets effortlessly without any manual intervention.
----
How does this indicator trail stop-loss using market structure?
The AutoPilot indicator utilizes an advanced market structure trailing stop-loss mechanism to manage trades based on market dynamics and probabilities.
Here's how it works:
Market Structure Identification: The indicator first identifies key market structures such as higher highs, lower lows.
These structures are pivotal points where the market has shown a change in direction or momentum.
Probability-Based Trailing: Once a trade is active, the stop-loss isn't just set at a fixed distance or percentage but is dynamically adjusted based on the probability of the market structure holding or breaking.
This involves:
Trend Continuation Probability: If the market structure suggests a strong trend continuation (e.g., a series of higher highs in an uptrend), the stop-loss might trail closer to the price, but with a buffer calculated by the probability of the trend continuing versus reversing.
Reversal Probability: Conversely, if there's a high probability of a trend reversal based on recent market structures (like a significant lower high in an uptrend), the stop-loss might be adjusted to a point where the market structure would need to break to confirm the reversal, thus protecting potential profits or minimizing losses.
Dynamic Adjustment: The trailing stop-loss adjusts in real-time as new market structures form. For instance, if a new higher high is formed in an uptrend, the stop-loss might move up but not necessarily to the exact previous swing low. Instead, it's placed at a level where the probability of the next swing low not breaking this level is high, based on historical price action.
Risk Management: By using market structure and probabilities, the indicator aims to balance between giving the trade room to breathe (allowing for normal market fluctuations) and tightening the stop-loss when the market behavior suggests a potential trend change or continuation with high confidence.
This approach ensures that the stop-loss isn't just a static or simple trailing mechanism but a sophisticated tool that adapts to the evolving market conditions, aiming to maximize profit while minimizing the risk of being stopped out prematurely due to market noise.
----
How are the probabilities calculated? What are the underlying calculations?
The probability is designed to enhance trade management by using buyside liquidity and probability analysis to filter out low/high probability conditions.
This helps in identifying optimal trailing points where the likelihood of a price continuation is higher.
Calculations:
1. Understanding Swing highs and Swing Lows
Swing High: A Swing High is formed when there is a high with 2 lower highs to the left and right.
Swing Low: A Swing Low is formed when there is a low with 2 higher lows to the left and right.
2. Understanding the purpose and the underlying calculations behind Buyside, Sellside and Equilibrium levels.
3. Understanding probability calculations
1. Upon the formation of a new range, the script waits for the price to reach and tap into equilibrium or the 50% level. Status: "⏸" - Inactive
2. Once equilibrium is tapped into, the equilibrium status becomes activated and it waits for either liquidity side to be hit. Status: "▶" - Active
3. If the buyside liquidity is hit, the script adds to the count of successful buyside liquidity occurrences. Similarly, if the sellside is tapped, it records successful sellside liquidity occurrences.
5. Finally, the number of successful occurrences for each side is divided by the overall count individually to calculate the range probabilities.
Note: The calculations are performed independently for each directional range. A range is considered bearish if the previous breakout was through a sellside liquidity. Conversely, a range is considered bullish if the most recent breakout was through a buyside liquidity.
----
What does the automation table display?
The automation table in the AutoPilot indicator provides a summary of user-defined settings crucial for automated trade management through PineConnector and TradingView integration. It displays:
PineConnector License ID: This ensures that the indicator is linked to your specific PineConnector account, allowing for personalized and secure automation of your trades.
Order Type (Buy/Sell): Indicates whether the automation is set for buying or selling, which is essential for correctly executing your trading strategy.
Chosen Symbol: Specifies the trading pair or symbol in your broker's platform where the trade management commands (like closing orders) will be executed. This ensures that the automation targets the correct market or asset.
Risk Per Trade: Shows the percentage or amount of your capital you're willing to risk on each trade, helping you maintain consistent risk management across different trades.
Comment: A field for you to input notes or identifiers, particularly useful when trading across multiple markets or instruments. This helps in tracking and managing trades across different assets or strategies.
Comment: A field for you to input identifiers, particularly useful when trading across multiple timeframes or different enries.
Allowing users to manage specific comments for each previously taken entry, facilitating precise management of multiple trades with unique identifiers.
This table serves as a quick reference for your current settings, ensuring you're always aware of how your trades are being managed automatically before any adjustments are made or alerts are triggered.
----
How to use the indicator?
To use the AutoPilot indicator:
Purchase a License ID: Acquire a license ID from PineConnector.
Setup PineConnector EA: Install and configure the PineConnector Expert Advisor on your MetaTrader platform.
Input Settings: Enter your PineConnector license ID, choose the order type, set your risk per trade, add the order comment, and select the trading symbol in the indicator's settings.
Create Alert: Right-click on the automation table, and set up an alert with the provided webhook to connect with PineConnector.
Automatic Management: Once set, your active trades will be automatically managed according to the alert conditions you've set.
This setup ensures your trades are managed seamlessly without constant manual intervention.
----
What makes this indicator original?
Integration with PineConnector: The AutoPilot indicator's originality lies in its integration with PineConnector, which allows for real-time trade management directly from TradingView to your MetaTrader platform. This setup is unique as it combines the analytical capabilities of TradingView with the execution capabilities of MetaTrader through a custom indicator, providing a seamless bridge between analysis and action.
Market Structure-Based Trailing Stop-Loss: Unlike many indicators that might use fixed percentages or ATR (Average True Range) for stop-loss adjustments, the AutoPilot indicator uses market structure (higher highs, lower lows) to dynamically adjust the stop-loss.
Probability-Based Adjustments: The indicator doesn't just trail stop-losses based on price but incorporates the probability of market structure holding or breaking. This probability-based trailing mechanism is innovative, aiming to balance between giving trades room to breathe and tightening when market behavior suggests a potential reversal or continuation.
Customizable Automation Table: The automation table within the indicator allows for detailed customization, including setting specific comments for trades. This feature, while perhaps not unique in concept, is original in its implementation within trading indicators, providing users with a high degree of control and personalization over trade management.
Real-Time Trade Management Alerts: The ability to set up alerts directly from the indicator to manage trades in real-time via webhooks to PineConnector adds a layer of automation that's not commonly found in standard trading indicators. This real-time connection for trade management enhances its originality by reducing the lag between analysis and trade execution.
User-Centric Design: The design of the AutoPilot indicator focuses heavily on user interaction, allowing for inputs like risk per trade, specific order types, and comments. This user-centric approach, where the indicator adapts to the trader's strategy rather than the trader adapting to the tool, sets it apart.
External Integration for Enhanced Functionality: By leveraging external services like PineConnector for execution, the indicator extends its functionality beyond what's typically possible within TradingView alone, making it original in its ecosystem integration for trading purposes.
Practical Implication: This means if you're in a trade and the market structure suggests the trend is continuing (e.g., making higher highs in an uptrend), your stop-loss might trail closer to the price but not too close to avoid being stopped out by normal fluctuations. If the structure breaks (e.g., a lower high in an uptrend), the stop-loss could adjust more aggressively to protect profits or minimize losses, anticipating a potential trend change.
This combination of features creates an original tool that not only analyzes market conditions but actively manages trades based on sophisticated market structure analysis.
----
User-input settings and customizations
----
Terms and Conditions | Disclaimer
Our charting tools are provided for informational and educational purposes only and should not be construed as financial, investment, or trading advice. They are not intended to forecast market movements or offer specific recommendations. Users should understand that past performance does not guarantee future results and should not base financial decisions solely on historical data. By utilizing our charting tools, the buyer acknowledges that neither the seller nor the creator assumes responsibility for decisions made using the information provided. The buyer assumes full responsibility and liability for any actions taken and their consequences, including potential financial losses. Therefore, by purchasing these charting tools, the customer acknowledges that neither the seller nor the creator is liable for any unfavorable outcomes resulting from the development, sale, or use of the products.
The buyer is responsible for canceling their subscription if they no longer wish to continue at the full retail price. Our policy does not include reimbursement, refunds, or chargebacks once the Terms and Conditions are accepted before purchase.
By continuing to use our charting tools, the user acknowledges and accepts the Terms and Conditions outlined in this legal disclaimer.

Ultra High/LowThe Ultra High/Low script helps traders track key price levels by automatically marking significant highs and lows on a chart, highlighting potential reversal points for future trading decisions.
Introduction
The Ultra High/Low script identifies and marks significant highs and lows on a trading chart. These are specific points where the price reached a peak or bottomed out before reversing. The script draws lines at these levels, which can be extended, and it also labels the exact price at these points. This makes it easy for traders to see where the price has changed direction previously, helping them make more informed trading decisions.
Detailed Description
In more detail, the Ultra High/Low script is designed using Pine Script™, a programming language used for creating custom indicators and strategies on the TradingView platform. Here's how it works:
..........
Detection of Pivot Highs and Lows
The script identifies "pivot highs" and "pivot lows." These are points on the chart where the price reached a local maximum or minimum, surrounded by lower highs (for pivot highs) or higher lows (for pivot lows).
The user can customize how many bars to the left and right of the high or low the script should consider to confirm a pivot (Length argument in the settings).
The script uses Pine Script functions for pivot detection. ta.pivothigh() and ta.pivotlow() .
......
Drawing Lines and Labels
Once a pivot is identified, the script draws a dashed line from the pivot point to the current price bar. This line helps visualize where significant price reversals have occurred.
The script also adds a label next to these lines showing the exact price of the pivot point. This label also shows "PDH" (Previous Day High) or "PDL" (Previous Day Low) if the pivot is PDH or PDL. Same for "PWH" (Previous Week High) and "PWL" (Previous Week Low).
......
Purging and Extending Lines
If the price crosses a pivot line after it has been drawn, the script can either delete the old line (purged line) or keep it and add additional indicators to show that the line has been liquidated.
The script also has options to extend the lines into the right.
......
Custom Inputs
The script offers several customizable options, like the color of the lines and labels, whether to show the exact price or not, and whether to extend the lines. This allows traders to tailor the indicator to their specific needs and preferences.
..........
Overall, the Ultra High/Low script is a powerful visual aid for identifying critical price levels that may influence future price movements, making it easier for traders to make decisions based on historical price behavior.

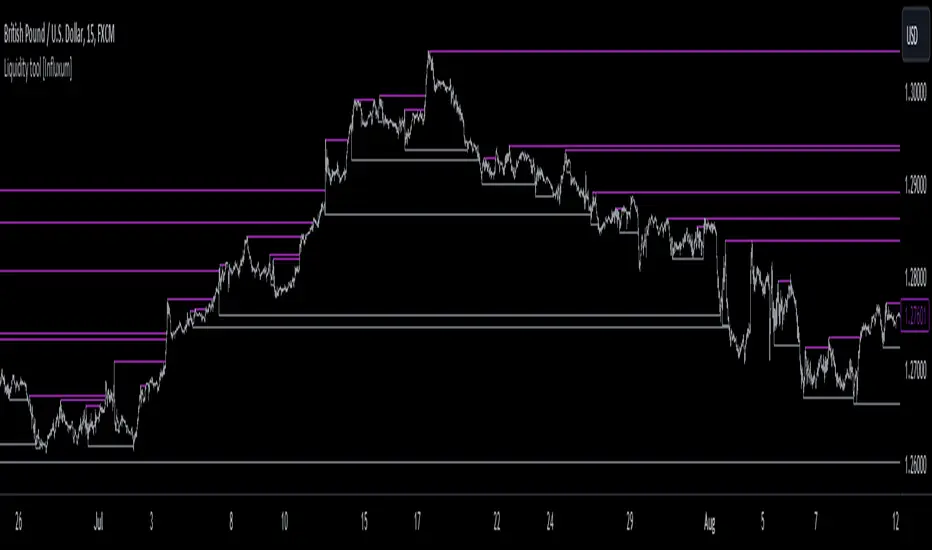
Liquidity tool [Influxum]One of the most widespread concepts that can give you an edge when trading in the markets is liquidity. There are several ways to identify and plot liquidity. This indicator aims to show how liquidity can be plotted entirely objectively, thus laying the foundation for a consistent trading system.
Pivot
One of the ways to identify liquidity is using pivots. Pivots are candles that are locally the highest or the lowest. We identify them using strength, which is a number that determines how many candles to the left and right of the pivot candle are lower for a pivot high and higher for a pivot low. It is important to keep in mind that a pivot candle is only confirmed when the last candle to the right closes. If I have the pivot number set to 10, it means that a pivot high is a candle that has 10 lower candles on the left and 10 lower candles on the right. Only after the 10th candle to the right closes is the pivot candle confirmed as a pivot high. Within this indicator, the liquidity line is drawn at this moment.
Tip for traders:
If you work with liquidity from both lower and higher timeframes, try adding two Liquidity Tool indicators to your chart: set a lower pivot number, for example, 5 for one, and a higher pivot number, for example, 20 for the other. At the same time, adjust the line width for liquidity with a higher pivot number to a higher value. This way, you achieve a combination of liquidity from significant higher timeframe structures and lower timeframe structures.
Gann Swing
The Gann swing is another objective way to mark liquidity in the market. Unlike pivot liquidity, which is based on the highest highs or lowest lows of candles, the Gann swing is based on the highest or lowest closes. We then mark liquidity when the current candle closes above the highest close of the last few candles or below the lowest close of the last few candles. While a pivot high might only show a local extreme in price development, the Gann swing deals with the actual closing of the price. Liquidity points determined by the Gann swing may thus be more indicative of where the price actually wants to go, not just where it was at a particular moment before sharply rebounding (as with pivot liquidity).
Percent Change
One of the most objective ways to identify liquidity is the percentage change in price. We plot liquidity only in places where there has been a sufficiently large swing/significant price movement. This can be particularly relevant for filtering out moments when the price is moving within a narrow range. In such a situation, many pivot highs and lows or Gann swings can occur, which may be only a few pips or fractions of a percent apart. If you set it so that you want liquidity to be plotted only on a swing of 0.1% (for forex, where this is a sufficiently large movement), you can easily filter out moments when the price was moving in a narrow range.
Liquidity Session
For Pivot, Gann, and Percentage liquidity, you have the option to set a trading session. This determines the time period for which you want liquidity to be plotted. You might want to see only the liquidity from the Asian session, for example. Check the checkbox with BG. This will display the background for the currently selected session. You can then check if you are working only with the liquidity of your intended session.
Note:
Sometimes you may notice that liquidity lines start even outside the selected session. This is not a mistake. As mentioned above with pivot liquidity, if the pivot number (strength) is 10, we wait for the tenth candle to close before liquidity is confirmed. The pivot candle itself is thus located 10 candles back, and that is where the liquidity line also begins. However, the crucial moment for this indicator is when the liquidity point is confirmed.
Visual Settings
To customize the indicator to your preferences as much as possible, you have the option to set the style of the liquidity line, its color, and its thickness. The analyses you share will then match your exact vision.
Delete Grabbed Liquidity
Check this option when you want to see only uncrossed liquidity on the charts, meaning liquidity lines that have not yet been crossed by the price.
Display Liquidity Grab Point
When you check this option, it highlights the points on the candles where liquidity was grabbed.
Liquidity Duration
Some strategies require that only internal liquidity be taken, meaning liquidity that was created recently. To accommodate this, we have embedded several options in the indicator to work with the validity duration of liquidity.
Delete Liquidity End of Day
This option deletes the liquidity line at the end of the calendar day. This way, you can display only intraday liquidity.
Tip for traders: If you check both "delete liquidity end of day" and "delete grabbed liquidity," only the liquidity of the current day will be displayed on the chart.
Delete Liquidity End of Next Day
This option works similarly to the above. By deleting liquidity only at the end of the next day, you can work with yesterday's liquidity. Many strategies use the liquidity of the previous day (or the high and low of the previous day), allowing you to focus exclusively on yesterday's and today's liquidity.
Liquidity Duration in Bars
The final option allows you to delete liquidity after a certain time has elapsed. For the purposes of the indicator, we have set the time in terms of the number of bars. So, if you are on a 5-minute timeframe and want liquidity to be deleted after an hour, set the liquidity duration to 12 bars (12 x 5 minutes is 60 minutes).
Custom Opening Price Levels (PO3)This indicator is designed to assist the trader in identifying the Power of Three through the opens of the candles.
-------------------------
The PO3 is a concept introduced by ICT. First, you need to have a directional bias for the month or the specific candle in question. It should be of high time frame (HTF BIAS).
At the open of the specific candle, the market will generate interest in the direction opposite to the HTF BIAS, accumulating positions. It will then manipulate the positions of less informed traders to generate the necessary liquidity to fill informed operators positions.
Finally, positions are distributed in favor of the bias.
-------------------------
The PO3 is a phenomenon that repeats across all timeframes. This indicator is highly customizable and allows the user to choose from a range of timeframes: 3 months, 1 month, 1 week, 1 day, and 3 hours. The indicator displays the last 3 opens for the selected period.
-------------------------
The script is open-source, so feel free to add more timeframes or open levels if you have coding skills.

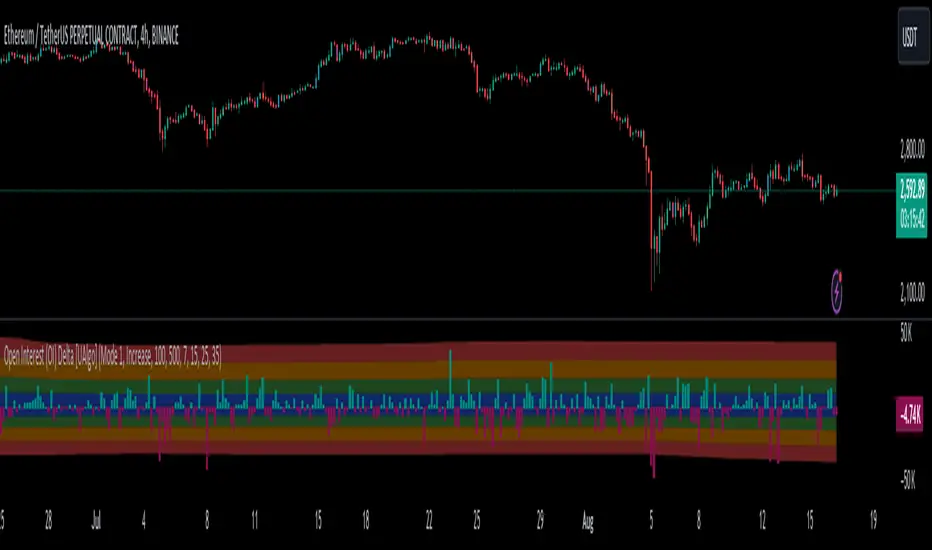
Open Interest (OI) Delta [UAlgo]The Open Interest (OI) Delta indicator is a tool designed to provide insights into the dynamics of Open Interest changes within the futures market. Open Interest (OI) refers to the total number of outstanding derivative contracts, such as options or futures, that have not been settled. The OI Delta measures the change in Open Interest over a specified period, allowing traders to assess whether new money is entering the market or existing positions are being closed.
This indicator offers two distinct display modes to visualize OI Delta, along with customizable levels that help in categorizing the magnitude of OI changes. Additionally, it provides the option to color-code the bars on the price chart based on the intensity and direction of OI Delta, making it easier for traders to interpret market sentiment and potential future price movements.
🔶 Key Features
Two Display Modes: Choose between two different modes for visualizing OI Delta, depending on your analysis preferences:
Mode 1: Displays the OI Delta directly as positive or negative values.
Mode 2: Separates positive and negative OI Delta values, displaying them as absolute values for easier comparison.
Customizable Levels: Set up to four levels of OI Delta magnitude, each with customizable thresholds and colors. These levels help categorize the OI changes into Normal, Medium, Large, and Extreme ranges, allowing for a more nuanced interpretation of market activity.
MA Length and Standard Deviation Period: Adjust the moving average length and standard deviation period for OI Delta, which smooths out the data and helps in identifying significant deviations from the norm.
Color-Coded Bar Chart: Optionally color the price bars on your chart based on the OI Delta levels, helping to visually correlate price action with changes in Open Interest.
Heatmap Display: Toggle the display of OI Delta levels on the chart, with the option to fill the areas between these levels for a more visually intuitive understanding of the data.
🔶 Interpreting Indicator
Positive vs. Negative OI Delta:
A positive OI Delta indicates that the Open Interest is increasing, suggesting that new contracts are being created, which could imply fresh capital entering the market.
A negative OI Delta suggests that Open Interest is decreasing, indicating that contracts are being closed out or settled, which might reflect profit-taking or a reduction in market interest.
Magnitude Levels:
Level 1 (Normal OI Δ): Represents typical, less significant changes in OI. If the OI Delta stays within this range, it may indicate routine market activity without any substantial shift in sentiment.
Level 2 (Medium OI Δ): Reflects a more significant change in OI, suggesting increased market interest and possibly the beginning of a new trend or phase of market participation.
Level 3 (Large OI Δ): Indicates a strong change in OI, often associated with a decisive move in the market. This could signify strong conviction among market participants, either bullish or bearish.
Level 4 (Extreme OI Δ): The highest level of OI change, often preceding major market moves. Extreme OI Δ can be a signal of potential market reversals or the final phase of a strong trend.
Color-Coded Bars:
When enabled, the color of the price bars will reflect the magnitude and direction of the OI Delta. This visual aid helps in quickly assessing the correlation between price movements and changes in market sentiment as indicated by OI.
This indicator is particularly useful for futures traders looking to gauge the strength and direction of market sentiment by analyzing changes in Open Interest. By combining this with price action, traders can gain a deeper understanding of market dynamics and make more informed trading decisions
🔶 Disclaimer
Use with Caution: This indicator is provided for educational and informational purposes only and should not be considered as financial advice. Users should exercise caution and perform their own analysis before making trading decisions based on the indicator's signals.
Not Financial Advice: The information provided by this indicator does not constitute financial advice, and the creator (UAlgo) shall not be held responsible for any trading losses incurred as a result of using this indicator.
Backtesting Recommended: Traders are encouraged to backtest the indicator thoroughly on historical data before using it in live trading to assess its performance and suitability for their trading strategies.
Risk Management: Trading involves inherent risks, and users should implement proper risk management strategies, including but not limited to stop-loss orders and position sizing, to mitigate potential losses.
No Guarantees: The accuracy and reliability of the indicator's signals cannot be guaranteed, as they are based on historical price data and past performance may not be indicative of future results.
SMC Orderblocks (MTF)The SMC Orderblocks Indicator is designed to detect institutional orderblocks by focusing on price action and pattern detection, with a strong emphasis on identifying liquidity grabs.
This tool helps traders pinpoint areas where significant institutional trades are likely to occur by assuming the presence of orderblocks based on observed market behavior.
Unlike other indicators that may rely heavily on volume, the SMC Orderblocks Indicator offers a fresh approach rooted in a deep study of price action and Smart Money Concepts (SMC).
🔍 Unique Approach
Unlike other orderblock indicators that typically depend on volume to detect orderblocks (a common and valid method), the SMC Orderblocks Indicator explores a new approach. After extensive study and understanding of price action and SMC principles, this indicator focuses on market behavior to assume where institutional orderblocks might be. This approach offers traders a unique perspective and valuable insights, allowing them to view the market through a different lens.
🧠 The Theory Behind It
In trading, liquidity is essential for institutions and large market participants to execute their substantial orders. Orders tend to cluster around predictable levels, such as recent highs or lows, creating pools of liquidity. To secure better entry points for their large trades, institutions and market makers may manipulate prices to sweep these liquidity levels. The SMC Orderblocks Indicator is designed to detect these market manipulations—when price moves to capture liquidity—and uses these events to assume the presence of orderblocks at key levels. By recognizing these manipulations, the indicator provides insights into potential areas of significant institutional activity.
⚙️ How It Works
In order to make it work, there are two big essentail parts for this indicator. The first one is being able to identify liquidity areas. The second one is to detect the liquidity grab pattern.
1. Identifying Liquidity
So, in order to find market manipulations, mainly "liquidity grabs", the first thing we need is to find where the liquidity is.
Here "liquidity", refers to "orders", and only the exchange actually knows at what price orders are placed. The limit orders are visible in the order book and most of the time the exchange let this information be publicly accessed. But not all orders are in the orderbook. The stop-limit orders like stop-loss orders are added in the orderbook only when the market price reaches a certain price (the stop price).
At present, when using a chart script like Pinescript, there is no known way to access this real information.
But fortunately, traders and institutional behavior stay the same. Traders tend to place their orders at predictable levels, like above highs or below lows. They can also be near inducement areas, specifically created by institutions to induce traders to place their orders at certain levels.
So, the job of the indicator is first to find these levels, regardless of the method used. In the previous version of this script, I used pivots to detect highs and lows, but this method was lacking when it came to finding inducement zones or stacks of liquidity.
Instead, the indicator now uses a new method to check whether there is a stack of non-liquidated candles. This method allows the detection of inducement zones with unliquidated candles. When the stack reaches a certain number (by default, three), the liquidity is marked as valid for sweep detection.
Note: When using the indicator, you can enable the display of liquidity (to see mitigated and unmitigated liquidity) and their stack number.
2. Detecting a Liquidity sweep
Once the first and key part is done, we need to detect the market manipulation: the liquidity grabs. Liquidity grab patterns are always the same. In the following example, let's assume the institutions want to fill sell orders in a bearish market. Here are the steps they will likely take:
- 1. The institutionals place their main orders (the orderblock) at a desired price.
- 2. They let the liquidity accumulate next to that desired price. They can even induce traders to place their own orders there. The will serve as liquidity.
- 3. Institutionals will manipulate the market price to move it towards their awaiting orders to fill them. Once that price is reach, and their orders are being filled, the market price will start moving in the opposite direction.
- 4. The grab is confirmed, when the liquidity in that oppsiite direction is grabed, or simply when the bearish market trend resumes by breaking the lows, along with additional confirmations
Sometimes, institutions will have two opposite positions in the same asset—one short and one long. This is called hedging. The goal here is to use the long orders to push the market price towards the main sell orders. Once the sell orders are filled and the market price starts falling, they may try to push it up again to close their long position with minimal loss and finally let the price fall for good.
It is at that moment that it is best to enter the market. This is why, by default, the indicator will display when the price starts moving upward towards the liquidity grab: because it's where the manipulation started and where the price is likely to reach again before resuming the main trend.
Real-Time Visualization:
As soon as an "orderblock" (or market manipulation) is detected, the indicator will display it on the chart in real time.
This immediate visualization helps traders stay ahead and catch the main market move.
💡 Usage Tips
Apply the script to your chart. This is a price-action based script so it will work on most markets. You do not need to edit settings but you can adjust them to match your trading style.
To get the most out of the SMC Orderblocks Indicator, it’s recommended to use it alongside other analysis tools, espacially market structure indicators. You can try the free-to-use SMC Market Structure (MTF) to filter the interesting orderblocks.
Additionnaly, if you search liquidity areas to set as your trade's target, you can enable their display to see mitigated and unmitigated liquidity lines. The display is disabled by default to keep charts clean.
While the indicator helps detect potential institutional orderblocks based on liquidity grabs, combining its insights with your trading knowledge and other tools will enhance decision-making.
⚠️ Disclaimer
While this method provides useful information, the orderblocks can only be assumed based on market behavior. Moreover, given how the indicator works, the accuracy cannot be guaranteed. It's important to combine the indicator's information with your own experience and other confirmation methods.
Orderblocks are also time-sensitive. The fact that an orderblock was detected and displayed on the chart does not guarantee that orders will still be present when the price returns to that level. If too much time has elapsed since the orderblock was created, or if the market structure has changed, it may be wise to disregard it. Always seek additional confirmation before opening a position.
The theory presented here on how institutional orderblocks are made, and how the market may be manipulated to fill orders, is based on my own research, knowledge, and analysis. Since I have never worked within an institution, these are educated assumptions and could be incorrect. Please always do your own research.
🚀 Active Development
The SMC Orderblocks Indicator is continuously evolving, with updates aimed at improving the rules for detecting and confirming orderblocks. Future updates may include new features and bug fixes to enhance performance and adapt to different trading styles.
📬 Note: If you encounter a bug, please contact me directly via private message, as I do not want to pollute the comment section with screenshots.
If you have any questions or suggestions for new features, feel free to reach out. You can also add a comment to boost its visibility.
Additionally, it’s recommended to compare the results of this indicator with others to find what best suits your trading style.
Please note that while this indicator is a paid script, you do not need to pay to test it. Contact me directly on TradingView via private message or through my socials, or leave a comment, and I’ll provide you with a free trial.
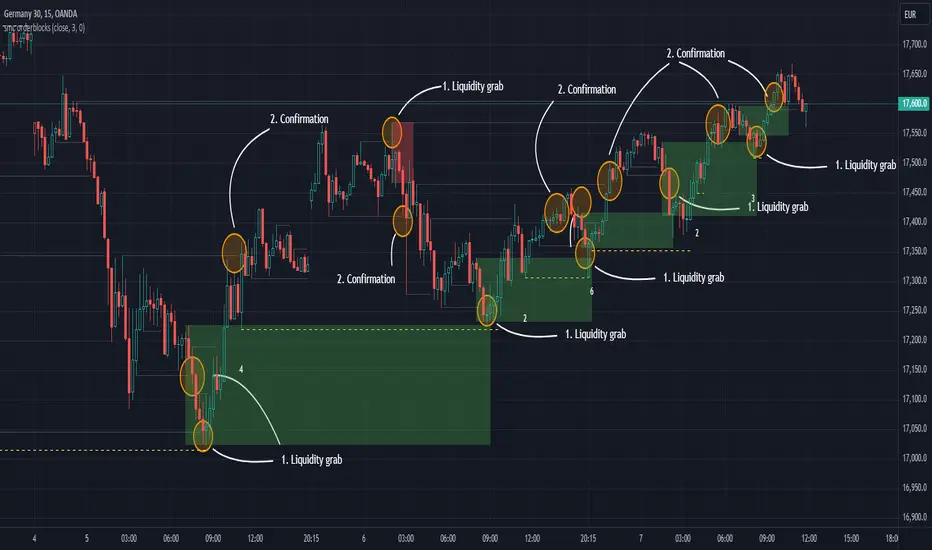
Market Core [BigBeluga]MARKET CORE Toolkit
The BigBeluga Market Core Toolkit is a comprehensive suite of advanced trading indicators designed to provide traders with a holistic view of market dynamics, structure, and potential opportunities.
In an ever-evolving market, relying on a single indicator can leave traders vulnerable to gaps in their analysis. The BigBeluga Market Core Toolkit addresses this challenge by integrating a range of complementary indicators that work synergistically to reveal the full picture. From detecting key support and resistance levels to identifying market structure shifts, volume imbalances, inefficiencies or analysis of money flow, this toolkit covers every aspect of market behavior.
⬤ Order Blocks
BigBeluga Order Blocks revolutionize the way traders visualize potential areas of significant market activity. Unlike traditional order block indicators that often result in cluttered, noisy charts, these Order Blocks are designed for clarity and effectiveness. They simulate and predict where large areas of market orders may rest by analyzing volume and volatility, providing excellent support or resistance areas.
The blocks offer cleaner chart presentation with reasonable distribution, volume ratio visualization within each block, and categorization into Strong, High and Balanced blocks.
Additionally, a third line has been introduced to rank order blocks by volume using a modified percent rank method for more precise ranking.
This ranking system uses percentile ranks, a concept commonly used in standardized tests. In the context of order blocks, the percentile rank of a particular order block's volume is interpreted as the percentage of the order blocks strength. This method provides a more nuanced and statistically robust way of comparing and prioritizing order blocks.
Key features:
Cleaner chart presentation with reasonable distribution of blocks
Volume ratio visualization within each block (bullish vs bearish)
Categorization into High and Balanced blocks for easy identification of significant levels
Relative volume percentage and volume delta display
Advanced ranking system using modified percent rank method for volume comparison
These Order Blocks help traders:
Forecast excellent support or resistance areas
Gain insight into the balance of the market at specific levels
Identify significant market levels at a glance
Visualize market imbalances through volume delta
Prioritize order blocks based on their relative volume importance
Make more informed decisions about potential entry and exit points
⬤ Beluga Profile
The Beluga Profile is a revolutionary market analysis tool that transforms complex market data into a clear, intuitive visual narrative. At its core, it combines a Dual-Profile Analysis, merging Delta Volume Profile with Money Flow Profile to give traders a comprehensive view of market dynamics.
The percentage scale on the left side aren't just numbers; they represent the Levels Strength Percentage, a crucial ranking system that immediately draws your attention to the most significant price zones. Complementing this, a heat map overlay brings these strength levels to life, offering an instant, color-coded representation of where the market's most influential areas lie.
To the right, a detailed breakdown of volume and money flow for each level provides the hard data behind the visual cues. This granular information allows you to dive deep into the market's structure, understanding not just where the significant levels are, but why they matter.
Below the main chart, the Delta Volume Bar serves as a foundation, showing the average delta of the volume profile. This bar is more than just a measure of volume – it's a window into the underlying forces driving price movement. Just above this bar, a macro trend indicator in the form of an arrow offers a quick, clear signal of the overall market direction based on these delta volume calculations.
But the Beluga Profile doesn't just show you what's happening – it helps you understand the 'why' and 'how'. The Adaptive Points of Interest feature allows you to customize your analysis, focusing on the areas that matter most to your trading strategy. You can select from various options including Money Flow, Delta+, Delta-, Volume+, and Level % (Highest), tailoring the display to your specific analytical needs. This flexibility ensures you can focus on the most relevant data for your trading style. Real-time Active Price Tracking ensures you're always in sync with the latest market movements.
All of these elements work in concert, creating a symphony of market information. They empower you to:
Spot key price levels with uncanny precision
Foresee potential market turns before they happen
Grasp the quality and strength of price moves
Adjust your strategy on the fly as market conditions shift
Develop a holistic understanding of market structure and participant behavior
Make informed decisions backed by a clear view of the overall market trend
In essence, the Beluga Profile isn't just a tool – it's your market storyteller, translating the complex language of price, volume, and money flow into a narrative that you can understand and act upon with confidence.
⬤ Smart Money Concepts (SMC)
The Smart Money Concepts component of the toolkit focuses on automatically detecting key market structures crucial in technical analysis. It identifies and visualizes Break of Structure (BOS) and Change of Character (CHOCH) patterns, helping traders spot potential trend reversals and significant market movements. This includes BOS identification when price breaks previous support or resistance and CHOCH detection for potential trend reversals, with automatic detection of both bullish and bearish patterns.
The latest enhancement to this feature adds a new layer of analysis through Delta Volume Calculation. When a BOS or CHOCH is detected, the toolkit calculates the delta volume within the range from the high or low point to the break point. This analysis considers all the candles in this range and determines whether the volume is predominantly bullish, bearish, or neutral.
Bullish Volume: If the delta volume is bullish, a green diamond is plotted at the high or low point, indicating potential upward momentum.
Bearish Volume: If the delta volume is bearish, a red diamond is plotted, suggesting downward pressure.
Neutral Volume: When the volume is neutral, a yellow diamond is displayed, indicating a balance in buying and selling forces.
This visual representation of volume dynamics provides an additional layer of insight, helping traders assess the strength and direction of price movements following a structure break. You can see an example of this on the attached image, where the diamonds clearly indicate the type of volume driving the breakout.
The toolkit also incorporates Fair Value Gap (FVG) Detection. Fair Value Gaps represent inefficiencies in the market, where there is an imbalance between buy and sell orders. These gaps often act as magnets for price, potentially leading to future reversals or continuations when filled. The toolkit identifies and highlights these gaps, allowing traders to recognize areas where the market may seek to rebalance.
Additionally, Double Top and Bottom Pattern Detection has been integrated, identifying potential reversal points at these classic price formations. Double tops signal potential bearish reversals after a price peak, while double bottoms suggest potential bullish reversals after a price dip. These patterns can be crucial indicators for traders looking to capitalize on upcoming trend changes.
Smart Money Concepts help traders:
Identify potential trend reversals early with a clearer view of market structure.
Recognize significant changes in market structure and volume participation.
Differentiate between temporary pullbacks and genuine trend changes using volume insights (color coded diamonds).
Shows Fair Value gaps which helps to identify price momentum and inefficiencies in the market.
This enhancement ensures that traders can not only see structural changes but also understand the volume behind those moves, leading to more informed and confident trading decisions.
⬤ Support and Resistance Levels
This powerful tool is designed to identify key price levels in the market, providing traders with a clear visual representation of potential support and resistance areas. It goes beyond simple level identification by incorporating a sophisticated ranking system and adjustable sensitivity.
The grading system of levels is a unique feature that evaluates the significance of high and low points in the price action. It takes into consideration how many times the price has touched or interacted with specific levels. This means that levels which have been tested multiple times are given higher importance in the ranking. For example, a price level that has acted as support or resistance three times will be ranked higher than a level that has only been touched once.
By leveraging this grading system, traders can focus on the most significant levels that have repeatedly influenced price action, potentially improving the accuracy of their trading decisions and risk management strategies.
This Support and Resistance Levels indicator helps traders:
Identify and prioritize potential reversal points based on their historical significance and frequency of price interaction
Set more accurate entry and exit points aligned with key market levels, focusing on those with higher ranking
Understand the hierarchical structure of market support and resistance, distinguishing between major and minor levels
Plan stop-loss and take-profit levels with greater precision, using the ranking to gauge the strength of each level
Adapt their analysis to varying market strengths and volatilities, with the ability to filter out less significant levels
Recognize recurring price patterns and potential breakout levels based on the ranked historical price interactions
⬤ How to Use the Toolkit
Each of these indicators, while powerful on its own, works synergistically with the others to provide a more complete picture of the market.
The strength of this toolkit lies in its ability to analyze the market from multiple perspectives
Combining these advanced trading indicators into a cohesive toolkit empowers traders with a comprehensive, multi-dimensional view of the market that no single indicator could provide on its own. The market's complexity demands an approach that goes beyond relying on just one aspect, such as price action, volume, or order flow. Integrating these diverse indicators creates a robust analytical framework that captures the market from multiple angles, leading to more accurate insights and better-informed decision-making.
Analyze Order Blocks to identify potential support/resistance and volume imbalances
Use Beluga Profile for comprehensive market structure and trend analysis
Monitor SMC indicators for potential trend reversals and breakouts
Utilize Support and Resistance Levels for precise entry/exit points and risk management
Combine insights from all tools for a multi-dimensional view of market conditions
⬤ Customization
Each component of the toolkit offers various customization options to suit different trading styles and preferences. These inputs allow traders to adjust settings to better fit their analysis needs and strategies:
Order Blocks
- Order Blocks : Set the amount of Order Blocks on the chart.
- Color Selection : Choose the color for highlighting the order blocks on your chart.
Market Structure
- Sensitivity : Adjust the sensitivity for detecting market structure breaks. Higher sensitivity will detect more granular breaks, while lower sensitivity focuses on more significant movements.
- Data : Enable or disable the display of market structure data.
- Zigzag Option : Toggle Zigzag displays from highs and lows.
S/R (Support and Resistance)
- Sensitivity : Control how sensitive the tool is in detecting support and resistance levels. Lower sensitivity will highlight fewer but stronger levels, while higher sensitivity may reveal more levels.
- Width % : Adjust the width of the support and resistance zones to visually emphasize their importance.
- Color Selection : Choose colors for both support and resistance levels for better clarity.
FVG (Fair Value Gap)
- Max : Set the maximum number of fair value gaps to display. Higher values will show more gaps, while lower values will focus on the most prominent ones.
- Color Selection : Customize the color for the fair value gap areas.
Volume Profile
- Length : Define the look-back period for the volume profile analysis. A longer length considers more historical data, while a shorter length focuses on recent data.
- Levs : Choose the number of volume levels to display, allowing for more or fewer volume bars within the profile.
- BG : Enable or disable background shading for the volume profile.
- HeatMap : Activate or deactivate the heat map overlay for volume intensity visualization.
- POC (Point of Control) : Toggle the Point of Control display and choose between different metrics, such as volume+, money flow, Delta+ and Delta-, Level % (Highesr), to base the POC on.
- Color Selection : Customize the color for the Point of Control line.
These customization options provide traders with the flexibility to tailor the toolkit to their specific trading strategies, enhancing their ability to identify key market signals with precision.
Each component of the toolkit offers various customization options to suit different trading styles and preferences.
The BigBeluga Market Core Toolkit synthesizes complex market data into clear, actionable formats, providing traders with professional-level insights. It's a comprehensive market analysis system that can give traders a significant edge in understanding market behavior and identifying high-probability trade setups. While highly effective, it's recommended to use this toolkit in conjunction with fundamental analysis and sound risk management practices for optimal trading results.
Script pago

Delta Flow Profile [LuxAlgo]The Delta Flow Profile is a charting tool that tracks and visualizes money flow and the difference between buying and selling pressure accumulated within multiple price ranges over a specified period. It reveals the relationship between an asset's price and traders' willingness to buy or sell, helping traders identify significant price levels and analyze market activity.
The Normalized Profile displays the percentage of money flow at each price level relative to the maximum money flow level, enabling traders to easily compare levels and understand the relative importance of each price point in the context of overall trading activity.
🔶 USAGE
The Delta Flow Profile is made of two principal components with different usability, each one of them described in the sub-sections below.
🔹 Money Flow Profile
The Money Flow Profile illustrates the total buying and selling activity at different price ranges. By analyzing this profile, users can identify key price zones with substantial buying or selling pressure. These zones can often act as potential support or resistance.
The rows of the Money Flow Profile represent the trading activity at specific price ranges over a given period.
A normalized profile is included to compare each zone relative to the peak money flow using a percentage, with 100% indicating that a price range is the one with the highest accumulated money flow.
🔹 Delta Profile
The Delta Profile assesses the dominant sentiment (buying or selling) from volume delta at different price levels to gauge market sentiment and potential reversals.
Delta Profile rows with more significant buying or selling volume indicate dominance from one side of the market in that specific price area. Price coming back to that area might indicate willingness from a dominant side to further accumulate orders within it, potentially causing price to follow the direction established by this dominant side afterward.
The volume delta is determined from the user-selected Polarity Method, with "Bar Polarity" using candle sentiment to determine if a bar associated volume is buying or selling volume, and "Bar Buying/Selling Pressure" making use of the high/low price to obtain more precise results.
🔹 Level of Significance
Users can quickly highlight the price levels with the highest recorded money flow activity through the included "Level of Significance". Various display methods are included:
Developing: Show the price level with the highest recorded money flow activity spanning over the indicator calculation interval.
Level: Show the price level with the highest recorded money flow activity.
Row: Show the price zone with the highest recorded money flow activity.
These levels/zones can be used as potential support/resistance points and can serve as a reference of where prices might go next for market participants to accumulate orders.
🔶 SETTINGS
The script offers a range of customizable settings to tailor the analysis to your trading needs.
🔹 Calculation Settings
Money Flow Profile: Toggles the visibility of the Money Flow Profile.
Normalized: Toggles the visibility of the Normalized Profile.
Sentiment Profile: Toggles the visibility of the Sentiment Profile.
Polarity Method: Choose between Bar Polarity or Bar Buying/Selling Pressure to calculate the Sentiment Profile.
Level of Significance: Toggles the visibility of the level of significance line/zone.
Lookback Length / Fixed Range: Sets the lookback length.
Number of Rows: Specify how many rows each profile histogram will have.
🔹 Display Settings
Profile Width %: Alters the width of the rows in the histogram, relative to the profile length.
Profile Horizontal Offset: Enables moving the profile on the horizontal axis.
Profile Text: Toggles the visibility of profile texts, and alters the size of the text. Setting to Auto will keep the text within the box limits.
Currency: Extends the profile text with the traded currency.
Profile Price Levels: Toggles the visibility of the profile price levels.
🔶 RELATED SCRIPTS
Money-Flow-Profile
Volume-Profile-with-Node-Detection

Pure Price Action Liquidity Sweeps [LuxAlgo]The Pure Price Action Liquidity Sweeps indicator is a pure price action adaptation of our previously published and highly popular Liquidity-Sweeps script.
Similar to its earlier version, this indicator detects the presence of liquidity sweeps on the user's chart, while also identifying potential areas of support/resistance or entry when liquidity levels are taken. The key difference, however, is that this price action version relies solely on price patterns, eliminating the need for numerical swing length settings.
🔶 USAGE
A Liquidity Sweep occurs when the price breaks through a liquidity level , after which the price returns below/above the liquidity level , forming a wick.
The examples below show a bullish and bearish scenario of "a wick passing through a liquidity level where the price quickly comes back".
Short-term liquidity sweep detection is based on short-term swing levels. Some of these short-term levels, depending on further market developments, may evolve into intermediate-term levels and, in the long run, become long-term levels. Therefore, enabling short-term detection with the script means showing all levels, including minor and temporal ones. Depending on the trader's style, some of these levels may be considered noise. Enabling intermediate and long-term levels can help filter out this noise and provide more significant levels for trading decisions. For further details on how swing levels are identified please refer to the details section.
The Intermediate-term option selection for the same chart as above, filters out minor or noisy levels, providing clearer and more significant levels for traders to observe.
🔶 DETAILS
The swing points detection feature relies exclusively on price action, eliminating the need for numerical user-defined settings.
The first step involves detecting short-term swing points, where a short-term swing high (STH) is identified as a price peak surrounded by lower highs on both sides. Similarly, a short-term swing low is recognized as a price trough surrounded by higher lows on both sides.
Intermediate-term swing and long-term swing points are detected using the same approach but with a slight modification. Instead of directly analyzing price candles, we now utilize the previously detected short-term swing points. For intermediate-term swing points, we rely on short-term swing points, while for long-term swing points, we use the intermediate-term ones.
🔶 SETTINGS
Detection: Period options of the detected swing points.
🔶 RELATED SCRIPTS
Pure-Price-Action-Structures.
Liquidity-Sweeps.

Volume Gaps and ImbalancesThis Pine script indicator is designed to visually depict price inefficiencies, as identified by Volume Imbalances (VI) or Gaps. A Volume Gap is a scenario where the wicks of two successive candles don’t intersect, while an Imbalance occurs when only the wicks overlap, leaving the bodies apart. These zones of inefficiency frequently act as magnets for price, with the market striving rebalance in accordance with ICT principles.
Relevance:
Volume Gaps/Imbalances are zones of highly inefficient price delivery as per ICT concepts and represent a very strong draw to price. Price will often seek to rebalance those zones to ensure efficient price delivery. Consequently, these zones can provide good targets for entries in the opposite direction or take profit targets for previous entries in the direction of the Gap/Imbalance.
How It Works:
The indicator keeps track of all Gaps/Imbalances from the beginning of the available history. It automatically removes all mitigated Gaps/Imbalances, which are situations where the price has at least reached the bottom of a bullish gap or the top of a bearish gap.
On the last bar, the most recent valid gaps are highlighted with a box drawn from the start to the end of the gap. The start of a bullish gap is determined by the highest price of the previous candle’s open or close, while for bearish gaps, it’s the lowest price of the previous candle’s open or close. Conversely, the end of a bullish gap is the lowest price of the current candle’s open or close, and for bearish gaps, it’s the highest price of the current candle’s open or close.
To enhance the indicator’s speed and minimize chart noise, only the most recent gaps will be displayed, up to the limit set in the indicator settings.
Each displayed VI/GAP will indicate the size of the imbalance in ticks. For imbalances greater than 3 ticks, which represent stronger draws of liquidity, the color transparency will be reduced, and the text will be made more prominent. Volume Gaps are also marked with a 🧲 emoji for easy visual identification.
The indicator will automatically extend the boxes representing valid imbalances to the current bar for as long as the imbalance is not mitigated.
If an imbalance has been tapped, but not mitigated, the indicator will append 🚩emoji to denote that the imbalance has been partially mitigated and may no longer have as strong of a draw for price.
Configurability:
A user may configure the number of imbalances to show, the setting applies to bullish/bearish imbalances individually. This setting can be set to any value from 1 – 50.
Appearance wise, color, style and color transparency of each box representing an imbalance can be configured. The imbalance box label can be configured by setting the text size, along with the vertical & horizontal alignment.
What makes this indicator different:
Designed with high performance in mind, to reduce impact on chart render time.
Only keeps valid imbalances on the chart, with a limit on the # drawn
Indicates the size of the gap and provides visual markets to denote stronger, weaker and partially mitigated gaps

ICSM (Impulse-Correction & SCOB Mapper) [WinWorld]DESCRIPTION
ICSM (Impulse-Correction SCOB Mapper) is the indicator that analyzes the price movement and identifies valid impulses, corrections and SCOBs. It is a powerful tool that can be used with any type of technical analysis because it's flexible, informative, easy to use and it does substantially improve trader's awareness of the most liquid zones of interest.
SETTINGS
General | Visuals
Colour theme — defines the colour theme of the ICSM.
SCOB | Visuals
Show SCOB — enables/disables SCOB;
Mark SCOB with — represents a list of style options for SCOB representation;
SCOB colour — defines the colour of the SCOB;
ICM | Visuals
Show ICM lines — enables/disables ICM (Impulse-Correction Mapper) lines;
Show IC trend — enables/disables visualization of impulse-correction trend via coloured divider at the bottom of the chart;
Line colour — defines the colour of the ICM lines;
Line style — defines the style of the ICM lines;
Alerts
ICM — enables/disables alert for breaking ICM lines;
SCOB — enables/disables alert for SCOB creation;
ICM+SCOB — enables/disables alert for SCOB occurance at the end of the single impulse/correction, which grabs ICM line's liquidity.
ICM+SCOB (same candle) — enables/disables alert for SCOB occurance at the candle, which grabs ICM line's liquidity.
IMPORTANT CONCEPTS
In order to fully understand what ICSM can do, let's do a quick overview of the most important concepts that this indicator is built on.
By ICM we mean the liquidity grabbing of Impulse-Correction Mapper's lines (ICM lines; represented as dashed horizontal lines on the chart ). Saying shortly, liquidity grabs of ICM lines posses great opportunities for finding great entries.
SCOB (Single Candle Order Block) builds up by 3 simple rules:
Previous candle's liquidity is grabbed;
Current candle closes inside previous candle;
Imbalance occurs on the next candle.
SCOB is a quite useful zone of interest, from which the price usually reverses. You can also use SCOB as POI* on HTF** or as entry zone on LTF***.
* POI — Point Of Interest
* HTF — Higher TimeFrame
* LTF — Lower TimeFrame
"ICM+SCOB" is a short name that we use for event, at which price first grabs the liquidity from ICM line and then creates a SCOB at the same impulse/correction movement ( on the same ICM line, that does the liquidity grab ). Usually the SCOB that occurs after this event represents a highly liquid zone of interest , which should be considered when choosing entry level.
"ICM+SCOB (same candle)" is basically the same as "ICM+SCOB" event but with one major difference — the candle, which grabs the liquidity of ICM line, is also the candle at which the SCOB occurs, making such SCOB an even better zone of interest than a regular SCOB from ICM+SCOB event.
BIGGEST ADVANTAGES
ICSM precisely identifies impulses and corrections. Huge load of indicators on the TradingView does only show the simplest zones of interests, while ICSM uses our team's signature algorithms to precisely identify true impulses and corrections in the market, allowing traders to see both local and global price direction better and at the same time providing traders with the most liquid zones of interest;
ICSM shows points of interest and liquidity. The indicator identifies the nearest points of interest and zones, where the liquidity is concentrated, allowing you to find great entry and exit points for your trades;
ICSM has SCOB (Single Candle Order Block) detection function. ICM is packed with the extremely useful in SMC trading SCOB detetction feature, which allows you find even more solid points of interest;
ICSM has super minimalistic design, which contains only the things you really need. Your chart will not be overloaded with unnecessary information. You will only see clear points of interest, liquidity and price movement.
WHY SHOULD YOU USE IT?
As was said above, ICSM allows you to see the most profitable points and zones of interest, which professional SMC traders consider as one of the best in the market, because they are historically the areas from which the price bounces the most, allowing the smartest traders to get quick an clean profits with low drawdown.
In the ICSM indicator these zones are SCOB and ICM line liquidity grabs. By using these zones of interest to find entry points, you increase the chance to open a trade at the most lucrative price and reduce trading risks.
Considering what was said above, this indicator can help traders reduce drawdown risks and increase potential profits simply by showing the most liquid zones of interest, which are perfect for opening a trading position.
Here are some of the examples of how you leverage ICSM in your trading process:
Example of the short trade:
Price shows overall short trend. Trend liquidity is being formed.
Price grabs liduiqity from three ICM lines in a row and then creates a long SCOB at the end of 3rd liquidity grab.
SCOB, which occured at the end of ICM line, represents much stronger zone of interest than a regular SCOB. In this case it represents a zone, which we will use to find an entry.
The entry for the trade will be SCOB candle's low, stop-loss target should be put above SCOB candle's high. Our take-profit target is trend liquidity. See the screenshot above for better understanding.
▼ Now let's see the long trade example. ▼
Example of the long trade:
Price creates trend liquidity by showing equal highs ( EQH ).
Price grabs liduiqity from four ICM lines in a row and then creates a long SCOB at the end of 4th liquidity grab.
Again: SCOB, which occured at the end of ICM line, represents much stronger zone of interest than a regular SCOB. In this case it represents a zone, which we will use to find an entry.
The entry for the trade will be SCOB candle's high, stop-loss target should be put below SCOB candle's low. Our take-profit target is EQH. See the screenshot above for better understanding.
ALERTS
ICSM provides simple and easy alert customization, allwoing to choose only the alerts you want to receive. You can choose from the following alert options:
ICM — impulse or correction liquidity grab;
SCOB — SCOB is formed, wether or not the liquidity is grabbed from the impulse or correction;
SCOB+ICM — SCOB is formed after grabbing the liquidity of the ICM line;
SCOB+ICM (same candle) — SCOB is formed in the liquidity area of the impulse or correction.
HOW CAN I GET THE MOST OUT OF IT?
ICSM displays only the first liquidity of an impulse or correction, which matches the IDM (Inducement) in the Advanced SMC strategy . This strategy is completely covered in the World Class SMC indicator and is available for free for PDF in three parts.
You can also ICSM with any other strategy, because ICSM is a very flexible indicator and will help anyone improve their trading by making one aware of the high-quality liquidity on the chart.
Let's see how you can leverage ICSM with our World Class SMC indicator and other different strategies:
Example of the long & short trades with World Class SMC.
Long (1-3):
Price reached previous OB-EXT . This is the first sign for the potential price reversal;
ICM+SCOB happened after price reached OB-EXT;
After that, you can need to look for an entry on LTF. If you don't know how to do it, you can refer to our education materials.
Short (4-6):
Price reached OB-IDM , which is also a great sign for a potential upcoming price reversal;
ICM+SCOB occured after liquidity grab of the previous SCOB. This fact does strengthen the probability of the potential upcoming price reversal;
Now you need to switch to LTF and find an entry there.
Example of the short trade with simple Fibonacci retracement strategy.
Price grabs the liquidity of the ICM lines three times in a row, forming SCOB after the 3rd grab;
Price performs correctional move down without testing the SCOB, leaving no entry opportunity by our initial strategy, so we can add another strategy — Fibonacci retracement from 0.618 level — to our analysis in order to find an entry ;
We use Fibonacci grid with our initial strategy to find the best POI, that will align with the trend direction and will eventually become our entry point.
SUMMARY
ICSM is a unique indicator that indentifies zones and points of interests with high-quiality liquidity and can be both a stand-alone tool and can be integrated into any other strategy to increase the efficiency of analysis, accuracy of trading entries and reduce trading risks.
If you want to learn the SMC strategies that our team uses in our products, you can refer to our educational materials.
We hope that you will find a great use of ICSM and it will help you improve your perfomance as a trader. Best of luck, traders!
— with love, WinWorld Team

Price Action Toolkit Lite [UAlgo]The Price Action Toolkit Lite is a comprehensive indicator designed to enhance your chart analysis with advanced price action tools. This powerful toolkit combines multiple technical analysis concepts to provide traders with a clear visualization of market structure, liquidity levels, order blocks, and trend lines. By integrating these elements, the indicator aims to offer a holistic view of price action, helping traders identify potential entry and exit points, as well as key levels of interest in the market.
🔶 Key Features
Market Structure Analysis: The indicator includes a ZigZag feature to highlight significant market highs and lows, aiding in the visualization of market structure changes and trends.
Liquidity Sweeps Detection: It identifies and displays liquidity sweeps, which are crucial for recognizing potential market reversals and areas of interest where significant price action is likely to occur.
Order Blocks: Automatically detects and draws order blocks, highlighting areas of institutional buying and selling pressure, which can serve as key support and resistance levels.
Trend Lines: The toolkit can draw and extend trend lines based on pivot points, providing a clear view of prevailing market trends and potential breakout points.
Customizable Settings: Users can adjust various settings, including the length of the ZigZag, liquidity detection sensitivity, the number of order blocks to display, and trend line detection parameters, allowing for a tailored analysis experience.
🔶 Disclaimer
The "Price Action Toolkit Lite " is intended for educational and informational purposes only.
It is not financial advice and should not be construed as such. Trading in financial markets involves substantial risk, including the risk of loss.
Past performance is not indicative of future results.
🔷 Similar Scripts

Liquidity Swings & SweepsThis Pine script indicator is designed to create a visual representation liquidity as identified by swing Highs/Lows along with an indication of the liquidity level that was swept, optionally rating the strength of the sweep based on time & price.
Relevance:
Liquidity levels & sweeps are crucial for many SMC/ICT setups and can indicate a point at which the price changes direction or may re-trace in an opposite direction to provide additional liquidity for continued move in the original direction. Additionally, liquidity levels may provide targets for setups, as price action will often seek to take out those levels as they main contain many buy/sell stops.
How It Works:
The indicator tracks all swing points, as identified using user-defined strength of the swing. Once a swing is formed that meets the criteria, it is represented by a horizontal line starting at the price of the current swing until the last bar on the chart. While the swing is valid, this line will continue to be extended until the swing is invalid or a new swing is formed. Upon identifying a new swing, the indicator then scans the earlier swings in the same direction looking for a point of greatest liquidity that was taken by the current swing. This level is then denoted by dashed horizontal line, connecting earlier swing point to the current. At the same time any liquidity zones between the two swings are automatically removed from the chart if they had previously been rendered on the chart. If the setting to enable scan for maximum liquidity is enabled, then while looking back, the indicator will look for lowest low or highest high that was taken by the current swing point, which may not be a swing itself, however, is a lowest/highest price point taken (mitigated) by the current swing, which in many cases will be better price then then the one represented by previous swing. If the option to render sweep label is enabled, the sweep line will also be completed by a label, that will score the sweep and a tooltip showing the details of the level swept and the time it took to sweep it. The score explained further in configurability section ranks the strength of the sweep based on time and is complemented by price (difference in price between the two liquidity levels).
Configurability:
A user may configure the strength of the swing using both left/right strength (number of bars) as well as optionally instruct the indicator to seek the lowest/highest price point which may not be previous swing that was taken out by newly formed swing.
From appearance perspective liquidity level colors & line width presenting the liquidity/swing can be configured. There is also an option to render the liquidity sweep label that will generate an icon-based rating of the liquidity sweep and a tooltip that provides details on the scope of the swing, which includes liquidity level swept and when it was formed along with the time it took to sweep the liquidity.
Rating is of sweeps is primarily based on time with a secondary reference to price
💥- Best rating, very strong sweep with an hourly or better liquidity sweep
🔥- Second rating, strong sweep with 15 – 59 minute liquidity sweep, or 5+ minute sweep of 10+ points
✅- Third rating, ok sweep with 5 - 15 minute liquidity sweep, or lower-time-frame sweep of 10+ points
❄️ - Weakest sweep, with liquidity of 5 or less minutes swept
What makes this indicator different:
Designed with high performance in mind, to reduce impact on chart render time.
Only keeps valid liquidity levels & sweeps on the chart
Automatically removes previously taken liquidity levels
Ranks liquidity sweeps to indicate strength of the sweep

Liquidity Founder The Liquidity Swings indicator aids traders in detecting liquidity swings within the market, providing essential insights for making well-informed trading decisions. Key features include:
How this Indicator work - this indicator search pivot point that is used to determine the levels at which price may face support or resistance. The Pivot Points indicator consists of a pivot point (PP) level and several support (S) and resistance (R) levels. if input number of bar selected 3 than it will look back 3 candle and wait for next 3 candle to make pivot high and low after it identify pivot it draw a line and extend until it no longer intersects with the high or low prices
What is different in my indicator compared to a normal pivot point and what Makes This Indicator Original :
1) Swing High and Low Logic:It avoids marking consecutive pivot highs until a new pivot low is formed, reducing market noise and highlighting significant trend reversals.
2)Volume Integration: By incorporating volume data, the indicator ensures that pivot points are validated with sufficient market activity, enhancing their reliability as support and resistance levels.
3) Multi-Time Frame Analysis:The ability to input and analyze multiple time frames allows the indicator to draw strong support and resistance levels that are relevant across different trading periods, making it versatile for various trading strategies.
🟠 Liquidity Swings indicator
✅Visualization of Liquidity Zones:Accumulation Areas: Identifying regions where liquidity is gathering.liquidity Sweeps: Pinpointing areas where liquidity is being cleared.
✅Pivot and Volume Analysis:Price Pivots: Monitoring significant pivots in price.
Volume Correlation: Linking price pivots with volume to highlight zones of potential support and resistance.
✅Market Dynamics Understanding:Enables traders to visualize and understand market dynamics more effectively.Assists in pinpointing potential support and resistance levels based on liquidity swings.
⭐Example -EurUsd 1 minutes chart developed Potential Support and Resistance Zone
⭐⭐⭐Key Features:
1) Adjustable Time Frame: Allows traders to analyze different periods by modifying the time frame setting.
2) Swing Look back Period: Sets the period for identifying potential price swings, enhancing flexibility in analysis.
🟠 Understanding Strong Support :These are identified by dense clusters of green lines, indicating high concentrations of buy orders that have not yet been executed. These areas suggest strong buying interest which can potentially halt further price declines.
⭐ Example -below chart image BtcUsd 5 minutes 2 line are still not touched by price
⭐⭐⭐Reasons for Strong Support:
✅Untouched Liquidity Lines: These green lines represent pending buy orders, indicating robust buying interest at these levels.
✅Accumulation of Orders: Many buy orders are aggregated in these zones, capable of preventing further price drops when approached.
✅ Historical Performance: These areas have previously prevented price declines, establishing them as reliable support zones.
✅ Market Confidence: Close clustering of green lines signifies widespread trader belief in favorable buying conditions, reinforcing support strength.
🟠 Understanding Strong Resistance :Highlighted by dense clusters of red lines, denoting substantial sell orders that did not executed. These zones signify significant selling interest which can impede further price increases.
⭐ Example -below chart image Btcusd 3 minutes 3 line did touched by price previously .price touched that area and retraced because of unfilled liquidity
⭐⭐⭐ Reasons for Strong Support:
✅ Untouched Liquidity Lines: These green lines represent pending buy orders, indicating robust buying interest at these levels.
✅ Accumulation of Orders: Many buy orders are aggregated in these zones, capable of preventing further price drops when approached.
✅ Historical Performance: These areas have previously prevented price declines, establishing them as reliable support zones.
✅ Market Confidence: Close clustering of green lines signifies widespread trader belief in favorable buying conditions, reinforcing support strength.
⭐⭐⭐ Usage of the Liquidity Founder Indicator ⭐⭐⭐
👍 Identifying Liquidity Zones: Pinpoints areas with dense clusters of pending buy (green) or sell (red) orders, providing initial entry points where significant buying or selling interest is concentrated.
👍 Avoiding Market Traps: Helps traders steer clear of market fluctuations or false breakouts by focusing on stable liquidity zones.
How to Use this indicator for Maximum benefit -
1) When the price approaches a cluster of resistance levels, traders should look for a candle showing rejection (e.g., a bearish reversal candle) to enter a short trade.
2)When the price approaches a cluster of support levels, traders should look for a candle showing rejection (e.g., a bullish reversal candle) to enter a long trade.
3) The identified liquidity levels offer a clear understanding of significant support and resistance areas, helping traders make more informed trading decisions.
4) Fake breakouts above resistance or below support clusters. If the price breaks above resistance and then falls back below, it can be a signal to enter a short trade vice versa if price break support cluster and back again above support cluster it can be a long trade

Pure Price Action Structures [LuxAlgo]The Pure Price Action Structures indicator is a pure price action analysis tool designed to automatically identify real-time market structures.
The indicator identifies short-term, intermediate-term, and long-term swing highs and lows, forming the foundation for real-time detection of shifts and breaks in market structure.
Its distinctive/unique feature lies in its reliance solely on price patterns, without being limited by any user-defined input, ensuring a robust and objective analysis of market dynamics.
🔶 USAGE
Market structure is a crucial aspect of understanding price action. The script automatically identifies real-time market structure, enabling traders to comprehend market trends more easily. It assists traders in recognizing both trend changes and continuations.
Market structures are constructed from three sets of swing points, short-term swings, intermediary swings, and long-term swings. Market structures associated with longer-term swing points are indicative of longer-term trends.
A market structure shift (MSS), also known as a change of character (CHoCH), is a significant event in price action analysis that may signal a potential shift in market sentiment or direction. Conversely, a break of structure (BOS) is another significant event in price action analysis that typically indicates a continuation of the prevailing trend.
However, it's important to note that while an MSS can be the first indication of a trend reversal and a BOS signifies a continuation of the prevailing trend, they do not guarantee a complete reversal or continuation of the trend.
In some cases, MSS and BOS levels may also act as liquidity zones or areas of price consolidation, rather than indicating a definitive change in market direction or continuation. Traders should approach them with caution and consider additional factors to confirm the validity of the signal before making trading decisions.
🔶 DETAILS
🔹 Market Structures
Market structures are based on the analysis of price action and aim to identify key levels and patterns in the market, where swing point detection is one of the core concepts within ICT trading methodologies and teachings.
Swing points are automatically detected solely based on market movements, without any reliance on user-defined input.
🔹 Utilizing Swing Points
Swing points are not identified in real time as they occur. While short-term swing points may be displayed with a delay of at most one bar, the identification of intermediate and long-term swing points depends entirely on market movements. Furthermore, detection is not limited by any user-defined input but relies solely on pure price action. Consequently, swing points are not typically utilized in real-time trading scenarios.
Traders often analyze historical swing points to discern market trends and pinpoint potential entry and exit points for their trades. By identifying swing highs and lows, traders can:
Recognize Trends: Swing highs and lows help traders identify the direction of the trend. Higher swing highs and higher swing lows indicate an uptrend, while lower swing highs and lower swing lows indicate a downtrend.
Identify Support and Resistance Levels: Swing highs often serve as resistance levels, known in ICT terminology as Buyside Liquidity Levels, while swing lows function as support levels, also referred to in ICT terminology as Sellside Liquidity Levels. Traders can utilize these levels to strategize entry and exit points for their trades.
Spot Reversal Patterns: Swing points can form various reversal patterns, such as double tops or bottoms, head and shoulders patterns, and triangles. Recognizing these patterns can signal potential trend reversals, allowing traders to adjust their strategies accordingly.
Set Stop Loss and Take Profit Levels: In the context of ICT teachings, swing levels represent specific price levels where a concentration of buy or sell orders is anticipated. Traders can target these liquidity levels/pools to accumulate or distribute their positions, essentially using swing points to establish stop loss and take profit levels for their trades.
Overall, swing points provide valuable information about market dynamics and can assist traders in making more informed trading decisions.
🔶 SETTINGS
🔹 Structures
Swings and Size: Toggles the visibility of the structure's highs and lows, assigns an icon corresponding to the structures, and controls the size of the icons.
Market Structures: Toggles the visibility of the market structures.
Market Structure Labels: Controls the visibility of labels that highlight the type of market structure.
Line Style and Width: Customizes the style and width of the lines representing the market structure.
Swing and Line Colors: Customizes colors for the icons representing highs and lows, and the lines and labels representing the market structure.
🔶 RELATED SCRIPTS
Market-Structures-(Intrabar).
Buyside-Sellside-Liquidity.

Uptrick: 6 Coins Market Data TableThe "Uptrick: 6 Coins Market Data Table" indicator is a sophisticated tool designed to provide a comprehensive snapshot of the market data for six major cryptocurrencies. This tool displays crucial information in a table format directly on the chart, enabling traders to make informed decisions quickly. It focuses on providing key metrics such as the Relative Volatility Index (RVI), volume, buy and sell pressure, and liquidity for each coin. The primary purpose of this indicator is to consolidate essential market data for multiple cryptocurrencies into a single, easy-to-read table. This facilitates quick analysis and comparison, helping traders assess market volatility and momentum using the Relative Volatility Index (RVI), monitor trading volume to understand market activity and interest, evaluate buy and sell pressure to gauge market sentiment, and determine liquidity to understand the ease of entering or exiting positions. The indicator is titled "Uptrick: 6 Coins Market Data Table" and is set to overlay on the chart, ensuring that it does not obstruct the view of price action. It uses a custom function to calculate buy and sell pressure based on price movements and trading volume, where buy pressure measures the volume of trades executed at prices above the low but below the high, indicating buying interest, and sell pressure measures the volume of trades executed at prices below the high but above the low, indicating selling interest. Liquidity is calculated as the product of the trading range (high - low) and the trading volume, helping in understanding the ease with which an asset can be traded without affecting its price. The RVI is calculated using the standard deviation of price changes and the exponential moving average (EMA), distinguishing between periods of increasing and decreasing volatility to provide a normalized measure of market volatility, with the RVI value ranging from 0 to 100, where higher values indicate higher volatility. The table is created with six rows and seven columns, with each row representing a cryptocurrency and each column representing a specific metric. The first row of the table includes headers for each metric: Symbol, RVI, Volume, Buy Pressure, Sell Pressure, and Liquidity. The populateTable function retrieves and calculates the necessary data for each cryptocurrency, fetching open, high, low, close prices, and volume, then calculating the RVI, buy/sell pressure, and liquidity. These values are populated into the respective cells in the table, ensuring that traders can see all relevant data at a glance. The indicator allows users to specify six different cryptocurrency symbols through input fields, enabling traders to monitor their preferred coins. The table columns include Symbol (the trading symbol of the cryptocurrency, e.g., BTCUSDT), RVI (the Relative Volatility Index displayed as a percentage, indicating the volatility level), Volume (the trading volume for the specified period, indicating the level of trading activity), Buy Pressure (a volume-based measure of buying interest), Sell Pressure (a volume-based measure of selling interest), and Liquidity (a measure of the asset’s liquidity, combining price range and volume). By bringing together multiple key metrics for six cryptocurrencies into one table, the indicator provides a centralized view of market conditions, enhancing decision-making as traders can quickly assess volatility, market sentiment, and liquidity, aiding in more informed trading decisions. The tool's customizability, allowing users to tailor the table to display their preferred cryptocurrencies, makes it versatile for different trading strategies. This detailed description outlines the functionality and purpose of the "Uptrick: 6 Coins Market Data Table" indicator, emphasizing its role in providing comprehensive and actionable market data for traders.