Example - How to create multiple level gridsExample on how to create custom grids with variable N lines/labels:
Level


[PX] Lookback LevelHey guys,
this indicator detects support and resistance level based on the number of times a level got tested in a certain range.
How does it work?
In the user input settings, you will be able to choose between two modes "Tested Level" and "Untested Level".
"Tested Level" will be detected by the number of times a certain low or high got tested in the "Lookback"-range, while fitting in the "Deviation"-range of the specific high or low. A crossing of the level is allowed. The "Untested Level" work the same way, but crossings of the level will eliminate it.
The indicator is highly dependent on which input you will use. Please play around with the settings and see how it works on different timeframes and symbols.
As always, it comes with styling options for the levels.
If some of you find it useful, please leave a like and hit the follow button :)
Happy trading,
paaax

[PX] VWAP Gap LevelHello guys,
another day, another method for detecting support and resistance level. This time it's all about the VWAP and daily gaps it might produce.
How does it work?
The indicator detects when a new daily candle begins and the VWAP makes a big move in either direction. Often it produces a gap and this is where the support or resistance level will be plotted. The idea behind it is, that those gaps get filled at some point in time. You can control how big a VWAP movement ("gap") has to be with the "VWAP Movement %" -setting. Also, you can adjust the style of the level.
If you find this indicator useful, please leave a "like" and hit that "follow" button :)
Have fun and happy trading :)))

[PX] MTF Standard Deviation LevelHello guys,
once again, I want to show you a different method for detecting support and resistance level. Today's approach is similar to the one I posted recently, but the way the level will be detected is different. I call it the multi-timeframe standard deviation level.
How does it work?
The method is similar to the way Bollinger Bands work. First, the indicator calculates the standard deviation, which can be influenced by the "Sensitivity"- and "Length"-setting.
Sensitiitiy - the higher the value, the fewer level will be shown
Length - simply the length for the standard deviation formula
Second, the detected value will be added (for resistance level) or substracted (for support level) from the current close. Once the upper or lower boundaries are crossed, a level will appear and keeps moving until the up- or downward movement finishes. Then the level will settle and stay in place.
Again, as seen in my previous indicator, you can control all the different styles and colors for the levels. The best part is, the whole thing works in a multi-timeframe fashion. In an example, you could select the "Daily" level and plot them on a 4-hour chart.
If you find this indicator useful, please leave a "like" and hit that "follow" button :)
Have fun, happy trading and once again Merry Christmas :)))

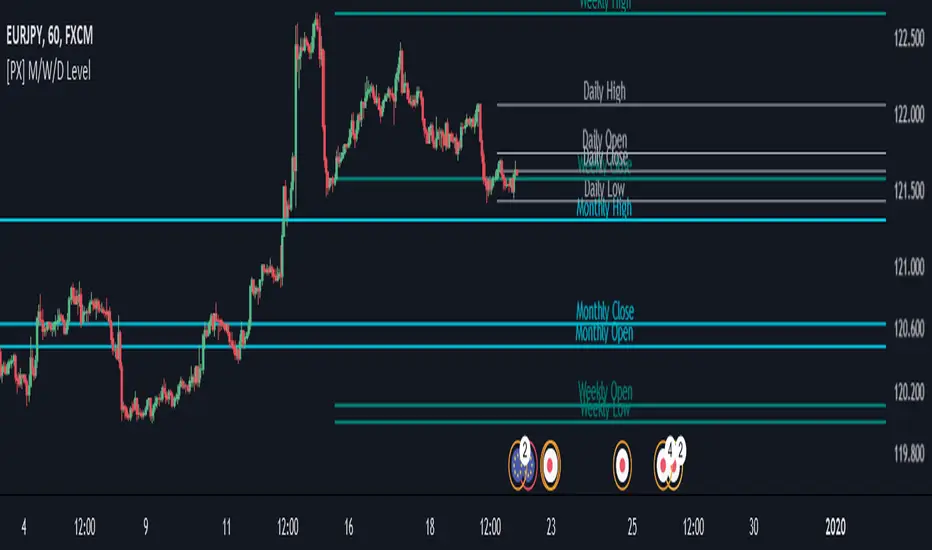
[PX] M/W/D LevelHey guys,
this script shows monthly, weekly and daily OHLC data represented as horizontal level.
I tried to make it as user-friendly as possible. Therefore, you can add different colors and styles for each level, as well as turn them on and off.
With the "Label Offset" -parameter you are in control where the label text should appear. You can shift it from left to right and vice-versa. To shift it to the left choose a negative value. To shift it to the right use a positive one.
This best setting for me personally is the "Candle Selection" -dropdown. This allows you to decide wether you want to show the previous candles OHLC-data or the current live OHLC-data.
!!CAUTION!! If you use the "Current Month/Week/Day" -selection be aware that values shown are "live"-data of the current candle. Therefore, values will change the same way your chart keeps changing on live data.
The "Previous Month/Week/Day" -selection on the other hand is historical data and therefore only changes once we reached a new month/week/day.
If you like my work, consider leaving a like :)
Happy trading!
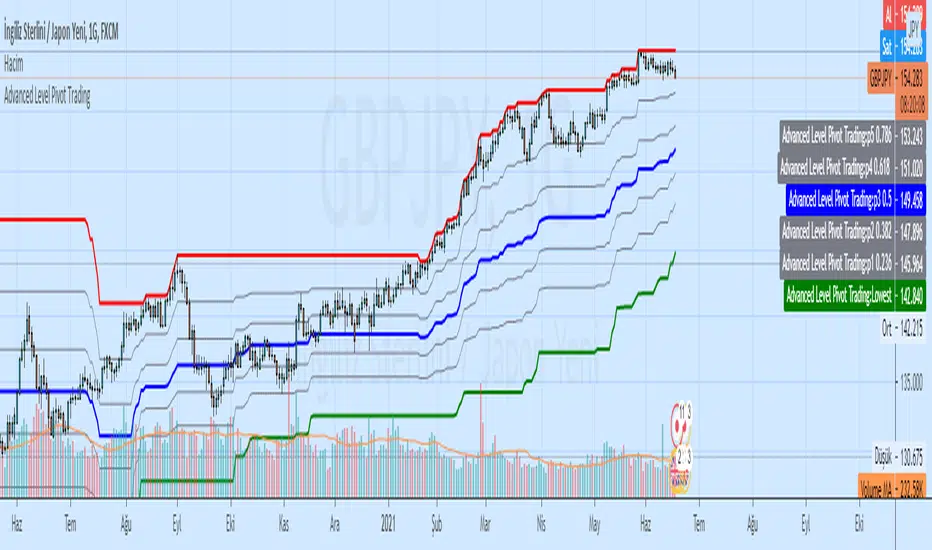
Advanced Level Pivot TradingAdvanced Level Pivot Trading
Highest Lowest Channel and Level Pivot (Fibonacci)
Orderblocks [CosmonautC]Orderblock script, automatically finds orderblocks and then marks them out.
There are 3 inputs:
length == lookback length
Sensitivity == How small/big moves are needed to plot a new orderblock
levels == How many pairs of Orderblock levels to plot. 1 pair = 1 orderblock from a down move and 1 orderblock from an up move
I hope you enjoy it and hopefully can make some better decisions with it :D
#freeα

Auto Fibonacci Retracement Levels A Fibonacci retracement is a popular tool that traders can use to identify support and resistance levels, and place stop-loss orders or target prices.
The indicator connects any two points that are relevant, a high and low point.
The percentage levels provided are areas where the price could stall or reverse.
Levels should not be relied on exclusively. For example, it is dangerous to assume the price will reverse after hitting a specific Fibonacci level. It may, but it also may not.
Fibonacci retracement levels are most frequently used to provide potential areas of interest. If a trader wants to buy, they watch for the price to stall at a Fibonacci level and then bounce off that level before buying.
The most commonly used ratios include 23.6%, 38.2%, 50%, 61.8% and 78.6%. These represent how much of a prior move the price has corrected or retraced.

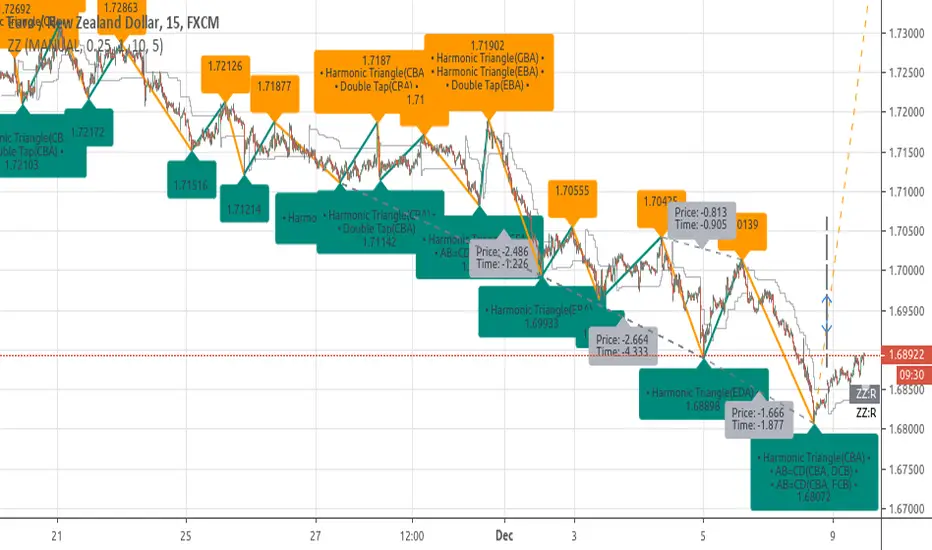
[RS]ZigZag Percent Reversal - Forecast - patterns - labels description:
• Zig Zag indicator plots points on the chart whenever prices reverse
by a percentage greater than a pre-chosen variable.
• Forecasts area based on zigzag statistics.
• Displays labels with detected patterns.
• Displays slope information rate of price, time diferentials and angle(experimental)
Year Open Price LevelAn utility tool that plots a dynamic level using the opening price of each year on the chart.
Allows to highlight the change in the price relative to this level.

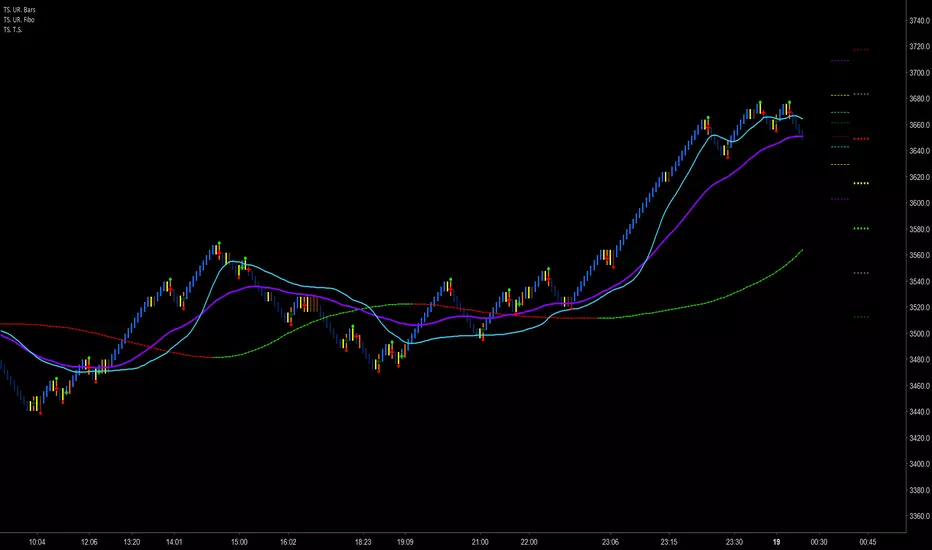
Trader Set - Trailing StopThis is the last tool for my methodology. It provides additional levels of support / resistance that you can use for trailing stop. Like every single tool in this toolbox and methodology, the formula being used is unique and totally original and you can't find it any where else.
Please don't contact me for getting access to these tools, they are only available for my students. Right now, the English version of the website and learning material is under development and soon, when they are ready I'll post a comment under every single script related to this methodology for those who are interested in participating for the course.
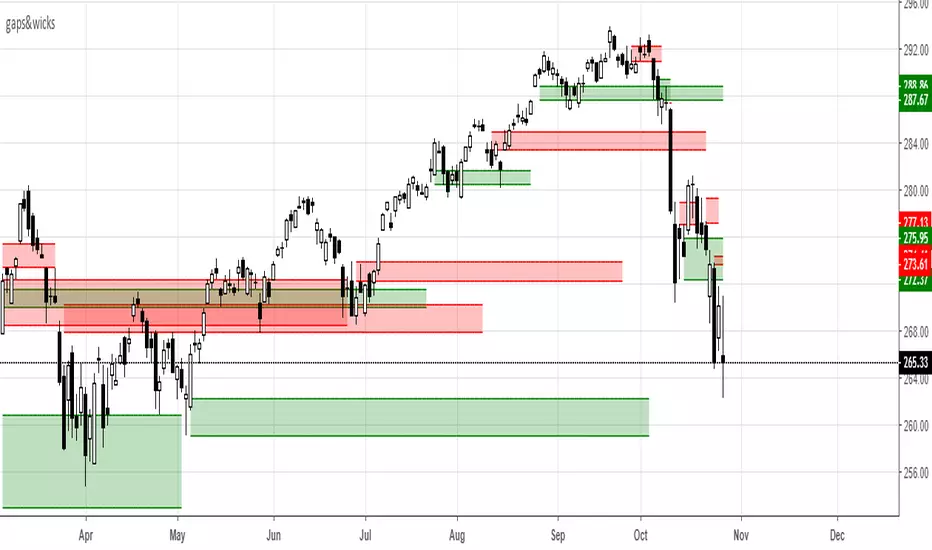
gaps&wicksA means for tracking price ranges for gap up/down and longer buying/selling tails. This may have some value for buying/selling opportunities based on the relative significance of the range. The look back period is adjustable and works for any time frame. If you have any success using it leave some feedback.
-Squam
Support Levels | Line Volume [dimon1ua]Accurate levels of support - resistance, for accurate entry at turning points.
LCS/HCR Support and Resistance multi timeframesThis study draws LCS and HCR lines for multi time frames and helps to find important support and resistance levels on lower timeframes.
Levels are based on close price and not low and high.

DepthHouse - Envelope OscillatorDepthHouse Envelope Oscillator is designed to show dynamic support and resistance, along with possible over extension.
The indicator has two main functions. The Standard function (top) and the Shifted function (bottom).
The Standard Function:
The oscillators outermost edges represent dynamic support and resistance. These points can often represent excellent buy and sell opportunities. Especially in a ranging market.
Anything below or above these lines often represent a possible breakout or overexertion in either direction.
The Shift Function:
This works very similar to the standard function, however this actually offsets the calculations x to the right. This can be an excellent tool for breakout traders. In many breakouts, the horizontal lines actually shift from resistance to support, and visa versa depending on trend direction.
With this function enabled, the user can designate the position of the horizontal lines, which adjusts the buy sell signals in the middle as well.
Signals Beta:
Both functions give possible buy and sell signals shown by the circles in the middle. The strength of the signal is shown by the circle size. The larger the circle, the stronger the signal.
This feature is in beta testing is not advised to trade off of.
How to get:
As you can see this is an invite only script. In the coming months this indicator, along with many others will become pay to use only. (website on my profile page)
However all my indicators will be FREE until AT LEAST May of 2018 . So please try them out!
To take advantage of this FREE trial
1. Subscribe to my YouTube channel. I have many more videos to come! Maybe even leave a comment of what you would like to see next!
www.youtube.com
2. Comment on this indicator post! Maybe even give me a follow :D
I hope you all enjoy!!

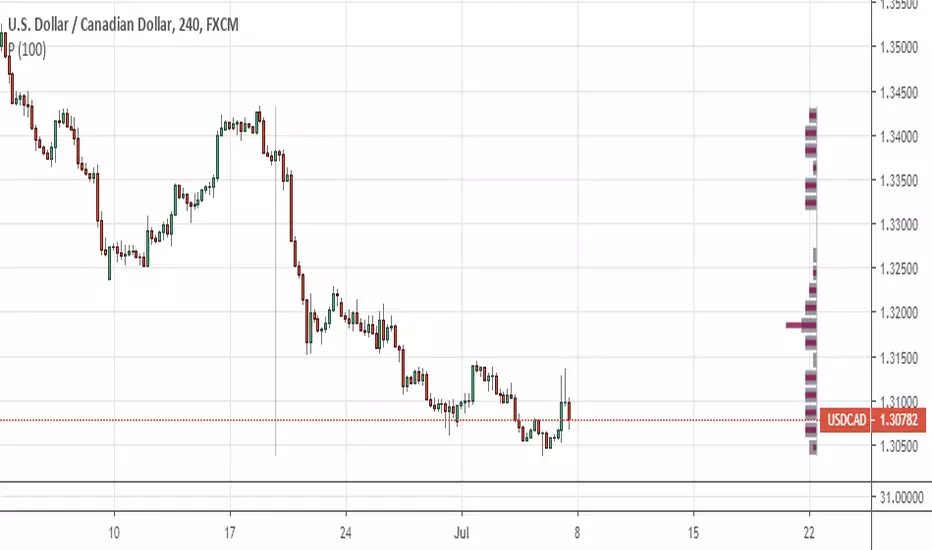
Arbitrage Level (Advance)This version of level is designed for stocks that have not existed long enough to qualify for our standard arbitrage level formula.
It also can be used on shorter time periods to show entries for day trades or swing trades.
Enjoy


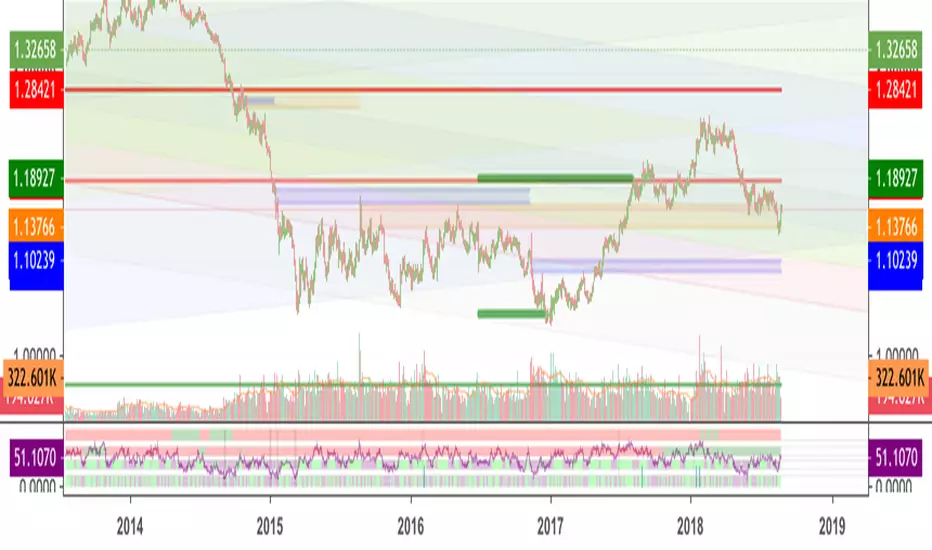
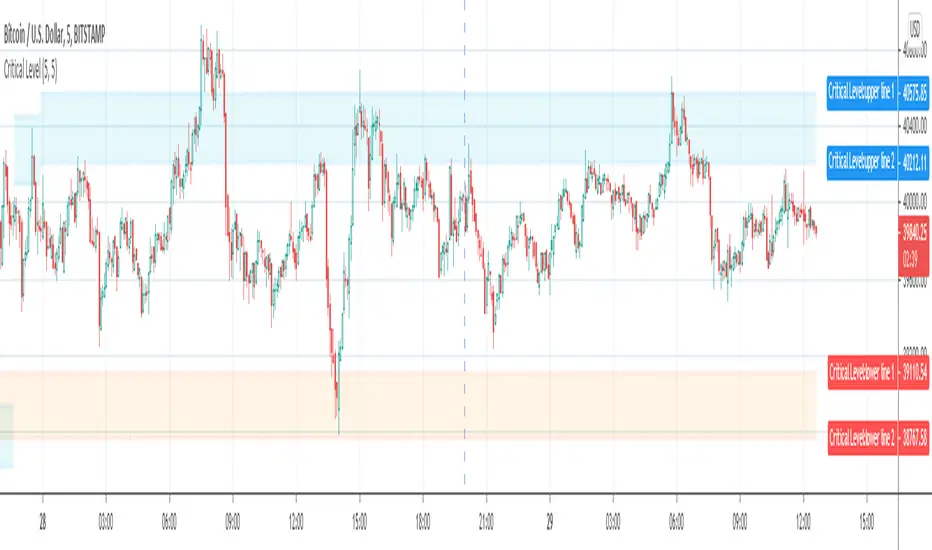
Critical Support & Resistance Level (supply & demand zone)Support & Resistance Level and Supply & Demand Zone are very common and popular jargon in technical analysis.
What is the difference between Support & Resistance Level and Supply & Demand Zone?
In my opinion, Support & Resistance Level is the value of price that tested couple times and hard to break. The zone is formed by two adjacent levels where price may oscillate between those two levels.
Imagine the levels as horizontal lines, and the zones are areas between two horizontal lines.
Why are they important?
In a nutshell, they indicate where the price direction may reverse so you can act accordingly.
There are a couple methods to draw the Support & Resistance Level and Supply & Demand Zone, In most case, people will use swing high or low, or pivot points as the level. But there are too many of them, and not all pivot points will become Support & Resistance Level.
Some of the support or resistance level is hard to break, but after the price break through that level, resistance will become support and vice versa, I define it as Critical Level .
If you draw a critical support or resistance level from the current bar and move backward to where it started, you will notice that some levels are formed by the pivot points from hundreds of bars ago. It's impossible to discover the Critical Levels if you don't have enough bars loaded on chart.
The purpose of this indicator is to plot critical support and resistance level automatically on chart.
It will work on all market, Stock, Forex and Futures. It also works on all timeframes.
Inputs:
The Strength inputs control the intensity of Support & Resistance Level.
The Alert input is the switch of alert function.
By enable Enhanced mode, the indicator will be more critical.
Check Showline input to plot level lines on chart, otherwise, it will plot zones only.

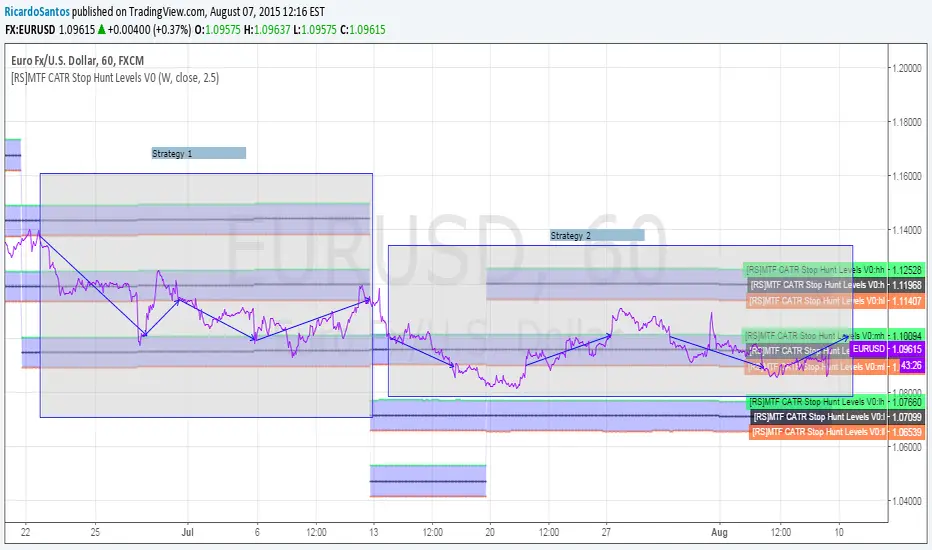
[RS]MTF CATR Stop Hunt Levels V0EXPERIMENTAL:
Adaptation from stop hunt levels:
Uses timeframe and atr to set ranges.
[RS]Stop Hunt Levels V0Request for SpreadEagle71:
Stop Hunt Levels adapted from:
www.investopedia.com
configuration:
smoothing: smooths/average the source higher value will remove spikes but delay the speed of adjusting
source: source to compare crossing lines.
Rounding Value: value space of the grid.
Entry Window Size: Space for entrys.
