1st Gray Cross Signals ━ Histogram SQZMOM [whvntr][LazyBear]This is the Histogram Version of one of my other indicators named: SQZ Momentum + 1st Gray Cross Signals (with arrows) Which is a modification of "Squeeze Momentum Indicator" by user: "LazyBear". In that indicator of his he described, and suggested, the use of his gray cross signals to find points of interest for trading based on the direction of momentum when the first gray cross appears... I have programmed these points, and highlighted them, for ease of use. The 1st gray cross strategy, he said , is from John F. Carter's book, Chapter 11, "Mastering the Trade".
Here we have the Histogram version, with background highlights only, and nothing on the chart, in true SQZ Momentum style.
Disclaimer: using this indicator, or any indicator anywhere, involves risk when trading and isn't a guarantee of 100% accurate results.
Canais de Keltner (KC)

Channel Based Zigzag [HeWhoMustNotBeNamed]🎲 Concept
Zigzag is built based on the price and number of offset bars. But, in this experiment, we build zigzag based on different bands such as Bollinger Band, Keltner Channel and Donchian Channel. The process is simple:
🎯 Derive bands based on input parameters
🎯 High of a bar is considered as pivot high only if the high price is above or equal to upper band.
🎯 Similarly low of a bar is considered as pivot low only if low price is below or equal to lower band.
🎯 Adding the pivot high/low follows same logic as that of regular zigzag where pivot high is always followed by pivot low and vice versa.
🎯 If the new pivot added is of same direction as that of last pivot, then both pivots are compared with each other and only the extreme one is kept. (Highest in case of pivot high and lowest in case of pivot low)
🎯 If a bar has both pivot high and pivot low - pivot with same direction as previous pivot is added to the list first before adding the pivot with opposite direction.
🎲 Use Cases
Can be used for pattern recognition algorithms instead of standard zigzag. This will help derive patterns which are relative to bands and channels.
Example: John Bollinger explains how to manually scan double tap using Bollinger Bands in this video: www.youtube.com This modified zigzag base can be used to achieve the same using algorithmic means.
🎲 Settings
Few simple configurations which will let you select the band properties. Notice that there is no zigzag length here. All the calculations depend on the bands.
With bands display, indicator looks something like this
Note that pivots do not always represent highest/lowest prices. They represent highest/lowest price relative to bands.
As mentioned many times, application of zigzag is not for buying at lower price and selling at higher price. It is mainly used for pattern recognition either manually or via algorithms. Lets build new Harmonic, Chart patterns, Trend Lines using the new zigzag?

Wunder Keltner botWunder Keltner bot
1. Wunder Keltner bot is based on the breakout of the Keltner channel. For calculation, 2 channels are used, one for long trades, and the other for short trades. The division into 2 channels is used for more accurate entry calculations depending on trend directions.
2. The ADX indicator is used to filter signals and determine the trend strength. ADX determines the strength of the trend and confirms the entry into the strategy if the value is greater than the level indicated in the settings.
3. There are 3 ways to calculate Stop Loss and Take Profit. You can choose one of them:
Classic Stop Loss and Take Profit in a fixed percentage
ATR Stop Loss
Keltner. Stop Loss, which is set on the opposite Keltner’s Channel Band from Keltner breakout.
4. ATR and Keltner use Risk Reward (R:R) to calculate Take Profit. The script calculates Risk Reward based on the determined Stop loss level and uses the ration to calculate Take Profit.
5. A function for calculating risk on the portfolio (your deposit) has been added to the script. When this option is enabled, you get a calculation of the entry amount in dollars relative to your Stop Loss. In the settings, you can select the risk percentage on your portfolio. The loss will be calculated from the amount that will be displayed on the chart.
For example. Deposit - $1000, you set the risk to 1%. SL 5%. Entry volume will be $200. The loss at SL will be $10.10$ this is your 1% risk or 1% of the deposit.
Important! The risk per trade must be less than the Stop Loss value. If the risk is greater than SL, then you should use leverage.
The amount of funds entering the trade is calculated in dollars. This option was created if you want to send the dollar amount from Tradingview to the exchange. However, putting your volume in dollars you get the incorrect net profit and drawdown indication in the backtest results, as TradingView calculates the backtest volume in contracts.
To display the correct net profit and drawdown values in Tradingview Backtest results, use the ”Volume in contract” option.

Channels Strategy [JoseMetal]============
ENGLISH
============
- Description:
This strategy is based on Bollinger Bands / Keltner Channel price "rebounds" (the idea of price bouncing from one band to another).
The strategy has several customizable options, which allows you to refine the strategy for your asset and timeframe.
You can customize settings for ALL indicators, Bollinger Bands (period and standard deviation), Keltner Channel (period and ATR multiplier) and ATR (period).
- AVAILABLE INDICATORS:
You can pick Bollinger Bands or Keltner Channels for the strategy, the chosen indicator will be plotted as well.
- CUSTOM CONDITIONS TO ENTER A POSITION:
1. Price breaks the band (low below lower band for LONG or high above higher band for SHORT).
2. Same as 1 but THEN (next candle) price closes INSIDE the bands.
3. Price breaks the band AND CLOSES OUT of the band (lower band for LONG and higher band for SHORT).
4. Same as 3 but THEN (next candle) price closes INSIDE the bands.
- STOP LOSS OPTIONS:
1. Previous wick (low of previous candle if LONG and high or previous candle if SHORT).
2. Extended band, you can customize settings for a second indicator with larger values to use it as STOP LOSS, for example, Bollinger Bands with 2 standard deviations to open positions and 3 for STOP LOSS.
3. ATR: you can pick average true ratio from a source (like closing price) with a multiplier to calculate STOP LOSS.
- TAKE PROFIT OPTIONS:
1. Opposite band (top band for LONGs, bottom band for SHORTs).
2. Moving average: Bollinger Bands simple moving average or Keltner Channel exponential moving average .
3. ATR: you can pick average true ratio from a source (like closing price) with a multiplier to calculate TAKE PROFIT.
- OTHER OPTIONS:
You can pick to trade only LONGs, only SHORTs, both or none (just indicator).
You can enable DYNAMIC TAKE PROFIT, which updates TAKE PROFIT on each candle, for example, if you pick "opposite band" as TAKE PROFIT, it'll update the TAKE PROFIT based on that, on every single new candle.
- Visual:
Bands shown will depend on the chosen indicator and it's settings.
ATR is only printed if used as STOP LOSS and/or TAKE PROFIT.
- Recommendations:
Recommended on DAILY timeframe , it works better with Keltner Channels rather than Bollinger Bands .
- Customization:
As you can see, almost everything is customizable, for colors and plotting styles check the "Style" tab.
Enjoy!
============
ESPAÑOL
============
- Descripción:
Esta estrategia se basa en los "rebotes" de precios en las Bandas de Bollinger / Canal de Keltner (la idea de que el precio rebote de una banda a otra).
La estrategia tiene varias opciones personalizables, lo que le permite refinar la estrategia para su activo y temporalidad favoritas.
Puedes personalizar la configuración de TODOS los indicadores, Bandas de Bollinger (periodo y desviación estándar), Canal de Keltner (periodo y multiplicador ATR) y ATR (periodo).
- INDICADORES DISPONIBLES:
Puedes elegir las Bandas de Bollinger o los Canales de Keltner para la estrategia, el indicador elegido será mostrado en pantalla.
- CONDICIONES PERSONALIZADAS PARA ENTRAR EN UNA POSICIÓN:
1. El precio rompe la banda (mínimo por debajo de la banda inferior para LONG o máximo por encima de la banda superior para SHORT).
2. Lo mismo que en el punto 1 pero ADEMÁS (en la siguiente vela) el precio cierra DENTRO de las bandas.
3. El precio rompe la banda Y CIERRA FUERA de la banda (banda inferior para LONG y banda superior para SHORT).
4. Igual que el 3 pero ADEMÁS (siguiente vela) el precio cierra DENTRO de las bandas.
- OPCIONES DE STOP LOSS:
1. Mecha anterior (mínimo de la vela anterior si es LONGy máximo de la vela anterior si es SHORT).
2. Banda extendida, puedes personalizar la configuración de un segundo indicador con valores más extensos para utilizarlo como STOP LOSS, por ejemplo, Bandas de Bollinger con 2 desviaciones estándar para abrir posiciones y 3 para STOP LOSS.
3. ATR: puedes elegir el average true ratio de una fuente (como el precio de cierre) con un multiplicador para calcular el STOP LOSS.
- OPCIONES DE TAKE PROFIT:
1. Banda opuesta (banda superior para LONGs, banda inferior para SHORTs).
2. Media móvil: media móvil simple de las Bandas de Bollinger o media móvil exponencial del Canal de Keltner .
3. ATR: se puede escoger el average true ratio de una fuente (como el precio de cierre) con un multiplicador para calcular el TAKE PROFIT.
- OTRAS OPCIONES:
Puedes elegir operar sólo con LONGs, sólo con SHORTs, ambos o ninguno (sólo el indicador).
Puedes activar el TAKE PROFIT DINÁMICO, que actualiza el TAKE PROFIT en cada vela, por ejemplo, si eliges "banda opuesta" como TAKE PROFIT, actualizará el TAKE PROFIT basado en eso, en cada nueva vela.
- Visual:
Las bandas mostradas dependerán del indicador elegido y de su configuración.
El ATR sólo se muestra si se utiliza como STOP LOSS y/o TAKE PROFIT.
- Recomendaciones:
Recomendada para temporalidad de DIARIO, funciona mejor con los Canales de Keltner que con las Bandas de Bollinger .
- Personalización:
Como puedes ver, casi todo es personalizable, para los colores y estilos de dibujo comprueba la pestaña "Estilo".
¡Que lo disfrutes!

True Range ScoreTrue Range Score:
This study transforms the price similar to how z-score works. Instead of using the standard deviation to divide the difference of the source and the mean to determine the sources deviation from the mean we use the true range. This results in a score that directly relates to what multiplier you would be using with the Keltner Channel. This is useful for many applications.
One is the fact that it shows you the momentum of the price and how strong the price movement is. This is also a great metric of volatility. With this you can make a smart Keltner channel by multiplying the mean by the average true range 75th percentile of this score. I in fact do this in my automatic Keltner channel script. I hope this script is useful for you. Thank you for checking this out.
(Source - Mean)/True Range instead of (Source - Mean)/Standard Deviation
Auto Keltner ChannelsThis version of Keltner Channels take measures the average volatility. By taking the 75th percentile of the average absolute value of the difference between the Source and the Mean divided by the True Range and using that as our multiplier for our Keltner Channels we can have a statistically safe trading zone. You notice that its dynamic, this is because it take into account the real volatility levels of a window and uses that to determine an appropriate multiplier. As always I hope you enjoy this release.

Probability Cloud BASIC [@AndorraInvestor]🔮☁️
This is the BASIC version of the PROBABILITY CLOUD indicator.
It is an evolution beyond traditional standard deviation probabilistic indicators only using bands or channels.
The new PROBABILITY CLOUD graphic representation with customizable transparent layers is based on -2 / +2 standard deviation calculated using 20 fixed predetermined time periods, and is available in several calculation MODES:
SMA , EMA , WMA , VWMA , VWMA & VAWMA
The indicator is designed to let the trader visually understand the probabilistic depth of past, present and future price action, and its evolution over time.
Looking forward to your comments and feedback to guide me on future updates!
🙏 Big THANKS @Electrified for letting me use his work on Deviation Bands/ as a starting point for my first script.

DB KCBB%D Wave SignalsDB KCBB%D Wave Signals
What does the indicator do?
This indicator is a version of my DB KCBB%D indicator updated with signal detection. It results from weeks of analysis of the KCBB%D waves for patterns. I'm releasing it publicly to help those who like the KCBB%D indicator but desire a version with signals built into it.
The indicator plots the percent difference between the low and high prices against a combined Kelpler Channel Bollinger Bands for the current timeframe. The low percent difference and the high percent difference each have their own waves plotted. A mirror mode default allows both waves to be visualized in a mirrored plot that clearly shows when outer bands are present and when they swap. Each percent difference band is displayed with a 1 bar lookback to visualize local tops/bottoms.
The overall trend is displayed using two sets of green/red colors on the percent difference waves so that each wave is recognizable, but the overall price trend is visible. A fast 3 SMA is taken of each percent difference wave to obtain the overall trend and then averaged together. The trend is then calculated based on direction from the previous bar period.
How should this indicator be used?
By default, the indicator will display in a mirror mode which will display both the low and high percent change waves mirrored to allow for the most pattern recognition possible. You will notice the percent difference waves swap from inner to outer, showing the overall market direction for that timeframe. When each percent difference wave interacts with the zero line, it indicates either buys or sells opportunities depending on which band is on the inside. When the inner wave crosses zero, special attention should be paid to the outer wave to know if it's a significant move. Likewise, when the outer wave peaks, it can indicate buy or sell opportunities depending on which wave is on the outside.
A zero line and other lines are displayed from the highest of the high percent difference wave over a long period of time. The lines can measure movement and possible oversold/overbought locations or large volatility . You can also use the lines for crossing points for either wave as alerts to know when to buy or sell zones are happening.
When individual percent difference waves are designed to be reviewed without mirroring, the mirror checkbox can be unchecked in the settings. Doing so will display both the high and low percent difference waves separately. Using this display, you can more cleanly review how each wave interacts with various line levels.
For those who desire to only have half of the mirror or one set of waves inverted against each other, check the "mirrored" and the "mirrored flipped" checkboxes in the settings. Doing so will display the top half of the mirror indicator, which is the low percent difference wave with the high percent difference wave inverted.
The indicator will also change the background color of its own pane to indicate possible buy/sell periods (work in progress).
Does the indicator include any alerts?
Yes, they are a work in progress but starting out with this release, we have:
NOTE: This is an initial release version of this indicator. Please do not use these alerts with bots yet, as they will repaint in real-time.
NOTE: A later release may happen that will delay firing the events until 1/2 of the current bar time has passed.
NOTE: As with any indicator, watch your upper timeframe waves first before zooming into lower.
DB KCBB%D Buy Signal
DB KCBB%D Buy Warning Signal
DB KCBB%D Sell Signal
DB KCBB%D Sell Warning Signal
DB KCBB%D Death Cross Sell Signal
DB KCBB%D Trend Up Alert
DB KCBB%D Trend Down Alert
Use at your own risk and do your own diligence.
Enjoy!

The Killer Whale - Multiple Keltner Channels by JoeFinally, after centuries of pain and suffering, the good townsfolk of TradingView have been given a single Keltner Channel indicator that will grant them FREE access to MORE THAN ONE Keltner Channel.
With "The Killer Whale" indicator, Joe has once again saved all the peasants—those who cannot add 10,000 indicators to our charts—from the dirty tyrants who arrogantly rule over us with disdain.
And, now, not only can you have more than one Keltner Channel with this single indicator, but you can have UP TO FOUR! For FREE!
Yes, I know, it seems too good to be true. But, install and enjoy your newfound freedom!
Options:
Keltner Channel length and source
Multiplication Factor for each channel
SMA or EMA
ATR Length
Border and fill colors for each channel
Now, go, therefore, and Keltner to your heart's content. May The Killer Whale be with your charts forever!

SSL + Wave Trend StrategyStrategy incorporates the following features:
Risk management:
Configurable X% loss per stop loss
Configurable R:R ratio
Trade entry:
Based on strategy conditions below
Trade exit:
Based on strategy conditions below
Backtesting:
Configurable backtesting range by date
Trade drawings:
Each entry condition indicator can be turned on and off
TP/SL boxes drawn for all trades. Can be turned on and off
Trade exit information labels. Can be turned on and off
NOTE: Trade drawings will only be applicable when using overlay strategies
Alerting:
Alerts on LONG and SHORT trade entries
Debugging:
Includes section with useful debugging techniques
Strategy conditions
Trade entry:
LONG
C1: SSL Hybrid baseline is BLUE
C2: SSL Channel crosses up (green above red)
C3: Wave Trend crosses up (represented by pink candle body)
C4: Entry candle height is not greater than configured threshold
C5: Entry candle is inside Keltner Channel (wicks or body depending on configuration)
C6: Take Profit target does not touch EMA (represents resistance)
SHORT
C1: SSL Hybrid baseline is RED
C2: SSL Channel crosses down (red above green)
C3: Wave Trend crosses down (represented by orange candle body)
C4: Entry candle height is not greater than configured threshold
C5: Entry candle is inside Keltner Channel (wicks or body depending on configuration)
C6: Take Profit target does not touch EMA (represents support)
Trade exit:
Stop Loss: Size configurable with NNFX ATR multiplier
Take Profit: Calculated from Stop Loss using R:R ratio
Credits
Strategy is based on the YouTube video "This Unique Strategy Made 47% Profit in 2.5 Months " by TradeSmart.
It combines the following indicators to determine trade entry/exit conditions:
Wave Trend: Indicator: WaveTrend Oscillator by @LazyBear
SSL Channel: SSL channel by @ErwinBeckers
SSL Hybrid: SSL Hybrid by @Mihkel00
Keltner Channels: Keltner Channels Bands by @ceyhun
Candle Height: Candle Height in Percentage - Columns by @FreeReveller
NNFX ATR: NNFX ATR by @sueun123

DB KCBB%D WavesDB KCBB%D Waves
What does the indicator do?
The indicator plots the percent difference between the low and high prices against a combined Kelpler Channel Bollinger Bands for the current timeframe. The low percent difference and the high percent difference each have their own waves plotted. A mirror mode default allows both waves to be visualized in a mirrored plot that clearly shows when outer bands are present and when they swap. Each percent difference band is displayed with a 1 bar lookback to visualize local tops/bottoms.
The overall trend is displayed using two sets of green/red colors on the percent difference waves so that each wave is recognizable, but the overall price trend is visible. A fast 3 SMA is taken of each percent difference wave to obtain the overall trend and then averaged together. The trend is then calculated based on direction from the previous bar period.
How should this indicator be used?
By default, the indicator will display in a mirror mode which will display both the low and high percent change waves mirrored to allow for the most pattern recognition possible. You will notice the percent difference waves swap from inner to outer, showing the overall market direction for that timeframe. When each percent difference wave interacts with the zero line, it indicates either buys or sells opportunities depending on which band is on the inside. When the inner wave crosses zero, special attention should be paid to the outer wave to know if it's a significant move. Likewise, when the outer wave peaks, it can indicate buy or sell opportunities depending on which wave is on the outside.
A zero line and other lines are displayed from the highest of the high percent difference wave over a long period of time. The lines can measure movement and possible oversold/overbought locations or large volatility. You can also use the lines for crossing points for either wave as alerts to know when to buy or sell zones are happening.
When individual percent difference waves are designed to be reviewed without mirroring, the mirror checkbox can be unchecked in the settings. Doing so will display both the high and low percent difference waves separately. Using this display, you can more cleanly review how each wave interacts with various line levels.
For those who desire to only have half of the mirror or one set of waves inverted against each other, check the "mirrored" and the "mirrored flipped" checkboxes in the settings. Doing so will display the top half of the mirror indicator, which is the low percent difference wave with the high percent difference wave inverted.
The indicator will also change the background color of its own pane to indicate possible buy/sell periods (work in progress).
Does the indicator include any alerts?
Yes, they are a work in progress but starting out with this release, we have:
NOTE: This is an initial release version of this indicator. Please do not use these alerts with bots yet, as they will repaint in real-time.
NOTE: A later release may happen that will delay firing the events until 1/2 of the current bar time has passed.
NOTE: As with any indicator watch your upper timeframe waves first before zooming into lower.
DB KCBB%D Buy Zone Alert
DB KCBB%D MEDIUM Buy Alert
DB KCBB%D STRONG Buy Alert
DB KCBB%D Sell Alert
DB KCBB%D STRONG Sell Alert
DB KCBB%D Trend Up Alert
DB KCBB%D Trend Down Alert
Use at your own risk and do your own diligence.
Enjoy!

Squeeze Momentum Indicator [LazyBear] added Alerting + webhookA modified version of Squeeze Momentum Indicator visualizing on Price Chart.
author: @LazyBear, modified by @KivancOzbilgic, and by @dgtrd
I took in all of the information as the script below is based on the V2 Script that @LazyBear posted and then added Alerting based on the math and the conditions that @dgtrd added.
Per the description here:
The Squeeze Indicator measures the relationship between Bollinger Bands and Keltner's Channels to help identify consolidations and signal when prices are likely to break out (whether up or down).
The Squeeze Indicator finds sections of the Bollinger Bands which fall inside the Keltner's Channels, and in this case, the market is said to be in a squeeze (indicator turns off, displayed with grey diamond shapes in this study).
When the volatility increases, so does the distance between the bands. Conversely, when the volatility declines, the distance also decreases, and in such cases, the squeeze is said to be released (indicator turns on, displayed with triangle up or triangle down shapes)
Taking the above information and what was in the script was able to base the alert conditions:
So when the condition:
Squeeze On or No Squeeze = In Squeeze
Squeeze Off = Squeeze Release Long or Squeeze Release Long based off conditions.
There are 2 separate alert Types.
1. App, Pop-up, eMail, play sound and Send email to SMS
2. It Is dedicated to Webhook for your various applications.
Alerting Options
i.imgur.com
App Notification
i.imgur.com
i.imgur.com
Webhook test into Discord
i.imgur.com
DB MACD TTM SQZ HistogramDB MACD TTM SQZ Histogram
What does the indicator do?
The DB MACD TTM SQZ Histogram combines the MACD with the TTM Squeeze into a single histogram. Traders may use the "Multiplier" settings to weight MACD vs. TTM SQZ. The MACD will default have a multiplier value of 2 vs. 1 for TTM SQZ. The reasoning behind the default 2:1 multiplier is to allow the faster MACD to have a strong hand in the histogram. In addition to the histogram, the indicator will display a red dot when a BB/KC squeeze (TTM SQZ) is present. The TTM SQZ uses a length of 20, BB m-factor of 2, and KC m-factor of 1.5 to match the "Mastering the Trade" squeeze. The histogram is calculated by taking the MACD histogram and the TTM SQZ histogram and first standardizing them into reasonable decimal percentages. Once standardized, each decimal percentage is then multiplied by the individual multiplier. Finally, the two values are summed into the combined histogram value. The end result is a standardized weighted combination of the MACD (faster) with the TTM SQZ (slower) histogram.
How should this indicator be used?
The DB ETHUSD MMA Indicator should be combined with other indicators as a secondary visual indicator or market buy/sell periods. The indicator is not meant to replace the MACD or TTM SQZ. Analyzing the MACD and TTM SQZ wave patterns individually is extremely useful. The indicator allows the trader to quickly obtain a combined analysis of the two indicators with a predetermined preference (multiplier) towards one vs. the other.
In other words, the indicator is very helpful when the MACD and TTM SQZ are conflicting in providing market direction. Those familiar with MACD or TTM SQZ histograms recognize there are four periods in the full cycle; growing below zero line, growing above zero line, falling above zero line, and falling below zero line. Typically a trader would look for buying opportunities when the cycle is showing "growing below zero line." and sell when the price reaches the "falling above zero line." The qualification of the wave pattern of the four periods must be reviewed before trades. If the wave is choppy, then alternative timeframes should be reviewed. Think of wake on a lake or ocean waves. Choppy is unpredictable but smooth waves are more predictable.
The red dot on the zero line would indicate that a squeeze is present in the current timeframe, building pressure. The red dot does not indicate a pressure release of up or down. Instead, it simply means the spring is being compressed. When a squeeze is present, pressure builds and may release in either direction. You can combine this indicator with BB and KC on the plot with BB (20 len, 2 m-factor) and KC (20 len, 1.5 m-factor). You can review the BB/KC outer bands to see possible breakout resistance or support when a squeeze is on. If the price is outside the BB/KC outer banks, move to a higher timeframe.
Does the indicator include any alerts?
Not Yet. Perhaps in the Future (If Desired)
Enjoy!

One-Sided Gaussian Filter w/ Channels [Loxx]One-Sided Gaussian Filter w/ Channels is a Gaussian Moving Average that is calculated using a Fibonacci weighting function. Keltner channels have been added to show zones of exhaustion. A better name would be "Half Gaussian bell weighted" or "Half normal distribution weighted" indicator, since the weights for calculation of the average (similar to linear weighted average) are taken from a normal distribution curve like function--but only the half of the curve is used for calculation.
Information of the Gaussian distribution can be found here : en.wikipedia.org and once you take a look at the standard normal distribution curve, it will be much clearer what is exactly done in this indicator.
After the Gaussian Filter is applied to the source input, an Ehlers' 2-Pole Super Smoother is applied to reduce noise without significant lag.
Included:
Bar coloring
Signals
Alerts
Loxx's Expanded Source Types

STD-Adaptive T3 Channel w/ Ehlers Swiss Army Knife Mod. [Loxx]STD-Adaptive T3 Channel w/ Ehlers Swiss Army Knife Mod. is an adaptive T3 indicator using standard deviation adaptivity and Ehlers Swiss Army Knife indicator to adjust the alpha value of the T3 calculation. This helps identify trends and reduce noise. In addition. I've included a Keltner Channel to show reversal/exhaustion zones.
What is the Swiss Army Knife Indicator?
John Ehlers explains the calculation here: www.mesasoftware.com
What is the T3 moving average?
Better Moving Averages Tim Tillson
November 1, 1998
Tim Tillson is a software project manager at Hewlett-Packard, with degrees in Mathematics and Computer Science. He has privately traded options and equities for 15 years.
Introduction
"Digital filtering includes the process of smoothing, predicting, differentiating, integrating, separation of signals, and removal of noise from a signal. Thus many people who do such things are actually using digital filters without realizing that they are; being unacquainted with the theory, they neither understand what they have done nor the possibilities of what they might have done."
This quote from R. W. Hamming applies to the vast majority of indicators in technical analysis . Moving averages, be they simple, weighted, or exponential, are lowpass filters; low frequency components in the signal pass through with little attenuation, while high frequencies are severely reduced.
"Oscillator" type indicators (such as MACD , Momentum, Relative Strength Index ) are another type of digital filter called a differentiator.
Tushar Chande has observed that many popular oscillators are highly correlated, which is sensible because they are trying to measure the rate of change of the underlying time series, i.e., are trying to be the first and second derivatives we all learned about in Calculus.
We use moving averages (lowpass filters) in technical analysis to remove the random noise from a time series, to discern the underlying trend or to determine prices at which we will take action. A perfect moving average would have two attributes:
It would be smooth, not sensitive to random noise in the underlying time series. Another way of saying this is that its derivative would not spuriously alternate between positive and negative values.
It would not lag behind the time series it is computed from. Lag, of course, produces late buy or sell signals that kill profits.
The only way one can compute a perfect moving average is to have knowledge of the future, and if we had that, we would buy one lottery ticket a week rather than trade!
Having said this, we can still improve on the conventional simple, weighted, or exponential moving averages. Here's how:
Two Interesting Moving Averages
We will examine two benchmark moving averages based on Linear Regression analysis.
In both cases, a Linear Regression line of length n is fitted to price data.
I call the first moving average ILRS, which stands for Integral of Linear Regression Slope. One simply integrates the slope of a linear regression line as it is successively fitted in a moving window of length n across the data, with the constant of integration being a simple moving average of the first n points. Put another way, the derivative of ILRS is the linear regression slope. Note that ILRS is not the same as a SMA ( simple moving average ) of length n, which is actually the midpoint of the linear regression line as it moves across the data.
We can measure the lag of moving averages with respect to a linear trend by computing how they behave when the input is a line with unit slope. Both SMA (n) and ILRS(n) have lag of n/2, but ILRS is much smoother than SMA .
Our second benchmark moving average is well known, called EPMA or End Point Moving Average. It is the endpoint of the linear regression line of length n as it is fitted across the data. EPMA hugs the data more closely than a simple or exponential moving average of the same length. The price we pay for this is that it is much noisier (less smooth) than ILRS, and it also has the annoying property that it overshoots the data when linear trends are present.
However, EPMA has a lag of 0 with respect to linear input! This makes sense because a linear regression line will fit linear input perfectly, and the endpoint of the LR line will be on the input line.
These two moving averages frame the tradeoffs that we are facing. On one extreme we have ILRS, which is very smooth and has considerable phase lag. EPMA has 0 phase lag, but is too noisy and overshoots. We would like to construct a better moving average which is as smooth as ILRS, but runs closer to where EPMA lies, without the overshoot.
A easy way to attempt this is to split the difference, i.e. use (ILRS(n)+EPMA(n))/2. This will give us a moving average (call it IE /2) which runs in between the two, has phase lag of n/4 but still inherits considerable noise from EPMA. IE /2 is inspirational, however. Can we build something that is comparable, but smoother? Figure 1 shows ILRS, EPMA, and IE /2.
Filter Techniques
Any thoughtful student of filter theory (or resolute experimenter) will have noticed that you can improve the smoothness of a filter by running it through itself multiple times, at the cost of increasing phase lag.
There is a complementary technique (called twicing by J.W. Tukey) which can be used to improve phase lag. If L stands for the operation of running data through a low pass filter, then twicing can be described by:
L' = L(time series) + L(time series - L(time series))
That is, we add a moving average of the difference between the input and the moving average to the moving average. This is algebraically equivalent to:
2L-L(L)
This is the Double Exponential Moving Average or DEMA , popularized by Patrick Mulloy in TASAC (January/February 1994).
In our taxonomy, DEMA has some phase lag (although it exponentially approaches 0) and is somewhat noisy, comparable to IE /2 indicator.
We will use these two techniques to construct our better moving average, after we explore the first one a little more closely.
Fixing Overshoot
An n-day EMA has smoothing constant alpha=2/(n+1) and a lag of (n-1)/2.
Thus EMA (3) has lag 1, and EMA (11) has lag 5. Figure 2 shows that, if I am willing to incur 5 days of lag, I get a smoother moving average if I run EMA (3) through itself 5 times than if I just take EMA (11) once.
This suggests that if EPMA and DEMA have 0 or low lag, why not run fast versions (eg DEMA (3)) through themselves many times to achieve a smooth result? The problem is that multiple runs though these filters increase their tendency to overshoot the data, giving an unusable result. This is because the amplitude response of DEMA and EPMA is greater than 1 at certain frequencies, giving a gain of much greater than 1 at these frequencies when run though themselves multiple times. Figure 3 shows DEMA (7) and EPMA(7) run through themselves 3 times. DEMA^3 has serious overshoot, and EPMA^3 is terrible.
The solution to the overshoot problem is to recall what we are doing with twicing:
DEMA (n) = EMA (n) + EMA (time series - EMA (n))
The second term is adding, in effect, a smooth version of the derivative to the EMA to achieve DEMA . The derivative term determines how hot the moving average's response to linear trends will be. We need to simply turn down the volume to achieve our basic building block:
EMA (n) + EMA (time series - EMA (n))*.7;
This is algebraically the same as:
EMA (n)*1.7-EMA( EMA (n))*.7;
I have chosen .7 as my volume factor, but the general formula (which I call "Generalized Dema") is:
GD (n,v) = EMA (n)*(1+v)-EMA( EMA (n))*v,
Where v ranges between 0 and 1. When v=0, GD is just an EMA , and when v=1, GD is DEMA . In between, GD is a cooler DEMA . By using a value for v less than 1 (I like .7), we cure the multiple DEMA overshoot problem, at the cost of accepting some additional phase delay. Now we can run GD through itself multiple times to define a new, smoother moving average T3 that does not overshoot the data:
T3(n) = GD ( GD ( GD (n)))
In filter theory parlance, T3 is a six-pole non-linear Kalman filter. Kalman filters are ones which use the error (in this case (time series - EMA (n)) to correct themselves. In Technical Analysis , these are called Adaptive Moving Averages; they track the time series more aggressively when it is making large moves.
Included:
Bar coloring
Signals
Alerts
Loxx's Expanded Source Types
4EMA+KC+BB+DC by MontyI combined these scripts for my friend.
This script contains some imported work from @PatekCharts and I added the KC channels.
It's not that difficult.
Adaptive ATR Keltner Channels [Loxx]Adaptive ATR Channels are adaptive Keltner channels. ATR is calculated using a rolling signal-to-noise ratio making this indicator flex more to changes in price volatility than the fixed Keltner Channels.
What is Average True Range (ATR)?
The average true range (ATR) is a technical analysis indicator, introduced by market technician J. Welles Wilder Jr. in his book New Concepts in Technical Trading Systems, that measures market volatility by decomposing the entire range of an asset price for that period.1
The true range is taken as the greatest of the following: current high less the current low; the absolute value of the current high less the previous close; and the absolute value of the current low less the previous close. The ATR is then a moving average, generally using 14 days, of the true ranges.
What are Keltner Channel (ATR)?
Keltner Channels are volatility-based bands that are placed on either side of an asset's price and can aid in determining the direction of a trend.
The Keltner channel uses the average-true range (ATR) or volatility, with breaks above or below the top and bottom barriers signaling a continuation.

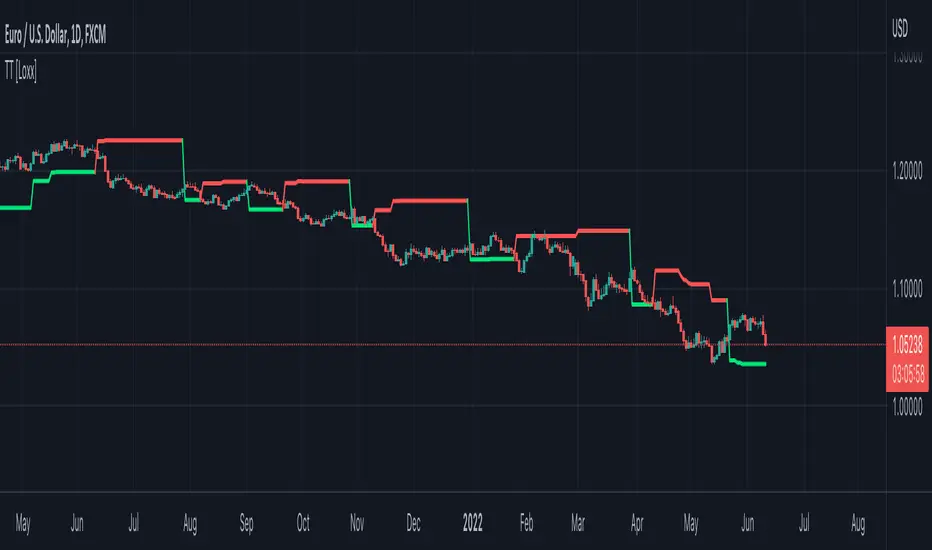
Top Trend Backtest (Simple) [Loxx]Simple backtest for Top Trend found here:
What this backtest includes:
-Customization of inputs for Top Trend calculation
-Take profit 1 (TP1), and Stop-loss (SL), calculated using standard RMA-smoothed true range
-Activation of TP1 after entry candle closes
-Long and short signal cross entries
Happy trading!
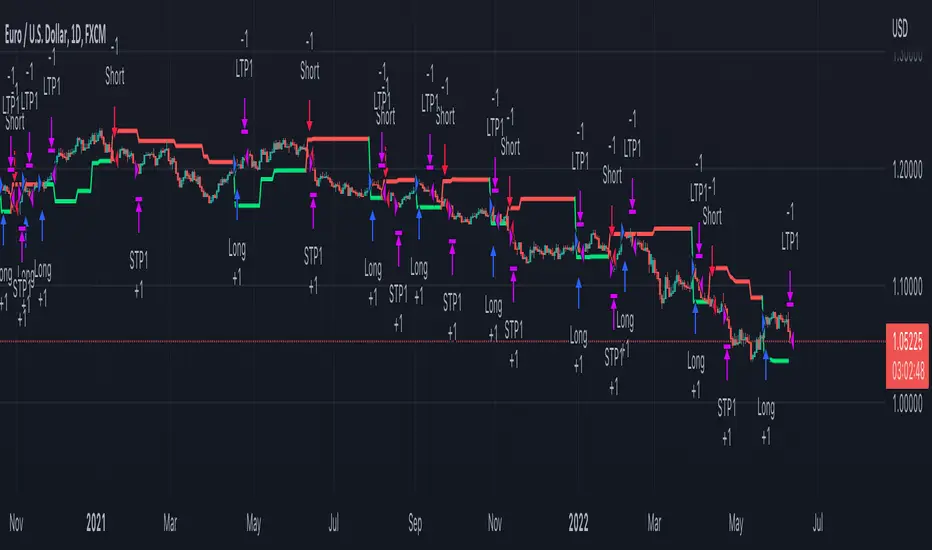
Top Trend [Loxx]Top Trend is a trend following indicator that signals breakouts and plots dynamic support and resistance levels.
Included:
-Calculation of Top Trend using either Bollinger Bands and Keltner Channels
This is an exact clone of the "TopTrend" for MT4 indicator
Bollinger Bands + Keltner Channel Refurbished█ Goals
This is an indicator that brings together Bollinger Bands and Keltner's Channels in one thing.
Both are very similar, so I decided to make a merge of the best features I found out there.
Here there is the possibility of choosing one of these two as needed.
In addition, I added the following resources:
1. Pre-Defined intermediate bands with Fibonacci values;
2. Detachment of the bands in which the price was present;
3. Choice of Moving Average:
"Simple", "Exponential", "Regularized Exponential", "Hull", "Arnaud Legoux", "Weighted Moving Average", "Least Squares Moving Average (Linear Regression)", "Volume Weighted Moving Average", "Smoothed Moving Average", "Median", "VWAP");
4. Statistics: bars count within the bands.
█ Concepts
Keltner Channels vs. Bollinger Bands
"These two indicators are quite similar.
Keltner Channels use ATR to calculate the upper and lower bands while Bollinger Bands use standard deviation instead.
The interpretation of the indicators is similar, although since the calculations are different the two indicators may provide slightly different information or trade signals."
(Investopedia)
Bollinger Bands (BB)
"Bollinger Bands (BB) are a widely popular technical analysis instrument created by John Bollinger in the early 1980’s.
Bollinger Bands consist of a band of three lines which are plotted in relation to security prices.
The line in the middle is usually a Simple Moving Average (SMA) set to a period of 20 days (the type of trend line and period can be changed by the trader; however a 20 day moving average is by far the most popular).
The SMA then serves as a base for the Upper and Lower Bands which are used as a way to measure volatility by observing the relationship between the Bands and price.
Typically the Upper and Lower Bands are set to two standard deviations away from the SMA (The Middle Line); however the number of standard deviations can also be adjusted by the trader."
(TradingView)
Keltner Channels (KC)
"The Keltner Channels (KC) indicator is a banded indicator similar to Bollinger Bands and Moving Average Envelopes.
They consist of an Upper Envelope above a Middle Line as well as a Lower Envelope below the Middle Line.
The Middle Line is a moving average of price over a user-defined time period.
Either a simple moving average or an exponential moving average are typically used. The Upper and Lower Envelopes (user defined) are set a range away from the Middle Line.
This can be a multiple of the daily high/low range, or more commonly a multiple of the Average True Range."
(TradingView)
█ Examples
Bollinger Bands with 200 REMA:
Keltner Channel with 200 REMA:
Bollinger Bands with 55 ALMA:
Keltner Channel with 55 ALMA:
Bollinger Bands with 55 Least Squares Moving Average:
█ Thanks
- TradingView (BB, KC, ATR, MA's)
- everget (Regularized Exponential Moving Average)
- TimeFliesBuy ("Triple Bollinger Bands")
- Rashad ("Fibonacci Bollinger Bands")
- Dicargo_Beam ("Is the Bollinger Bands assumption wrong?")

LNL Keltner ExhaustionLNL Keltner Exhaustion resolves the constant issue of Bands vs. EMAs
With the keltner exhaustion wedges, you can easily see the keltner channel extremes witout using the actual bands. That way, you will know whether the price is outside of the keltner channels + you can use other indicators (such as EMAs) on chart without the bands so the chart does not look messy & hard to read.
Two Types of Wedges:
1. Green/Red Wedge - Price action is extended outside the regular band. More of a "profit taking" zone rather than "entry taking" (default set to 3.0 ATR factor).
2. Purple Wedge - Price action is extended outside of the extreme band. Chances are price will revert to mean soon (default set to 4.0 ATR factor).
Works great as a target tool with the squeeze setup or as an overall extension gauge.
Hope it helps.

Hull Keltner ChannelThis script is a Keltner Channel that uses a Hull Moving Average as source, instead of the 20-period EMA.
A hull band improves on lag and smoothness to Simple and Exponential Moving Averages.
And ATR based envelop is generated from this improved MA to form the Keltner Channel.
Hull on EHMA source with 180 periods loopback, coupled with a 200 period loopback for the Keltner Channel and 2 and 6 standard deviations, are my fav settings on Bitcoin, but feel free to try new settings.
Use it as you would use a normal Keltner Channel or Bollinger Bands.
[kai]Keltner&BolingerIt is an indicator that simultaneously displays the Bollinger Bands (BB) and Keltner Channel (KC) calculated for the log scale.
* If you need the normal scale version, please turn off the log mode in the settings.
I think the usage is the same as normal BB and KC.
From here, it ’s an original way of thinking.
I thought about countermeasures for the phenomenon that the BB contracts (squeezes) and breaks, but for some reason it suddenly reverses and breaks greatly in the opposite direction or ends in misfire.
The main part of this Inge is KC, and I think that the range within KC is the range.
Considering that the bar broke above and below the range of KC and broke, the trend market started.
BB fits in KC and judges that the trend is game over
If it is within KC, it is contrarian at the upper and lower limits of KC.
If it breaks, Trend following
Profit if BB fits in KC
I'm thinking about how to use it
ログスケール用にログ計算したボリンジャーバンド(BB)とケルトナーチャンネル(KC)を同時に表示するインジケーターです
※通常スケール版が必要な時は設定のlog modeをOFFにしてください
使い方は普通のBBとKCとおなじで使用方法で良いと思います
ここからはオリジナルな使い方の考え方です
BBが収縮(スクイーズ)してブレイクしたのに何故か突然反転して反対の方に大きくブレイクしたり、不発に終わったりする現象の対策を考えました
このインジのメインはKCでKCの範囲内はレンジと考えます
KCの範囲外にバーが上抜け、下抜けして、ブレイクしたと考え、トレンド相場スタートとします
BBがKCの中に納まってトレンド終了と判定します
KC内の場合はKCの上限、下限で逆張り
ブレイクした場合は順張り
BBがKCの中に納まったら利確
という感じの使い方を考えています
