MACD on VWAPA modified version of the traditional MACD
Uses VWAP to calculate MACD instead of the usual closing price.
K-macd

Volume Weighted MACDA twist on the traditional MACD indicator.
Volume-Weighted Moving Averages are used instead of the traditional EMAs.

MACD on OBVCalculates trend of OBV with help of MACD indicator. Gives a good idea of the general trend. To be used with other confirmations.
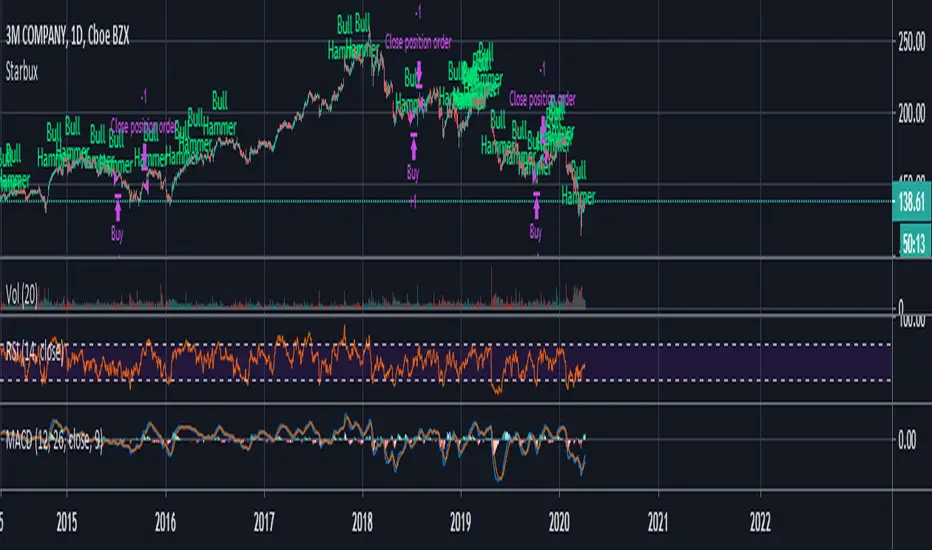
StarbuxI made this in starbucks .
Bullish hammer trading signal algorithm
using MACD for trend determination and holding period.
DEMA Strategy with MACDThe Double Exponential Moving Average (DEMA) indicator was introduced in January 1994 by Patrick G. Mulloy, in an article in the "Technical Analysis of Stocks & Commodities" magazine: "Smoothing Data with Faster Moving Averages"
It attempts to remove the inherent lag associated to Moving Averages by placing more weight on recent values. The name suggests this is achieved by applying a double exponential smoothing which is not the case. The name double comes from the fact that the value of an EMA (Exponential Moving Average) is doubled. To keep it in line with the actual data and to remove the lag the value "EMA of EMA" is subtracted from the previously doubled ema.
DEMA is a very responsive system. A lot of signals can be generated only when trading with DEMA. In this strategy, I combined Dema buy-sell signals with MACD indicator. When you activate MACD confirmation from settings; When DEMA comes to long situation, the MACD histogram is checked to be positive.

Trend Trader Strategy with MACDThis is plots the indicator developed by Andrew Abraham in the Trading the Trend article of TASC September 1998
The strategy I use has already been published explicitly by HPotter, you can review the core code from there.
I have converted the existing strategy codes that have been published into the strategy and the result looks great but I noticed that the indicator performed too much in short periods like 1 minute and I thought it would be healthier to get MACD approval. MACD approval will come selected by default. When the indicator reaches the buy status, if the macd histogram is positive, it enters the long process. By removing this confirmation from the settings window, you can see the normal signal frequency of the indicator.
This strategy is mainly based on trend signals. In fact, I am publishing this strategy to use in alternating trading for Bear-Bull crypto coins.
What does the bear-bull comparison mean?
You can open the same chart in the ETHBEAR / USDT symbol as opposed to the ETHBULL / USDT symbol that appears on the chart. When BUY signal comes in bull symbol, SELL will come in bear symbol. When BUY signal comes in bear symbol, SELL will come in bull symbol. In this way, very fast and very high profit can be obtained by alternating operation.

Crypto_Melih StrategyThis indicator is formed by combining 3 different indicators.
1 - MOST: Moving Stop Loss Indicator
2 - Inverse Fisher Transform on STOCHASTIC
3 - MACD
When MOST gives BUY signal; If Inverse Fisher Transform on STOCHASTIC and MACD states are positive, the process is entered.
When the MOST gives the SELL signal, the process is exited.

PASS: Price Action Support StrategyPASS is dedicated to all Intraday Traders.
This is based on Secret of Pivot Boss book by Frank Ochoa. Suitable for Intraday Trading.
It is combination of two Price action theory and one indicator mainly known as Floor Pivots, Camarilla Pivots and MACD.
MACD gives the better entry & exit levels for Day Trading whereas the other two Price action theory give the "levels/zones" where actions can be expected during live market hours.
You can view Daily time frame cpr/support/resistance.
You can also view Previous Day,Week,Month High/Low.
You can also turn on/off as per your wish and adjust the colors as per your preferences.
Happy Trading !!

MACD AND SMA COMBINATION StrategyHello Everyone This Strategy Base on MACD AND SMA COMBINATION
By Default 3 Percentage TP AND 1 Percentage Sl & quantity 500
By Default Backtesting Starting Time 1 Jan 2020 and end time 31 Dec 2020
You Can also change everything.
In future, I will Enhance this Strategy
if you have any suggestion Mention There Thank you so much
WMA + MACD strategy with trailing stopHi!
That's my first strategy. I already learn pine, so i will work on it more. Now i search how to make trailing stop working.
"WMA + MACD strategy with traiing stop" is very simple strategy which is designated for stocks market. It is created only to take long positions.
Buy signal is when WMA(120) is below price and macd(10,20,10) histogram is higher than 0.
Position should be automaticly closed when price hits stoploss level.
One transaction should be max 20% of our capital and stoploss is set 3% lower than last closing price.

kurdistan MACD & RSI & EMA Hello friends
This indicator can help you to combine the three indicators together
EMA (20), MACD (12, 26, 20), RSI (14)
Apply ema20 to rsi as the signal line
Long arrival time
Price above EMA20, MACD above signal line and RSI above signal line
Short arrival time
Price below EMA20, MACD below signal line and RSI below signal line

Cyatophilum Intraday Breakouts [BACKTEST]Private indicator. Access can be unlocked by purchasing a subscription on my website which link is in my profile signature.
Here is the backtest version of the Triple Screen Strategy
Recap of the strategy:
The goal of this indicator is to be able to automate and backtest the strategy, all while staying on a single chart and without repainting.
Features:
Market Tide MACD configuration
Market Wave choice between 3 oscillator: Elder Force Index, Stochastic and William Percent Range
Automated Long and Short entries alerts
Integrated Trailing Stop Loss system fully configurable with automated exit alerts
Integrated Trailing Take profit system fully configurable with automated exit alerts
Indicator samples
Backtest
Strategy time period can be choosen in the parameters of the indicator.
Be aware that the chart is limited to 10 000 candles of the current timeframe for the backtest calculation.
Default initial capital: 10 000$
Default order size: 100% of equity
Default commission fees: 0.1% per transaction
Backtest results below.
Alerts
Entry Long: Triggers on green long labels.
Take Profit Long: Triggers on the "TAKE PROFIT" green flag if the long target is reached.
Stop Loss Long: Triggers on the "STOP LOSS" or "TSSL" label if the stop loss line has been crossed.
Exit Long: Triggers on either of Take Profit Long or Stop loss long.
Entry Short: Triggers on red short labels.
Take Profit Short: Triggers on the "TAKE PROFIT" green flag if the short target is reached.
Stop Loss Short: Triggers on the "STOP LOSS" or "TSSL" label if the stop loss line has been crossed.
Exit Short: Triggers on either of Take Profit Short or Stop Loss Short.
You can get access to this indicator by purchasing a subscription using the link below.
Thanks for reading!

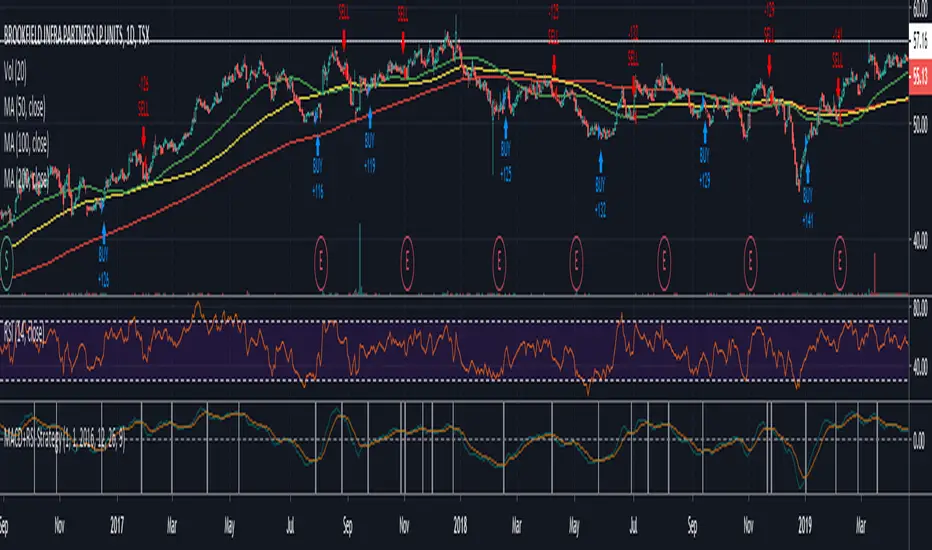
MACD_RSI strategyUse three indicator to entry a position
EMA (20), MACD (12, 26, 20), RSI (14)
apply ema20 on rsi as signal line
Entry long when
price above EMA20, MACD above signal line and RSI above signal line
Entry short when
price below EMA20, MACD below signal line and RSI below signal line
Study only, use it under your own risk.

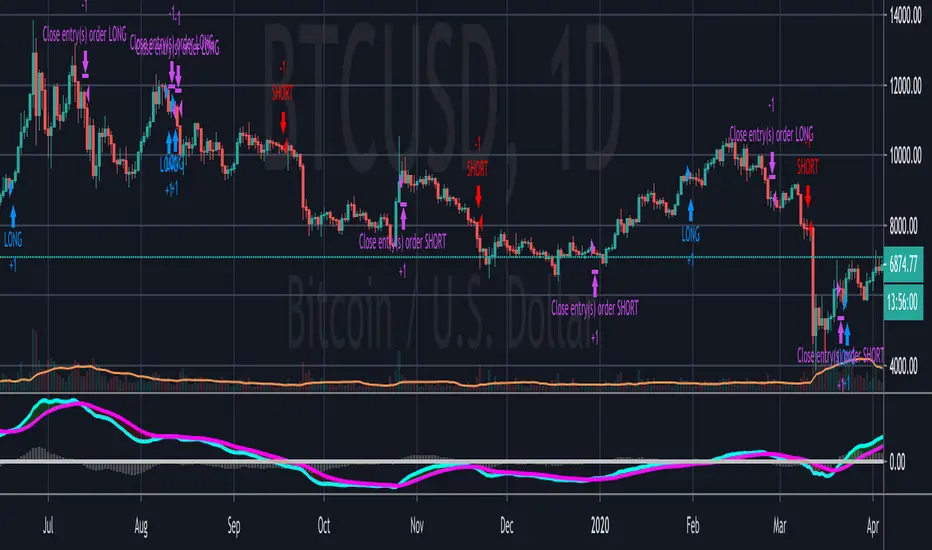
MacD (Future Known or Unknown) StrategyThis indicator/strategy is to be used as a way to baseline the top potential any strategy could have with other strategies and indicators.
What I have created literally shows the BEST moves possible you could have made in my opinion for SHORTING or LONGING using only the MacD values of the 4 hour while on the 30 minute chart.
To use this, try checking out XBTUSD on the 30 minute chart . It will work under different time frames but works best on the 30 minute chart in my opinion. It WILL NOT WORK Above 2 hours time frame.
DO NOT TRADE WITH THIS indicator . I can't emphasize this enough. These results only work because of the lookahead_on parameter. A lot of scam indicators and strategies use this to trick people on tradingView into buying their scripts.
This code is OPEN SOURCE and as such there is nothing to hide and no scam!
I like to use this as a comparison tool for how good I 'could' have traded and at what points those were. By knowing where the perfect trading positions are, you can create real indicators and scripts that try to find patterns in those positions.
This also shows that IF you could know the direction the MacD was going what amazing results you could get ^_~.
This is meant purely for entertainment purposes and for comparing against your own scripts.
I've included the options in the settings to allow ONLY LONG or ONLY SHORTS. By default it attempts both buy attempts. You can also change your starting ($) amount and commission percentage that is taken per trade as well.
Also included in the options is the ability to set the back testing time frame to see how it performs during just certain time periods.
Finally a color explanation
Red - MacD 4 hour going down
Green - MacD 4 hour going up
Purple - MacD 4 hour going down (from an up position)
Yellow - MacD 4 hour going up (from a down position)
Notice the program will always buy right before it turns into a yellow color since it knows the future.
In the options you can turn off 'use the future' to see the horrible results if you trade the moment you know which direction the MacD 4 hour is actually going. I will revise this script in the future with attempts to work without knowing the future as play options to get better results.
If you have any questions or comments, please do not hesitate to ask!

New RenaissancePrelim version of MACD long entry and exit with custom time frame selector.
To do:
Add Stoch and Stoch RSI criteria.

MACD 4H StrategyThis strategy is a basic example of using MACD AND the instrument must be found an appropriate timeframe (4H recommended) before being tested with.

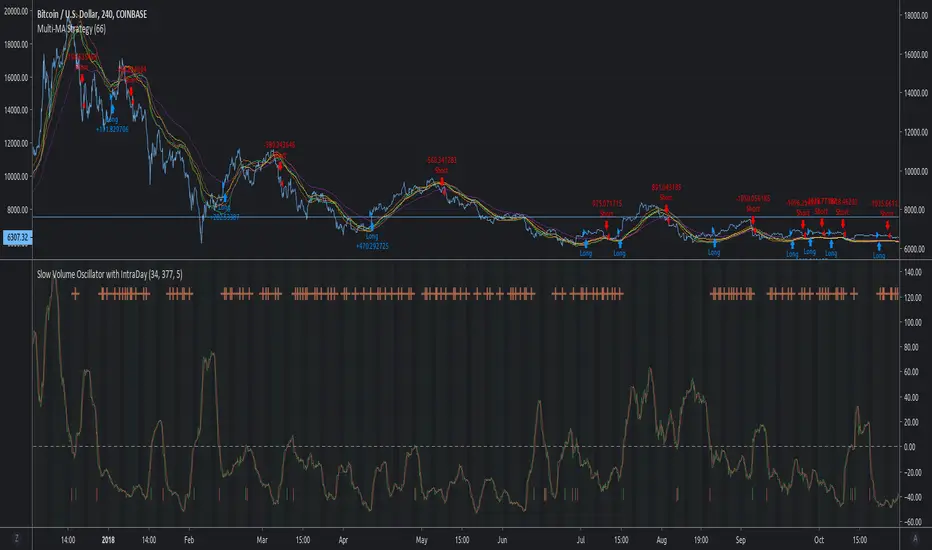
MACD Multi-MA StrategyThis script applies the average of each major MA (SMA, RMA, EMA, WVMA, WMA) to the MACD formula.
The logic is simple. When all 5 MA's are in agreement in direction, then then script will notify users of change.
I posted this as a strategy to help show how logic does in back test. If you use my simple yet effective solution to find take profit locations, you can blow this back testing out of the water!!!
To set alerts simply turn script into study
//@version=2
study(title="MACD Multi-MA Study", overlay=false)
src = close
len1 = input(8, "FAST LOOKBACK")
len2 = input(144, "SLOW LOOKBACK")
/////////////////////////////////////////////
length = len2-len1
ma = vwma(src, length)
plot(ma, title="VWMA", color=lime)
length1 = len2-len1
ma1 = rma(src, length1)
plot(ma1, title="RMA", color=purple)
length2 = len2-len1
ma2 = sma(src, length2)
plot(ma2, title="SMA", color=red)
length3 = len2-len1
ma3 = wma(src, length3)
plot(ma3, title="WMA", color=orange)
length4 = len2-len1
ma4 = ema(src, length4)
plot(ma4, title="EMA", color=yellow)
long = ma > ma and ma1 > ma1 and ma2 > ma2 and ma3 > ma3 and ma4 > ma4
short = ma < ma and ma1 < ma1 and ma2 < ma2 and ma3 < ma3 and ma4 < ma4
alertcondition(long == true, title='MACD LONG SIGNAL', message='MACD LONG!')
alertcondition(short == true, title='MACD SHORT SIGNAL', message='MACD SHORT!')
MACD Indikator v1If you make a loss, I am not responsible for it. Please use this with caution.
==================================================================================================================================================
MACD - Strategy
Considering cross the lines and Top / Buttoms.
==================================================================================================================================================
Do realize that the indicator is not 100% accurate and please use this with caution. Please read the disclaimer below before using this indicator or the services (Telegram/ Twitter , Trading View etc.) services associated with this indicator:
Disclaimer:
No Investment Advice Provided
Any opinions, chats, messages, news, research, analyses, prices, or other information contained here are provided as general information for educational and entertainment purposes only and do not constitute investment advice. My bullshit statements should not be relied upon as a substitute for an extensive independent market research before making your actual trading decisions. Opinions, market data, recommendations or any other content is subject to change at any time without notice. I will not accept liability for any loss or damage, including without limitation any loss of profit, which may arise directly or indirectly from use of or reliance on such information.
I do not recommend the use of technical analysis or any analysis as a sole means of trading decisions. I do not recommend making hurried trading decisions. I have no clue about PAST PERFORMANCE or any INDICATIVE FUTURE RESULTS.
THE script and its associated services ARE PROVIDED "AS IS", WITHOUT WARRANTY OF ANY KIND, EXPRESS OR IMPLIED, INCLUDING BUT NOT LIMITED TO THE WARRANTIES OF MERCHANTABILITY, FITNESS FOR A PARTICULAR PURPOSE AND NONINFRINGEMENT. IN NO EVENT SHALL THE AUTHORS OR COPYRIGHT HOLDERS BE LIABLE FOR ANY CLAIM, DAMAGES OR OTHER LIABILITY, WHETHER IN AN ACTION OF CONTRACT, TORT OR OTHERWISE, ARISING FROM, OUT OF OR IN CONNECTION WITH THE SOFTWARE OR THE USE OR OTHER DEALINGS IN THE SOFTWARE, WEBSITE, SCRIPT, SIGNALS.

EVWMA VWAP MACD Strategy [QuantNomad]Based on comment of @coondawg71 I tried to compare VWAP and EVWMA.
Both are sort of moving averages so I decided to create a MACD based on these 2 indicators.
In parameters you can set EVWMA Length and 2 smoothing lengths for "macd" and "signal".
Strategy seems to work pretty good at 2h-8h timeframes for crypto.
What do you thing about it?

QuantNomad - EVWMA MACD StrategyPretty simple EVWMA (Elastic Volume Weighted Moving Average ) MACD Strategy.
EVWMA is a quite interesting moving average where the period of the MA is defined from the volume itself.
It incorporates volume information in a natural and logical way. The EVWMA can be looked at as an approximation to the average price paid per share.
As a volume period, you can use sum of the last x bars volumes.
Here are other EVWMA indicators/strategies:
EVWMA indicator:
EVWMA Cross strategy:

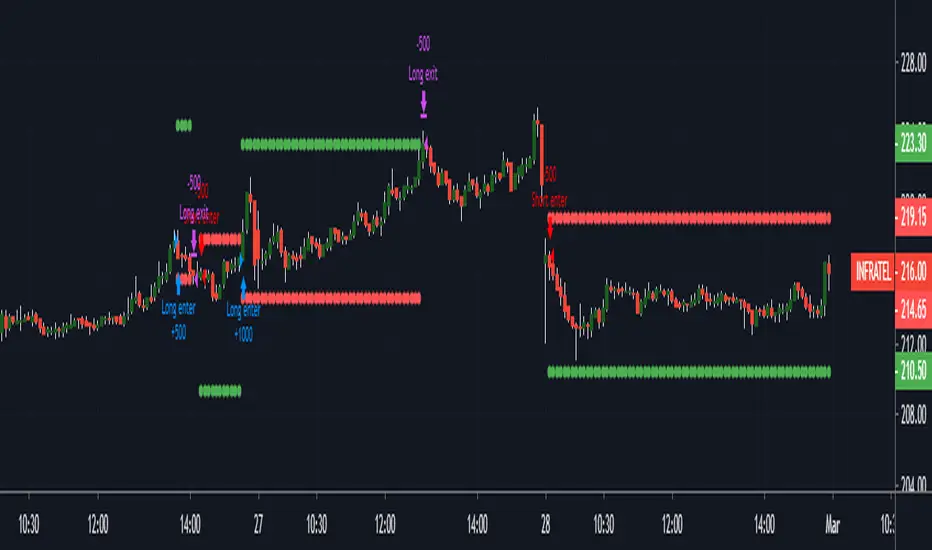
Histogram Trends Strategy by SedkurThis gives to you buy-sell signal with MACD's histogram trends.
Use "Fast and Slow length" and "Trend of Histogram Number" inputs to take less or more signal.
"Trend of Histogram Number" : This means how many histogram bars the trend continues before trading.

MACD Strategy by SedkurThis gives to you buy-sell signal with MACD histogram value.
Use "Fast and Slow length" and "Buy or Sell Histogram Value" inputs to take less or more signal.

Easy to Use MACD+RSI Strategy
BEGINNERS REJOICE!
Easy to use strategy test using MACD with RSI as a confirming indicator. The code is structured to make it easy to manipulate the variables to your choosing.
EASY TO CHANGE CODE VARIABLES
LINE 2 = Change the amount you invest every trade and the currency
LINE 8/9/10 = Change the defval of each of these lines to backtest from a certain date
LINE 16/17/18 = Change the MACD sensitivity by changing the defval on each line
LINE 21 = Change the value after close toadjust the sensitivity of the RSI
LINE 37/39 = Change/remove the < and > variables for macdLine and rsivalue after the crossover/crossunder to adjust your buying point further.
As a beginner you may not feel comfortable with shorting stocks, therefore LINE 5 was added to only allows long positions.
Funny how a simple indicator can return such a high profitability. Couple this with some trend/exit strategies and you'll have something really special!