K-macd

Improved Multi-Timeframe (MTF) MACD - plots same as live dataThis multi-timeframe MACD uses an improved calculation to accurately calculate the indicator's value with every new bar on the time frame your chart is set to. Previously the indicator only recalculated with every new update on the timeframe used in its security function. This means that this improved script plots the real, current value of your indicator across your chosen timeframes on your chart's resolution and no longer only plots only the indicator's monthly/weekly/daily/4 hour/ect closing value on the your chart.
Input values are fixed to their default (close,12,26) configuration to make this indicator's improved calculation possible.
When using "Plot Higher Timeframe?" the script will set the indicator to only plot its value in closest larger timeframe. This option overrides the two following options. For example, when using the daily resolution, only the weekly value will plot, or when using the one hour (60m) resolution, only the 4 hour (240m) value will plot.
The "Omit Higher Timeframes?" option will set the indicator to only plot starting from the 1/2/3/4/5/6/7th closest larger timeframe. For example, when using the daily resolution and this option set to 0, all values from the weekly resolution and up will plot, but if set to 1, all values from the monthly resolution and up will plot instead.
The "Plot Yearly/Quarterly/Monthly/Weekly/Daily/4 Hour/1 Hour/15 Minute/5 Minute?" options allow enabling/disabling a specific timeframe. All are enabled by default. For example, if you do not want the yearly value of the indicator to ever plot, you can disable the "Plot Yearly?" option.
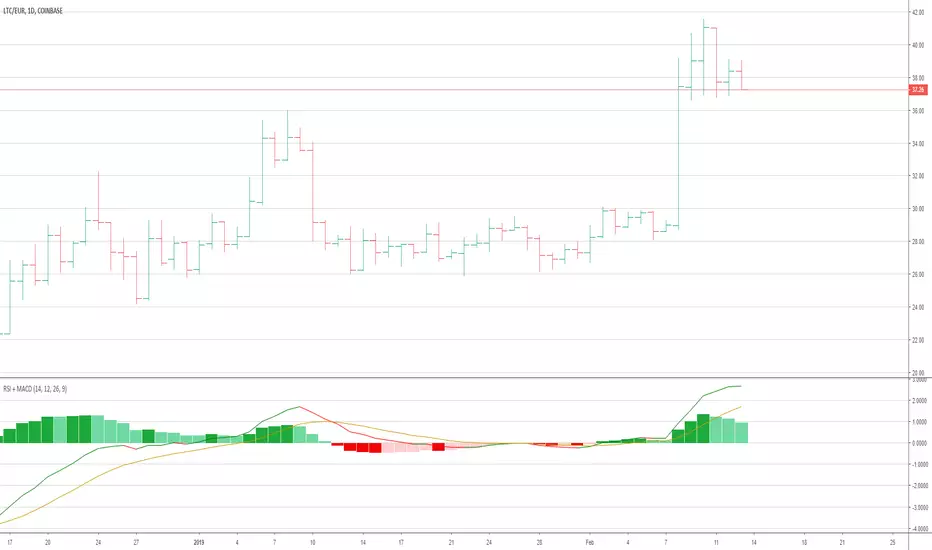
TH_MACDHistogram-only version of MACD with custom settings: 14,120,7
Pay attention to U-shapes turning points and/or Baseline Crosses
This indicator is great combo with the TH_Hull+
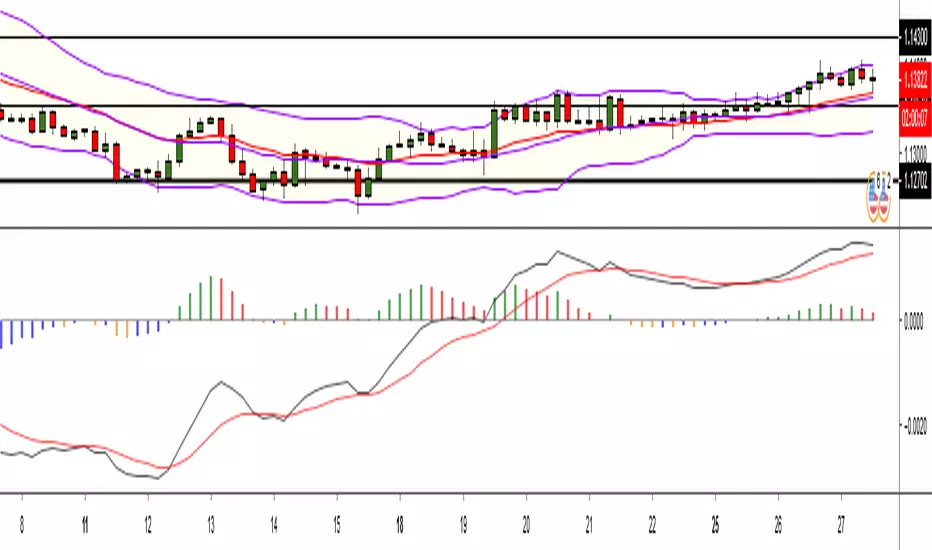
RSI or MACD + Tendance Kijun LTThis script is an update of my previous script "RSI + Tendance Kijun LT", I will not explain it here, if needed have a look at it :
I made a new script (and not update the previous one) because some people may not be interested by MACD and for performance perspective they may be interested to only have RSI (since you can't have both but only switch from RSI and MACD)
So now, you can choose to have MACD instead of RSI with long term trend based on Kijun still dispaying. Why am I adding MACD even if most of the time I never use it ? It's for Elliott Wave purpose and principaly for triangle. With MACD, you can easily identify if you're forming a triangle or not in an Elliott Wave perspective (I'm not speaking about chartist triangle).
As an example, you can see ETHUSD in daily and something looking similar to a triangle. We can trade it with many possibility (breakout, support/resistance) but I'm interested in to identify if it's a triangle with an EW count (not chartist) and if it's the case I will consider different scenario (triangle are most of the time wave 4 so we could have one more push leg down on this ticker)
So, in my daytrading I'm still always using RSI except when I want to verify if we have a triangle :) and I need to switch to MACD for that to check the following things :
- am I able to draw a triangle as the price did
- may I able to join A to C and B to D and still have a triangle on MACD
- If Yes, I will take care of E point because it's the start of the 5th wave (E point may be a truncated wave of the triangle and not join the line of points A to C)
By adding this in my strategy, I can anticipate different scenarios and invalidate them if I didn't get the triangle on MACD (by having a D point on MACD not respecting the triangle form). Don't forget, we can decide to don't trade a triangle as an EW count but still trade it as a chartist form (breakout or anything else).
In summary for the next days/weeks, on ETHUSD in daily time unit I will therefore wait and see if the price goes up to point D by being validated on the MACD. If so, then I will look at the possible formation of point E around prices 141$ and 156$, if at these prices I have short signals then it will be interesting to go back in short position
--------------------------------------------------------
Ce script est une mise à jour de mon script précédent "RSI + Tendance Kijun LT", je ne l'expliquerai pas ici, si besoin jetez-y un oeil :
J'ai fait un nouveau script (sans forcer la mise à jour du précédent) parce que certaines personnes peuvent ne pas être intéressées par MACD et pour des raisons de performance, elles peuvent être intéressées à n'avoir que RSI (puisque vous ne pouvez pas avoir les deux en même temps mais seulement passer de RSI et MACD)
Donc maintenant, vous pouvez choisir d'avoir MACD au lieu de RSI avec une tendance à long terme basée sur Kijun qui s'affiche toujours. Pourquoi est-ce que j'ajoute MACD même si la plupart du temps je ne l'utilise jamais ? C'est pour Elliott Wave et surtout pour le triangle. Avec MACD, vous pouvez facilement identifier si vous formez un triangle ou non dans une perspective Elliott Wave (je ne parle pas de triangle chartiste).
Par exemple, vous pouvez voir que sur ETHUSD en unité de temps journalière nous avons quelque chose qui ressemble à un triangle. Nous pouvons faire des trade de pleins de manières différentes (cassure d'oblique, support/résistance) mais je suis intéressé d'identifier si c'est un triangle avec un compte EW (pas chartiste) et si c'est le cas, je vais envisager un scénario différent (sachant que les triangles sont la plupart du temps la vague 4 et donc envisager à la sortie une dernière poussée baissière type vague 5 sur ETHUSD)
Donc, dans mon daytrading, j'utilise toujours RSI sauf quand je veux vérifier si nous avons un triangle :) et j'ai besoin de passer à MACD afin de vérifier les éléments suivantes :
- Suis-je capable de dessiner un triangle comme le prix le dessine
- puis-je joindre A à C et B à D et toujours avoir un triangle sur MACD ?
- Si oui, je m'occupe du point E car c'est le début de la 5ème vague (le point E peut être une onde tronquée du triangle et ne pas joindre la ligne des points A à C).
En ajoutant cela dans ma stratégie, je peux anticiper différents scénarios et les invalider si je n'ai pas obtenu le triangle sur MACD (en ayant un point D sur MACD ne respectant pas la forme du triangle). N'oubliez pas, nous pouvons décider de ne pas le trade comme un triangle d'un décompte EW mais de le trade simplement comme un triangle chartiste (breakout ou autre chose).
En résumé pour les prochains jours/semaines, sur ETHUSD en unité de temps journalière je vais donc patienter et voir si le prix va jusqu'au point D en étant validé sur le MACD. Si oui, alors je regarderai l'éventuelle formation du point E autour des prix 141$ et 156$, si à ces prix j'ai des signaux vendeurs alors il sera intéressant de rentrer en position short

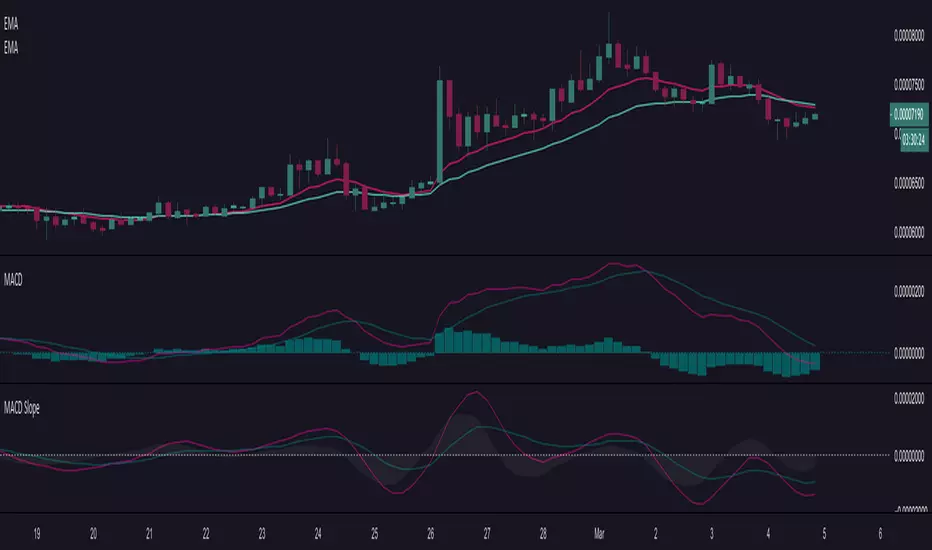
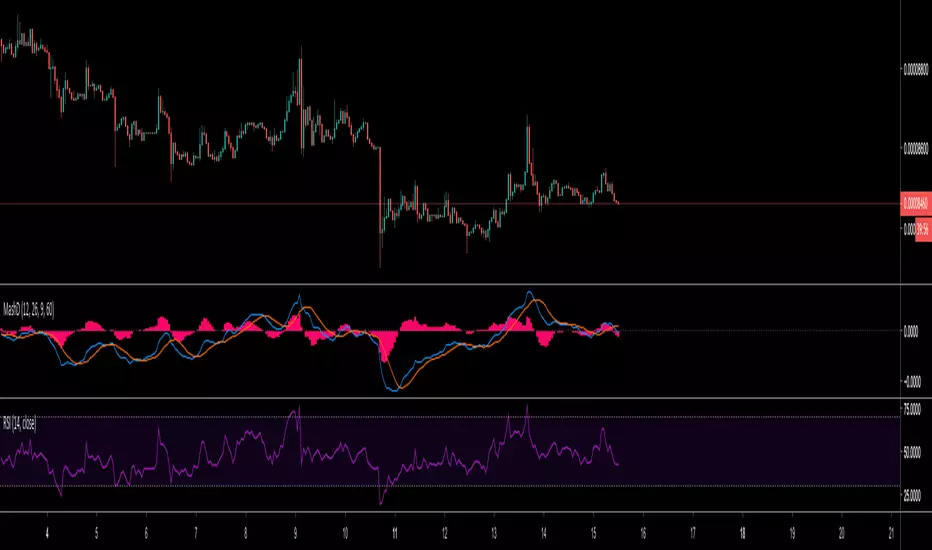
MACD SlopeShows slopes of macd line, signal line and histogram. A negative and rising slope shows improvement within a downtrend. A positive and falling slope shows deterioration within an uptrend.
EURUSD MACD ALERT 1min Long only Alert Script for AutoviewThis is the Alert Script for the EURUSD 1min Long only script. It is also scripted with the Autoview syntax in the message body of the alert to execute Long at market price and sell open orders at market price. These conditions are set based on the EURUSD 1min Long only script posted. You can adjust as needed.

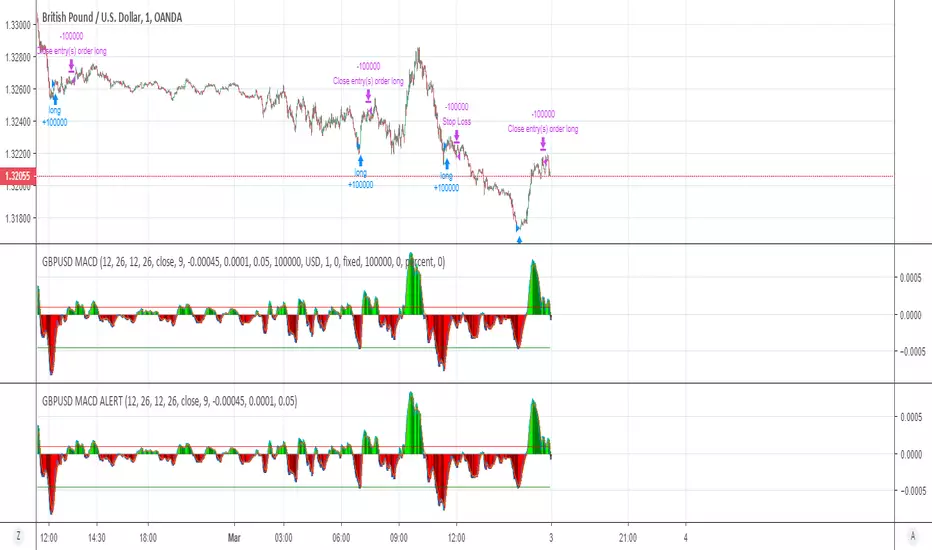
GBPUSD MACD ALERT 1min Long only Alert Script for AutoviewThis is the Alert Script for the GBPUSD 1min Long only script. It is also scripted with the Autoview syntax in the message body of the alert to execute Long at market price and sell open orders at market price. These conditions are set based on the GBPUSD 1min Long only script posted. You can adjust as needed.
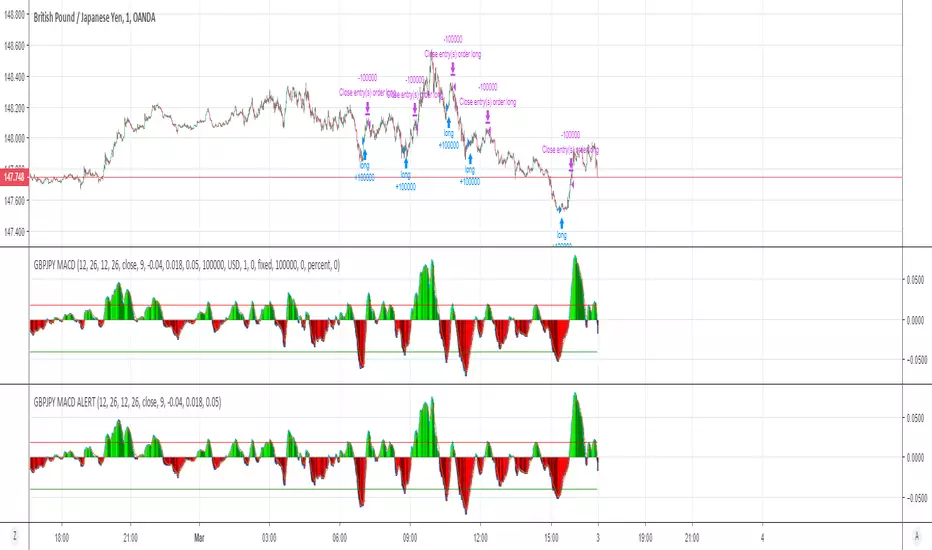
GBPJPY MACD ALERT 1min Long only Alert Script for AutoviewThis is the Alert Script for the GBPJPY 1min Long only script. It is also scripted with the Autoview syntax in the message body of the alert to execute Long at market price and sell open orders at market price. These conditions are set based on the GBPJPY 1min Long only script posted. You can adjust as needed.

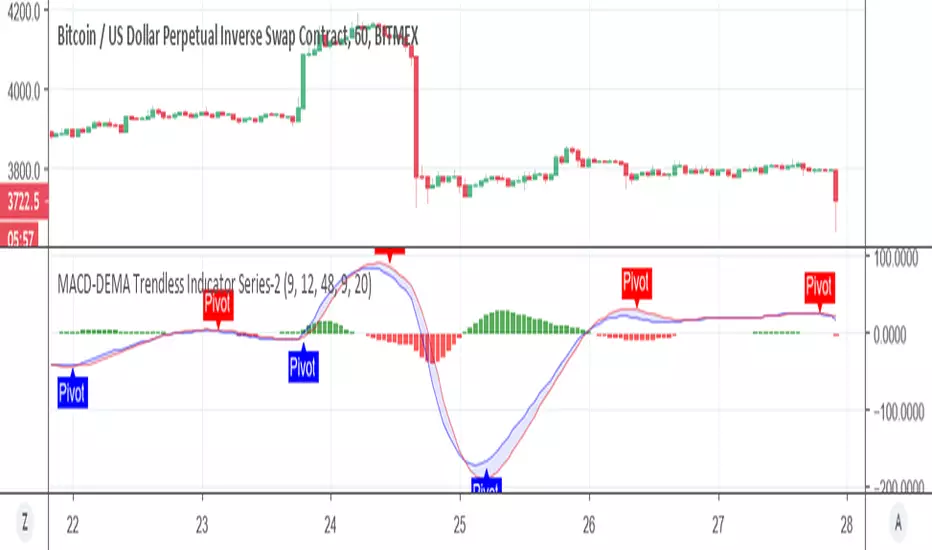
MACD-DEMA Trendless Indıcator Series-2Using This script of MACD DEMA
we play little to add pivot point to the macd so we can get the trend of it better:)
MACD-Color-Histograms
Ce MACD permet d'afficher les composantes souhaitées, en permettant un code couleur personnalisé au niveau des histogrammes.

Price Momentum MACD Signal Multiple Timeframes Momentum Indicator with MACD Signal & Base Line
MACD Histogram Indicator is good , but what if you can use momentum as improving it ?
Well Using Price Momentum and the MaCD we can achieve a better action price strategy.
Based upon @LazyBear and @ChrisMoody indcators respectively.
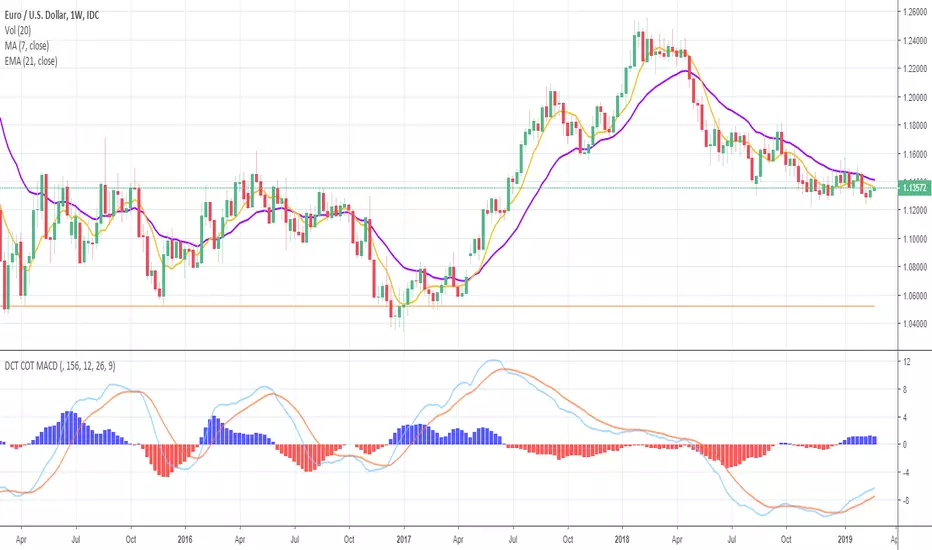
Deckchair Trader COT MACDPlots the COT MACD from the legacy report data from Quandl. Plots the commercial, non commercial and non reportables. Each plot can be hidden as needed.
I've tried to capture the basic dollar based currencies and the futures such as corn , wheat , rice, oil , hogs etc. The symbols required a little translation to match what Quandl is expecting but I think I got most of them. Please let me know of any issues with these.
Part of a suite of COT related indicators based on the excellent book "the commitment of traders bible" by Stephen Briese.
Feb 26, 2018
Release Notes: Quandl have changed their codes :( now they seem to be using the CFTC Id's where are numeric (and can be found in the dump you get from them)
So whereas before for example, GBPUSD was mapped to BP it is now mapped to 096742.
I have gone through the various dumps and tried to map all the symbols I was using, the currency were the easy ones, the wheat, corn etc a little harder to trade down due to variations.
Please let me know if different
Thanks
Tim Titchmarsh
DeckchairTrader
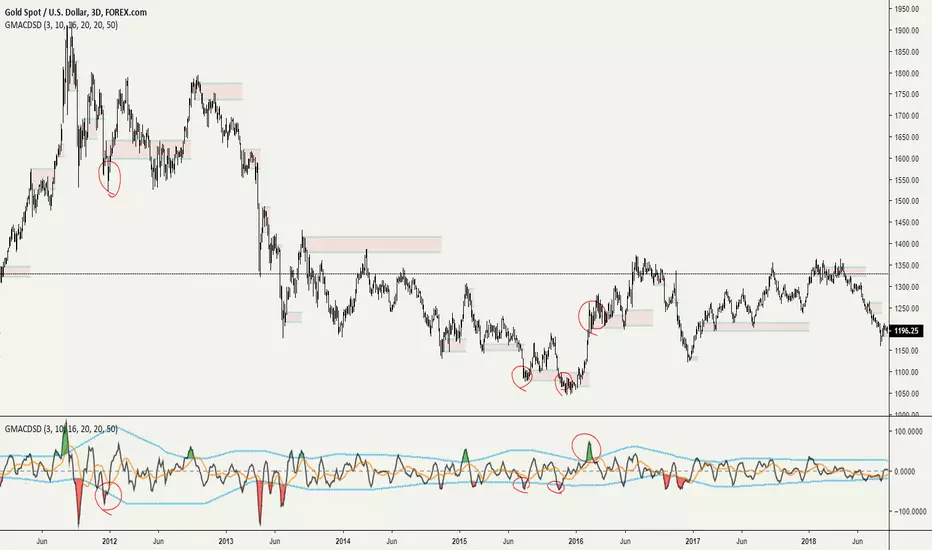
Grimes Modified MACD Supply DemandA follower of mine asked me if I could make a version of my www.tradingview.com script using the MACD. Well it just so happens I was making a few modifications to my MACD script: just as this question came up so I went ahead and threw this together.
The MACD that triggers the SR zones is pictured below, with key trigger points encircled to illustrate how it works.
9 Seasons Rainbow Indicator DEMO [GO8686]Having good pattern recognition? Use this indicator to test and practice it.
Market is full of life, with seasons.
9 Seasons Rainbow Indicator displays 9 seasons of any trading instrument in multiple time frames, helping traders and investors understand the flow of price.
The combination of seasons in different time dimensions may give perfect trading signals, for instance: overbought in both small time frame and big time frame has high success probability of shorting trade.
Please install the indicator: Demo, PRO or STANDARD Version. Apply the indicator to your favorites trading instruments: indices, stocks, futures, forex or crypto currencies. Find your patterns that make money.
---------- 9 Seasons ----------
Bull(Green), evolves into BullRest, OverBought, Bear, or Neutral
Bull Rest(Light Green): a pullback or retracement, evolves into Bull or Bear
OverBought(Yellow): may have defined a top or resistance, can happen in range, evolves into CrazyBought or Bear
CrazyBought(Lime): going up in a high volatility, evolves into Bear, OverBought, or BullRest
Neutral(White): a wandering season without direction, evolves into Bull or Bear
Bear(Red), evolves into BearRest, OverSold, Bull or Neutral
Bear Rest(Light Red): a bounce, evolves into Bear or Bull
OverSold(Blue): may have defined a bottom or support, can happen in range, evolves into CrazySold or Bull
CrazySold(Fuchsia): going down in a high volatility, evolves into Bull, OverSold, or BearRest
---------- Some important evolutions of seasons ----------
OverBought -> CrazyBought: can happen with a breakout
CrazyBought -> OverBought or Bear: could mean fading of a breakout
CrazyBought -> BullRest: can happen after rising over a new level
OverSold -> CrazySold: can happen with a breakdown
CrazySold -> OverSold or Bear: could mean fading of a breakdown
CrazySold -> BearRest: can happen after dropping to a new level
---------- Rainbow Ribbons for multiple time frames ----------
Each ribbon of the rainbow represents a time frame,
The difference between two frames is 1.4142 fold (square root of 2), if level 1 is 15 M, level 2 is 15 * (square root of 2) M. level 3 is 15*2 M, level 4 is 30 * (square root of 2) M, level 5 is 30 * 2 m etc.
The uppermost ribbon represents the smallest time frame - current time period of the chart.
The lower ribbons represent bigger time frames, which work as context.
Examples for time frame rainbow:
For DEMO in 30M: 30M - 42M - 60M(1H) - 85M - 120M(2H) - 170M - 240M(4H) - 339M
For STANDARD in 15M: 15M - 21M - 30M - 42M - 60M(1H) - 85M - 120M(2H) - 170M
For PRO in 15M: 15M - 21M - 30M - 42M - 60M(1H) - 85M - 120M(2H) - 170M - 240M(4H) - 339M - 480M(8H) - 679M
---------- Versions Description ----------
The features may change later, please refer to latest update.
DEMO:
This is DEMO of Standard version for trial purpose, having most the functions except alert preset conditions.
It is applicable to a list of trading instruments and specific time periods(30m-1D), which may change later. please refer to latest updates.
---List of tickers applicable for Demo version.
Currency Index:AXY,BXY,CXY,DXY,EXY,JXY,SXY,ZXY,
Stock Index:SPX,TSX,DAX,NI225,KOSPI,399001,SHCOMP,HSI,XJO,TAIEX,SX5E,
Crypto:BTCUSD
Commodity:BCOUSD,GOLD
STANDARD:
STANDARD version of 9 Seasons Rainbow Indicator is invite-only, with the following advanced features:
8 Ribbon Rainbow lets you discover trading opportunities hidden in the 1.4142 fold time dimension while monitoring market conditions spanning 11 times.
Advanced alert sets allows you set alerts for Overbought, Crazybought, OverSold, CrazySold on upper and lower time frames.
Broad time periods access allows you to watch the market on popular time dimensions from 15M - 1D,2D,3D,4D,5D,6D,1W.
More new features in updates.
PRO:
PRO version of 9 Seasons Rainbow Indicator is invite-only, with the following advanced features:
12 Ribbon Rainbow lets you discover trading opportunities hidden in the 1.4142 fold time dimension while monitoring market conditions spanning 45 times.
Advanced alert sets allows you set alerts for Overbought, Crazybought, OverSold, CrazySold on low, medium, and high time frames.
Option to input different trading instrument to compare with the current ticker.
Full time periods access allows you to watch the market on broadest time dimensions.
More new features in updates.
---------- Access to Indicators ----------
Please contact the author for access to PRO or Standard versions.
---------- About Loading Time ----------
It may take up to 2 minutes for your browser to load a new setting, depending on the your computer and network speed.
---------- List of the author's Indicators ----------
www.tradingview.com
---------- Disclaim ----------
By using or requesting access to this indicator, you acknowledge that you have read and accepted that this indicator is for study purposes only and it does NOT guarantee you will make money.
I am not financial adviser and I am NOT responsible for any profits or losses you may incur by using this indicator!
Users should make their own decisions, carefully assess risks and be responsible for investment and trading activities.
The latest updates override the previous description. Please check the updates.
9季彩虹指标 演示版
具备优秀的模式识别能力吗? 9季彩虹指标检验,提升您的模式识别能力。
市场充满生机。
9季彩虹指标在多个时间维度上显示任何交易品种的9个季节交替,帮助交易者和投资者了解价格流动。
不同时间维度的季节组合可以给出完美的交易信号,例如:在小时间框架和大时间框架上同时出现超买具有很高的卖空交易成功概率。
请安装指标:Demo,STANDARD 或者 PRO 版本. 应用指标到您的交易品种:证券,期货,外汇或者加密货币。找到属于您的盈利模式。
---------- 季节的定义 ----------
牛(绿色),可以演变到牛市回调,超买,熊 或者 中性
牛市回调(淡绿色):可以演变到牛或者熊
超买(黄色),可能刚刚定义了一个头部或者阻力区,可以发生在盘整期,可以演变到狂买或者熊
狂买(亮绿色):高波动性上涨,可以演变到熊,超买或者牛市回调
中性(白色): 没有方向的徘徊期,可以演变到牛或者熊
熊(红色),可以演变到熊市反弹,超卖,牛 或者 中性
熊市反弹(淡红色),可以演变到熊或者牛
超卖(蓝色),可能刚刚定义了一个底部或者支撑,可以发生在盘整期,可以演变到狂卖或者牛
狂卖(紫红色),高波动性下跌,可以演变到牛,超卖 或者熊市反弹
一些重要的季节交替
超买 -> 狂买:可能发生在向上突破时
狂买 -> 熊 或者 超买:可能发生在突破失败时
狂买 -> 牛市回调: 可能发生在上平台后
超卖 -> 狂卖:可能发生在向下突破时
狂卖 -> 牛 或者 超卖:可能发生在突破失败时
狂卖 -> 熊市回调: 可能发生在下平台后
---------- 色带彩虹所代表的时间维度 ----------
每条色带代表一个时间维度。
色带间隔1.4142倍(2的开方),如果第一维度是15分钟,第二维度是15*1.4142=21分钟,第三维度是15*2=30分钟,以此类推。
最上面的色带代表最小的时间维度,也就是目前图表的时间维度
最下面的色带代表最大的时间维度。
例子:
演示版: 30m-42m-60m(1H)-85m-120m(2H)-170m-240m(4H)-339m
标准版: 15m-21m-30m-42m-60m(1H)-85m-120m(2H)-170m
专业版: 15m-21m-30m-42m-60m(1H)-85m-120m(2H)-170m-240m(4H)-339m-480m(8H)-679m
---------- 不同版本功能描述 ----------
这些特征及功能可能会发生变化,以更新为准。
--演示版DEMO
演示版用于标准版的演示和试用,适用于特定的资产列表和时间维度(30M-1D),后续可能调整.
适用的品种列表
AXY,BXY,CXY,DXY,EXY,JXY,SXY,ZXY,
SPX,TSX,DAX,NI225,KOSPI,399001,SHCOMP,HSI,XJO,TAIEX,SX5E,
BTCUSD,BCOUSD,GOLD
---标准版STANDARD特征
8色带彩虹让您发现隐藏在1.4142时间维度的交易机会,同时监控时间跨度达十一倍的市场状态
高级警报功能:允许您在低,高时间层级上设置超买,狂买,超卖,狂卖的警报。
宽时间维度(15分钟到日线级别)让您从更宽阔的视角观察市场
更新中的更多新功能。
---专业版PRO高级特征
12色带彩虹让您发现隐藏在1.4142时间维度的交易机会,同时监控时间跨度达四十五倍的市场状态
高级警报功能:允许您在低,中,高时间帧上设置超买,狂买,超卖,狂卖的警报。
可以输入不同的交易品种用于指标,便于与当前交易品种进行比较。
全时间维度(分钟到日线级别)给您全视角观察市场
更新中的更多新功能。
---------- 获得使用权 ----------
联系指标开发者以取得标准版和专业版的使用权
---------- 开发者的指标列表 ----------
www.tradingview.com
---------- 加载时间 ----------
可能需要2分钟,取决于网络和电脑配置。
---------- 免责声明 ----------
在要求获得本指标使用权之前以及在使用本指标之前,用户认可已经完全了解和接受:本指标仅供教育和研究目的, 它不提供任何赢利的可能性。
本指标的开发者并非专业投资顾问,因此不对用户的任何赢亏负责。
用户应独立判断,审慎评估并自负投资和交易风险!
最近的更新会覆盖之前的说明。 请参阅更新来查看指标的新特征和功能。

MACD Enhanced System MTF with optional TSL and Alerts [LTB]This script is developed to analyse MACD, MACD Signal, MACD Histogram movements by using current and higher time frame. Script calculates higher time frame automatically, no manuel entry. there is trailing stop loss line that is optional.
You can change the parameters as you wish.
btw. you should know that MACD is more successful when there is a trend.
I already shared this as a strategy script. Some ppl wanted to see the code.
You might want to see strategy test =>
by LonesomeTheBlue

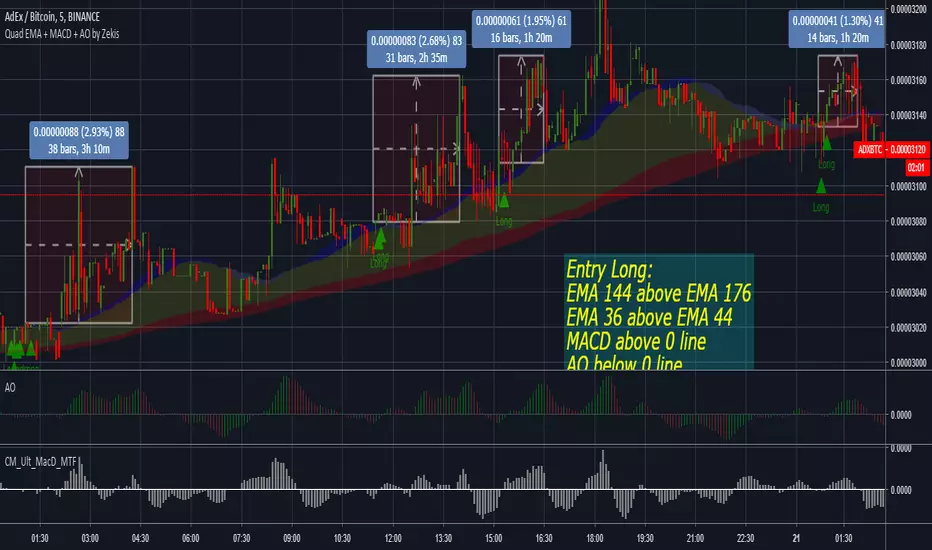
Quadruple EMA + MACD + Awesome Oscillator by ZekisThis strategy is based on quadruple EMAs, MACD and Awesome Oscillator, developed by Nenad Kerkez and simplified by me.
Scalping strategy (lower time frames)
Entry Position
Before we take a buy trade the two above criteria must be met. The 144 EMA must be above the 176 EMA and the 36 EMA must be above the 44 EMA. We then wait for AO to fall below the 0. The final „trigger‟ to the entry is when the MACD closes above the 0 line.
Sell trade is vice versa. 36 EMA must be below 44 EMA and 144 EMA must be below 176 EMA.
TAKE PROFIT and STOP LOSS
10-40 pips. Pivot Point targets.
STOP LOSS above/below last highest high
Enjoy!
@Zekis
Jurik JMA/DWMA MACDHello friends,
Meet the Jurik JMA/DWMA MACD — an oscillator version of the crossover system originally recommended by Mark Jurik. It combines the Jurik Moving Average (JMA) and the Double Weighted Moving Average (DWMA) to form a smooth yet highly responsive convergence/divergence signal.
🛠 How It Works
Unlike standard EMA-based MACDs, this version uses Jurik's advanced non-lagging smoothing method to eliminate noise without sacrificing responsiveness , resulting in exceptionally clear and timely momentum readings.
I use the best original JMA clone available on TradingView — its behavior closely matches the genuine Jurik algorithm.
As Mark Jurik stated:
“Of all the different combinations of moving average filters to use for a MACD oscillator, we prefer using the JMA–DWMA combination.”
This oscillator measures the distance between JMA and DWMA, revealing when short-term momentum diverges from the longer-term trend. The result is a non-lagging MACD-style signal that highlights shifts in trend strength, early reversals, and exhaustion zones — all with Jurik-level smoothness and precision.
🔥 Key Features
Non-lagging, noise-reduced oscillator response
Peak highlighting
Built-in alerts for bullish and bearish peaks
If you'd like access or have any questions, feel free to reach out to me directly via DM.
👋 Good luck and happy trading!
Script pago

EMA DivergenceThis script automatically calculates the divergence between your favorite exponential moving average and the current price (13 ema default).
Additionally, it displays the area in yellow once the first threshold gets reached (1.5% divergence default) and in red once the second threshold gets reached (1.5% divergence default).
MashDMashD has tweaked the simple MACD into having multi-timeframes available, example is on the 4 hour chart, using a 1 hour MACD to catch the crossovers earlier, test it for yourself !
Macd and Rsi 2 in 1The title says it all.
The indicators contains a button that let's you switch between the two popular indicators.