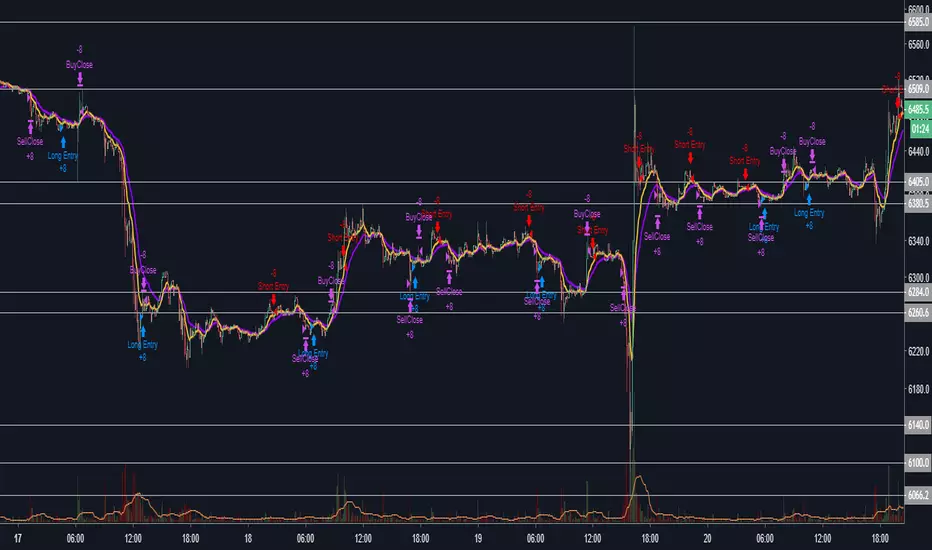
Bitmex Bot 5m candlesThis script was made for our customers to test the strategies of our Bitmex Bot.
I'm not going to give you permission to use the Script, only if you become our client.
Telegram @rmgslash
K-macd
Ergotic MACD Strategy [forked from HPotter]Ergotic MACD Strategy forked from HPotter
In addition to this fine script you will find some additional features:
- Backtester
- Alerts
- Filters: RSI, MFI, Price trend
- Trailing Stop Loss
- Other minor adjustments

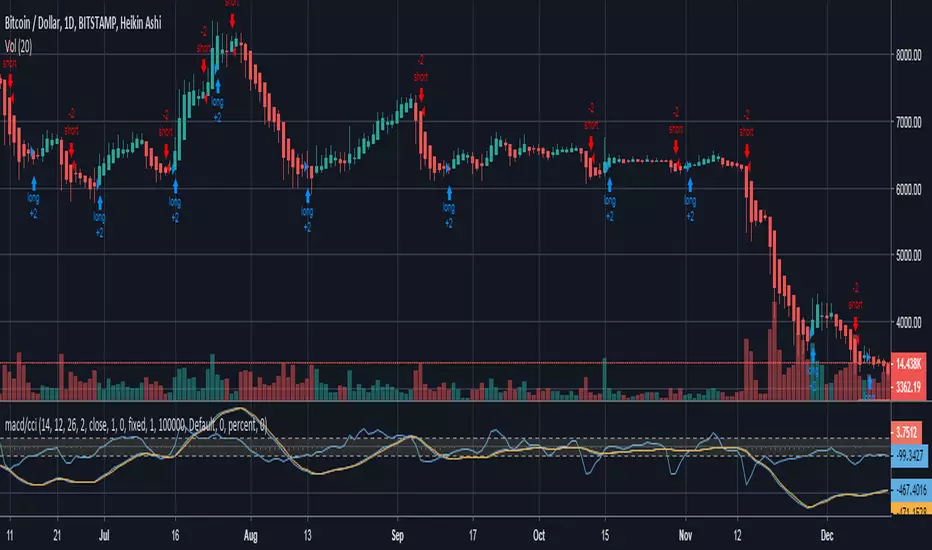
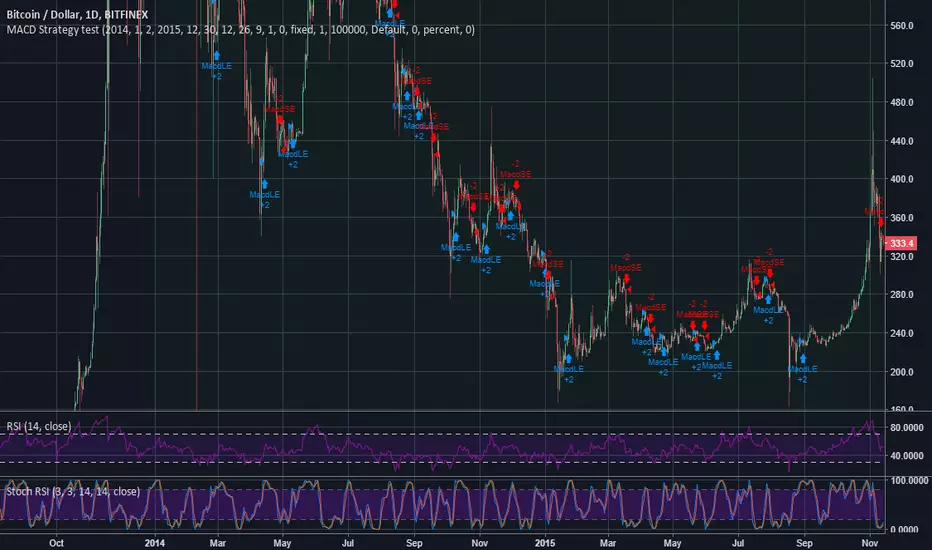
MACD+CCI Strategya simple strategy based on Joseph Nemeth MACD+CCI strategy
Reference reading: sites.google.com
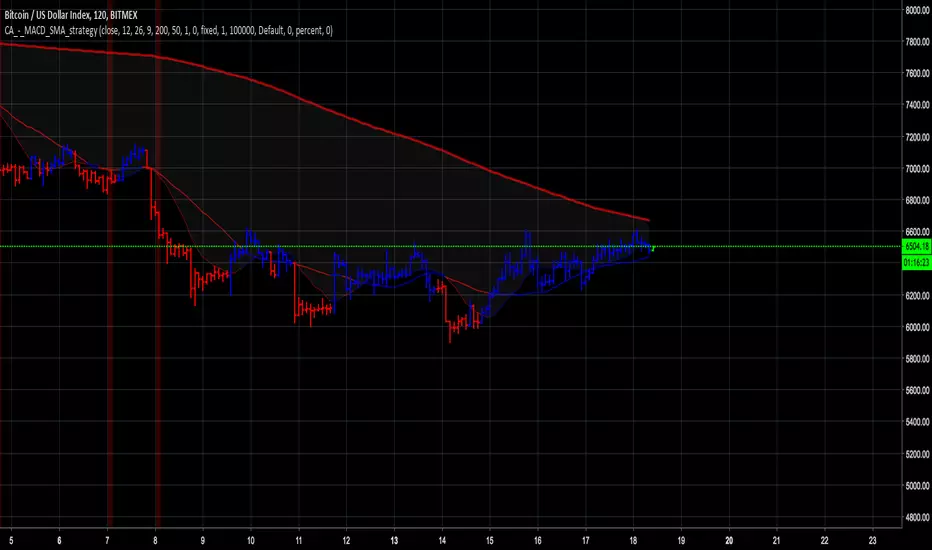
MACD + SMA 200 StrategyHere is a combination of the classic MACD (moving average convergence divergence indicator) with the classic slow moving average SMA with period 200 together as a strategy.
This strategy goes long if the MACD histogram and the MACD momentum are both above zero and the fast MACD moving average is above the slow MACD moving average. As additional long filter the recent price has to be above the SMA 200. If the inverse logic is true, the strategy goes short. For the worst case there is a max intraday equity loss of 50% filter.

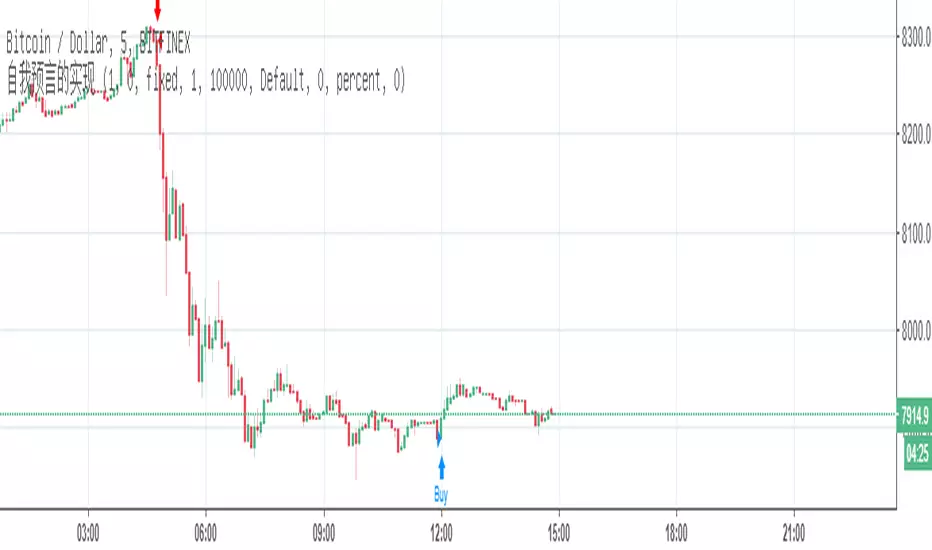
自我预言的实现|The realization of self prophecy这是一个自我预言实现的脚本策略,不会产生重画现象,未调用平台内置函数,纯算法实现
---------------------
This is a self scripting script strategy, which does not generate repainting, and does not invoke the built-in functions of the platform.
Dane: RSI MACD StrategyRSI / MACD Divergence Strategy . Published for customer verification and acceptance. Unfortunately, access can only be provided to the customer.
For those interested in custom development services, please visit the backtest-rookies (.com) website for more information.
Features
RSI & Price divergence detection
Open a trade window when trade conditions are met
Enter the trade on confirmation
Stop losses / take profit custom levels based of daily pivot values

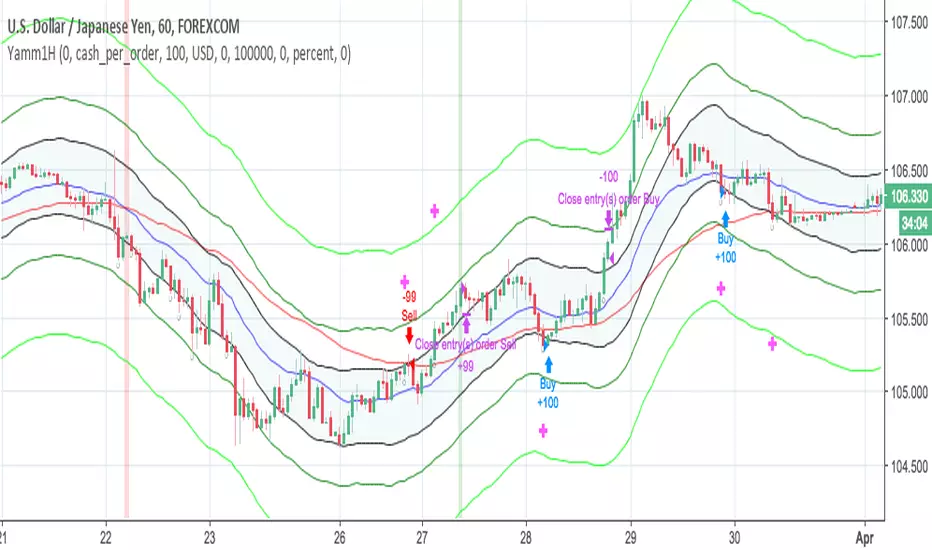
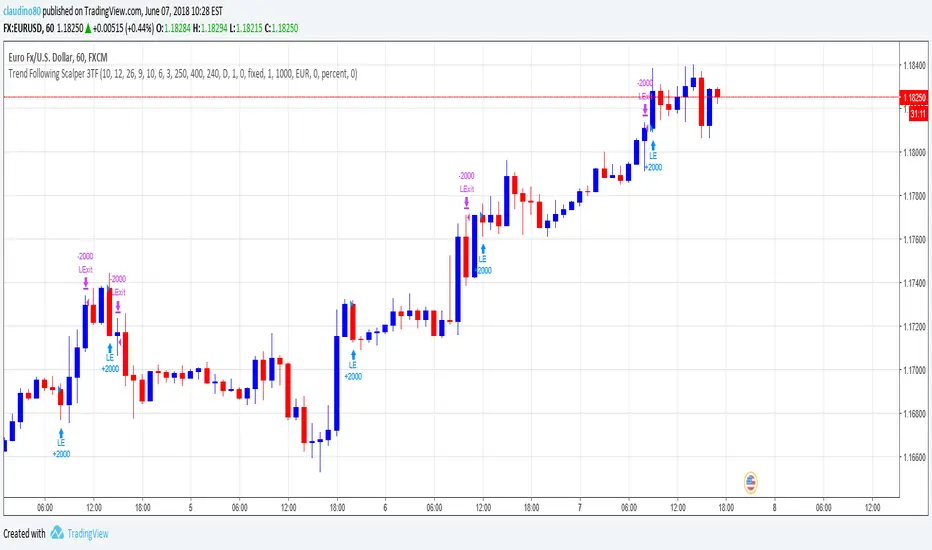
Trend Following Scalper 3 Time FramseDo you think it is a good idea to use the Stochastic / MACD / EMA and cross check THREE timeframes to detect a new trend?
If you think that it would be a good idea, this is the script that you are looking for.
The Trend Following Scalper (3 Time Frames) script has been developed to automate the trading activity by detecting a new trend and by scalping a fixed amount of pips each trade. That is why it is called Trend Following Scalper.
How does the script detect the new trend?
The beginning of the new trend is detected on the lower timeframe (1H is the suggested one) by joining the information of the Stochastic, MACD and Exponential Moving Average.
Once a potential trade has been detected on lower timeframe, the script confirms it by looking the upper timeframe (e.g. Daily + H4) by gathering the same indicator / parameter information.
If the threes timeframes are moving in the same direction, the script open a new trade.
Why do we need to merge lower and higher timeframe before open the trade?
The lower timeframe shows a shorter Price Action context. The short price action context has a short life! By looking at the higher time frames context the script tries to exclude the short life counter-trend moves. At the end, a new trade is open only if the higher timeframe context supports the lower timeframe indication.
What about the Risk-Reward (following RR) ratio?
The RR is set by default as 1.6 (stop loss 25 pips and take profit 40 pips).
This configuration has been heavily tested on multiple crosses and it has shown a good Equity Line with a low Drawdown.
(Note: the stop loss and take profit can be changed by the user via the parameter pages. Suggest RR > 1.5)
What about the accuracy of the Script?
The average script accuracy is > 55% on the H1 time frame (tested with various crosses).
With this accuracy, and by risking 0.6% of the capital each trade, your capital will grow > 25% every 100 trades.
What about the drawdown?
It depends on the capital and the size of the position used on each trade.
For example, with an initial capital of 1000 Euros and by risking 0.6% of the capital each trade, the drawdown is close to 3%.
(The strategy tester result has been calculated starting from January 2017. The strategy produced 527E (i.e. 52% gain) starting from a 1000E capital and risking 0.5% each trade)
Do you want to try the script? Please write me!
Do you have some question? Please write me!
Trend Following Scalper 2 Time FramesDo you think it is a good idea to use the Stochastic / MACD / EMA and cross check TWO timeframes to detect a new trend?
If you think that it would be a good idea, this is the script that you are looking for.
The Trend Following Scalper (2 Time Frames) script has been developed to automate the trading activity by detecting a new trend and by scalping a fixed amount of pips each trade. That is why it is called Trend Following Scalper.
How does the script detect the new trend?
The beginning of the new trend is detected on the lower timeframe (4H is the suggested one) by joining the information of the Stochastic, MACD and Exponential Moving Average.
Once a potential trade has been detected on lower timeframe, the script confirms it by looking the upper timeframe (e.g. Daily) by gathering the same indicator / parameter information.
If both timeframes are moving in the same direction, the script open a new trade.
Why do we need to merge lower and higher timeframe before open the trade?
The lower timeframe shows a shorter Price Action context. The short price action context has a short life! By looking at the higher time frame context the script tries to exclude the short life counter-trend moves. At the end, a new trade is open only if the higher timeframe context supports the lower timeframe indication.
What about the Risk-Reward (following RR) ratio?
The RR is set by default as 1.6 (stop loss 25 pips and take profit 40 pips).
This configuration has been heavily tested on multiple crosses and it has shown a good Equity Line with a low Drawdown.
(Note: the stop loss and take profit can be changed by the user via the parameter pages. Suggest RR > 1.5)
What about the accuracy of the Script?
The average script accuracy is > 45% (tested with various crosses).
With this accuracy, and by risking 0.6% of the capital each trade, your capital will grow > 10% every 100 trades.
What about the drawdown?
It depends on the capital and the size of the position used on each trade.
For example, with an initial capital of 1000 Euros and by risking 0.5% of the capital each trade, the drawdown is close to 6%.
Do you want to try the script? Please write me!
Do you have some question? Please write me!


NGRN MACD-X & RSI v2 STRATEGYMACD-X, RSI & Volume Indicator Strategy - Version 2.0
Overview
This strategy and it's associated study were modeled after the famous Philakone described algorithms on his now defunct instructional video series.
This indicator allows for full customisation of parameters and interaction between three indicators that allow users to shape their trading methods to their desired goals.
This associated strategy also allows users to backtest the study alerts script and find the best settings towards that end.
MACD + RSI + VOLUME - are of the most powerful and widely usded indicators, MACD/Histogram crosses, coupled with RSI & Volume increases/decreases will detects areas of deeply oversold / overbought and buys/sells on the reversal
Features
Full customisation - All parameters are open for customising to allow the trader to build their own strategy and adapt from market to market.
Toggle Buying and Selling, or have them both active at the same time.
Toggle off and on ALTERNATING Buy and Sell feature to allow for consecutive DCA style buys or SCALING out of an entry (partial sell).
Access
Full Access is 0.07 ETH, one time fee for full unlimited access to the indicator, strategy and future updates as well as support and SETTINGS for various markets on the Binance Exchange (currently only USDT)

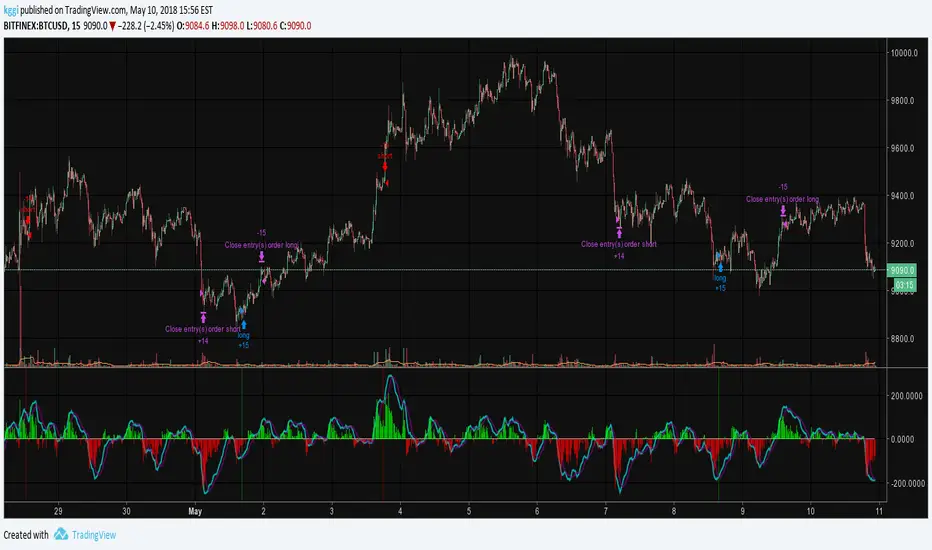
EMA50Diff & MACD StrategyOne of my attempts to create a strategy for BTC.
Its a combination of EMA50Diff (the difference between spot and EMA50) and MACD.
Buy signal if (EMA50Diff) < -(EMADiffThreshold),
(MACD bearish crossunder),
(MACD) < -(MACDThreshold),
(EMA50Diff) > (EMA50Diff 1 candle ago),
(EMA50Diff 1 candle ago) < (EMA50Diff 2 candles ago)
Sell signal if (EMA50Diff) > (EMADiffThreshold),
(MACD bullish crossover),
(MACD) > (MACDThreshold),
(EMA50Diff) < (EMA50Diff 1 candle ago),
(EMA50Diff 1 candle ago) > (EMA50Diff 2 candles ago)
Exit either when target or stoploss get reached.
Initial capital is set to 100k and its currently going all-in on every trade but im looking for a better way to handle position sizes already..
Also i included slippage of 30 ticks and exchange commission of 0.15% (e.g. 2x BitMEX market taker fee)
Works best on 15m on bitfinex, bitstamp and gdax and i'm still trying to optimize it for bitmex too, will update when i got there..
Riz Coloured MACDThis is a souped up common or garden MACD . The Histogram is coloured giving a clear visual representation of where we are UpTicking or DownTicking on the Histogram to help support trading decisions.
When colour changes from pink to green market is bullish , and visa versa.
Very useful as a supporting indicator to confirm other strategies, or even as a standalone strategy to some extent.
Alerts are enabled by converting script from a Strategy to a Study, see comments in code.

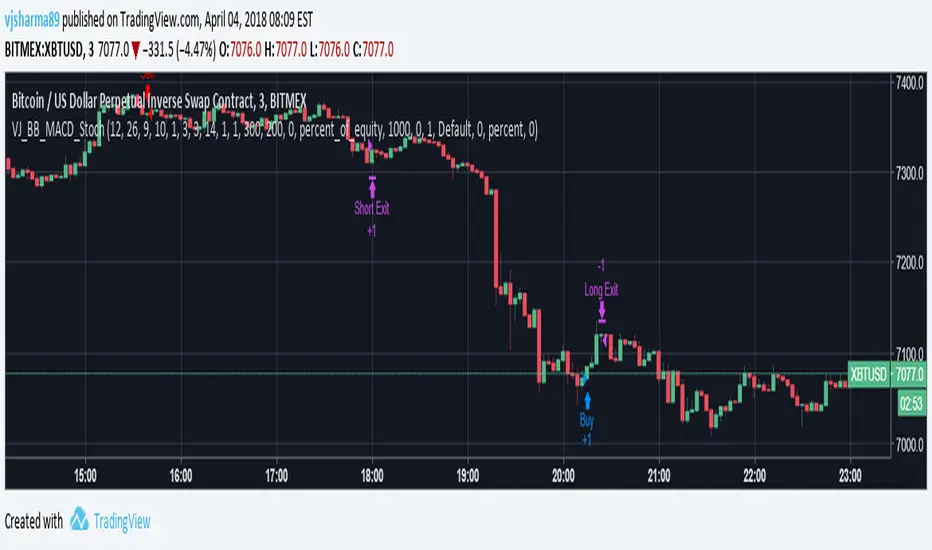
VJSHARMA_BB_MACD_Stoch_Short_Trade_Strategy_V2This script has the same working behind it except for some minor tweaks.
These tweaks enable the script to generate more signals than the previous version but with a loss of 4% accuracy.
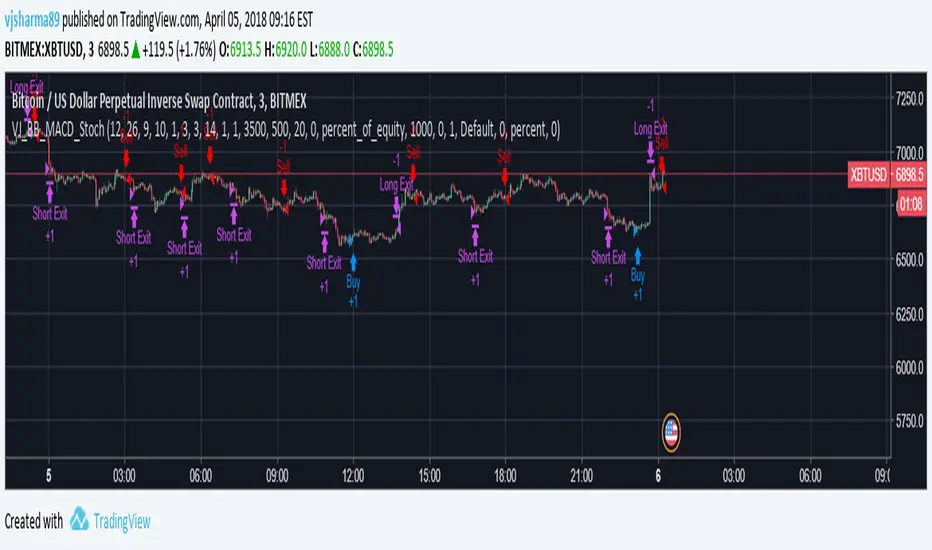
VJSHARMA_BB_MACD_Stoch_Short_Trade_StrategyThis strategy was developed keeping in mind the accuracy of signals. Due to which the time-frame had to be small as in longer timeframe, the probability of a particular movement decreases. The best application of this strategy is with Margin Trading as the signals achieved have really high accuracy.
To get the best out of this strategy, keep in mind the following
1. Choose 3 min time frame
2. Changing the stoploss and trailing stop settings could/would interfere with the accuracy of the trades.
3. Pyramiding affects the profitability of trades.


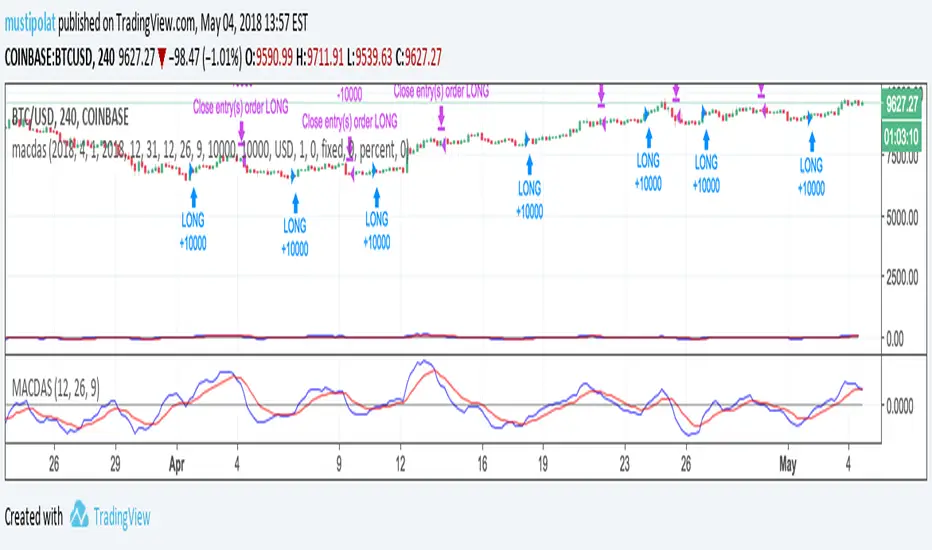
SB_CM_MacD_Ult_MTFThis strategy places the order based on the MACD signal.
Original Indicator: MacD Custom Indicator-Multiple Time Frame+All Available Options! by ChrisMoody
Link to the Indicator:
If your risk appetite is high you can replace the first statement with the below statement:
strategy(title="SB_CM_MacD_Ult_MTF", shorttitle="SB_CM_MacD_Ult_MTF", default_qty_type = strategy.percent_of_equity, default_qty_value = 100, pyramiding = 5)
You can check for repainting. Did not check for that.
Message if you think of any modifications/ enhancements/ any opportunities. :)
Donations/Tips... :) -
BTC: 1BjswGcRR6c23pka7qh5t5k56j46cuyyy2
ETH: 0x64fed71c9d6c931639c7ba4671aeb6b05e6b3781
LTC: LKT2ykQ8QSzzfTDB6Tnsf12xwYPjgq95h4

SB_Elder Impulse SystemThe strategy is based on LazyBear's Elder Impulse System
Strategy(in layman terms):
Long: When the green bar in the Elder Impulse System's indicator shows up
Short: When the red bar in the Elder Impulse System's indicator shows up
Close trade/Profit booking: When the blue bar in the Elder Impulse System's indicator shows up
Original Idea:
Message in the script if you think of any modifications/ enhancements.
Donations/Tips... :) -
BTC: 1BjswGcRR6c23pka7qh5t5k56j46cuyyy2
ETH: 0x64fed71c9d6c931639c7ba4671aeb6b05e6b3781
LTC: LKT2ykQ8QSzzfTDB6Tnsf12xwYPjgq95h4
