WTC Step Buy Step Edition CbyCarlo📊 WT Cross Modified – Step Buy Step Edition (v4)
WTC_StepBuyStep_Edition is an enhanced, practical, and optimized version of the classic WaveTrend (WT) Cross Indicator.
Developed for the Step Buy Step project, this tool helps traders identify market momentum shifts, structural price zones, and potential reversal areas with high clarity and precision.
🔍 Concept & Purpose
This indicator builds upon the established WaveTrend / LazyBear logic and extends it with additional structural intelligence.
The goal is to make overbought/oversold phases and trend reversals easier to spot — while also highlighting historically validated price zones where the market has previously reacted strongly.
⚙️ Key Features
1️⃣ WT Cross Signals
WT1 (yellow) and WT2 (purple) visualize market momentum.
A WT1 cross above WT2 while below the Oversold zone (−53) can indicate potential Long opportunities.
A WT1 cross below WT2 while above the Overbought zone (+53) can indicate potential Short opportunities.
Signals only confirm after candle close to prevent repainting.
2️⃣ Dynamic “WT SignalZone” Panel
Displayed in the top-right corner, this panel shows the last three valid price levels derived from WT signals:
🟢 LonLev – Buy support levels from previous WT Long signals
🔴 ShoLev – Sell resistance levels from previous WT Short signals
These zones act as objective support/resistance structures, based on historical momentum turning points — not subjective lines.
3️⃣ Flexible Calculation Modes
Choose how levels are derived from each WT signal:
Pullback 50% → Midpoint of the signal candle (high+low)/2
Close → Close price of the signal candle
Next Open → Open of the following bar (ideal for system testing)
📈 How to Interpret the Indicator
Market Condition WT Event Meaning
WT1 < −53 & CrossUp Long Signal Potential reversal / buy zone
WT1 > +53 & CrossDown Short Signal Potential exhaustion / sell zone
Price revisits LonLev Support Re-entry or bounce zone
Price revisits ShoLev Resistance Profit-taking or short setup zone
This makes the tool highly effective for:
Swing traders
Zone-based trading strategies
Systematic re-entries
Identifying structural turning points
🧠 Advantages
No repainting (signals confirmed only after bar close)
Works on all timeframes (from intraday to weekly)
Clean overview without clutter or excessive chart markers
Excellent as a filter to confirm market context
💬 Best Use Case
Use WTC_StepBuyStep_Edition as a contextual confirmation tool.
It does not replace a full trading system — but it gives you objective, repeatable, and statistically relevant zones where the market has reacted before.
Combine it with price action, volume analysis, or trend tools for even stronger setups.
© Step Buy Step • Step-Buy-Step.com
Educational trading tool intended for market analysis.
Not financial advice.
K-macd


MTF MACD – 1m / 15m / 1D / 1W//@version=6
indicator("MTF MACD – 1m / 15m / 1D / 1W", overlay=false)
// MACD inputs
fastLen = input.int(12, "Fast length")
slowLen = input.int(26, "Slow length")
signalLen = input.int(9, "Signal length")
// Multi-timeframe MACD using built-in ta.macd()
= request.security(syminfo.tickerid, "1", ta.macd(close, fastLen, slowLen, signalLen))
= request.security(syminfo.tickerid, "15", ta.macd(close, fastLen, slowLen, signalLen))
= request.security(syminfo.tickerid, "D", ta.macd(close, fastLen, slowLen, signalLen))
= request.security(syminfo.tickerid, "W", ta.macd(close, fastLen, slowLen, signalLen))
// Plot MACD lines for each timeframe
plot(macd_1m, title="MACD 1m", color=color.red, linewidth=2)
plot(macd_15m, title="MACD 15m", color=color.blue, linewidth=2)
plot(macd_1d, title="MACD 1D", color=color.green, linewidth=2)
plot(macd_1w, title="MACD 1W", color=color.orange, linewidth=2)
// (Optional) you can uncomment these if you also want signals/histograms:
// plot(signal_1m, title="Signal 1m", color=color.new(color.red, 50), style=plot.style_dotted)
// plot(signal_15m, title="Signal 15m", color=color.new(color.blue, 50), style=plot.style_dotted)
// plot(signal_1d, title="Signal 1D", color=color.new(color.green, 50), style=plot.style_dotted)
// plot(signal_1w, title="Signal 1W", color=color.new(color.orange, 50), style=plot.style_dotted)
// plot(hist_1m, title="Hist 1m", color=color.red, style=plot.style_histogram)
// plot(hist_15m, title="Hist 15m", color=color.blue, style=plot.style_histogram)
// plot(hist_1d, title="Hist 1D", color=color.green, style=plot.style_histogram)
// plot(hist_1w, title="Hist 1W", color=color.orange, style=plot.style_histogram)

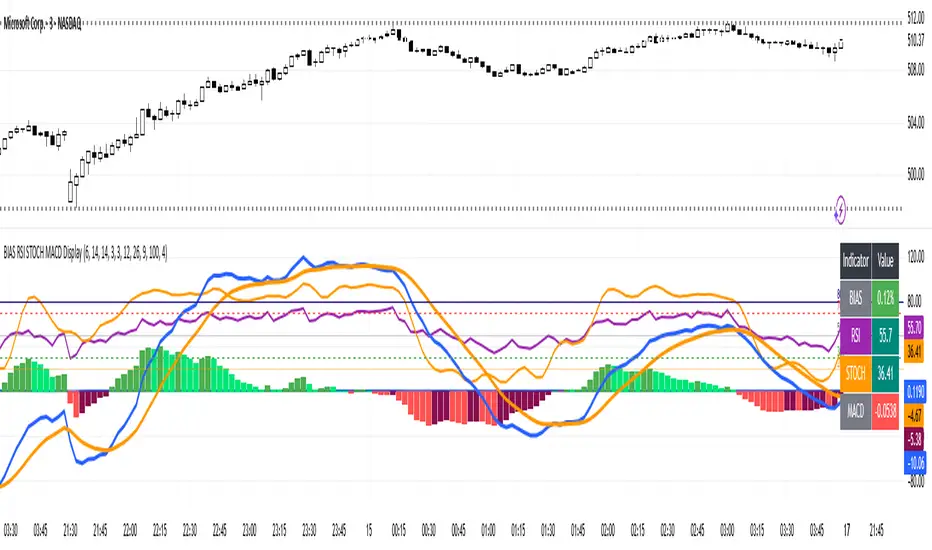
BIAS RSI STOCH MACD Displaysimple but effective to prevent chart clutter.
Hi Traders! Today I’m showing you a **custom indicator** that combines **BIAS, RSI, Stochastic, and MACD** in one easy-to-read panel. Let’s break it down:
1️⃣ **BIAS** – Shows how far the price is from its moving average.
* Positive BIAS → price is above the average.
* Negative BIAS → price is below the average.
2️⃣ **RSI (Relative Strength Index)** – Measures momentum.
* Above 70 → overbought
* Below 30 → oversold
* **50 line added** → midpoint for trend direction
3️⃣ **Stochastic (STOCH)** – Confirms momentum like RSI.
* Above 80 → overbought
* Below 20 → oversold
4️⃣ **MACD (Moving Average Convergence Divergence)** – Shows trend and momentum.
* Histogram colors indicate strength
* Lines show trend direction
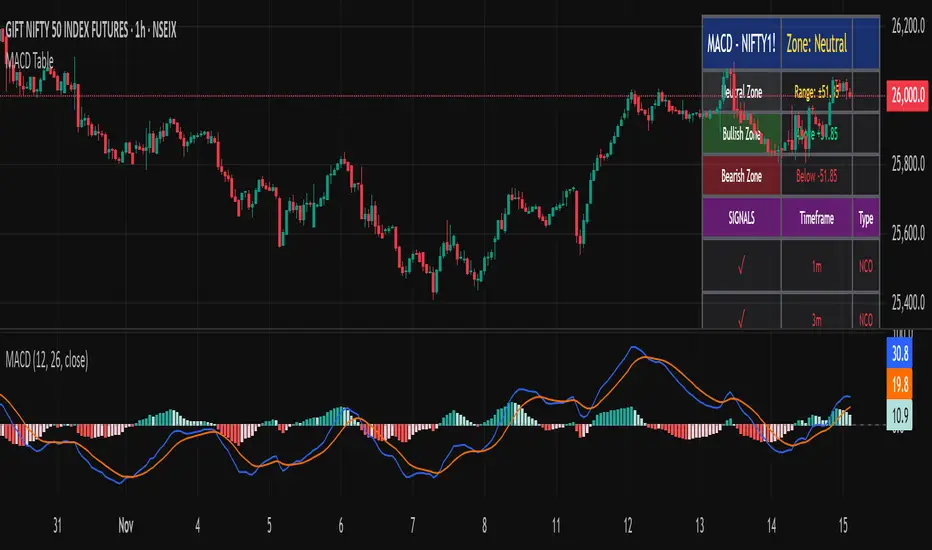
5️⃣ **Visual Table** – On the top right, you can see all current indicator values at a glance, with color coding for easy interpretation.
6️⃣ **Plots & Levels** –
* BIAS, RSI, Stoch are plotted clearly
* RSI has **midline at 50** for trend reference
* Standard overbought/oversold levels highlighted
✅ **How to Use:**
* Look for RSI or Stoch crossing midline or extreme levels for potential entries.
* Check MACD histogram and lines for confirmation of trend strength.
* Use BIAS to see if price is stretched from the moving average.
This indicator is perfect for **momentum, trend, and mean-reversion traders**, giving multiple signals in one pane without clutter.
---
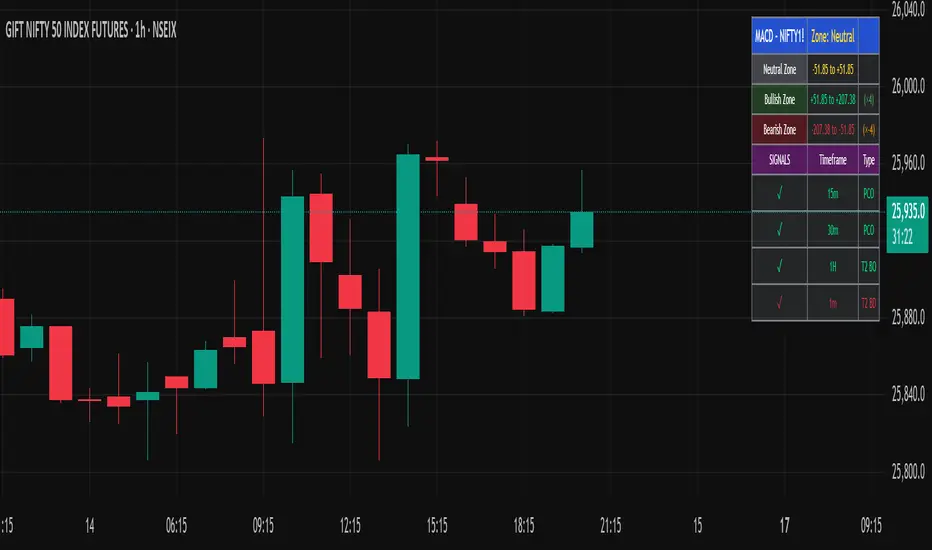
MACD Trend & Momentum Dashboard (Weighted, 3 TFs)This indicator provides a multi-timeframe MACD trend and momentum dashboard that works independently of your current chart timeframe. It displays MACD zero-line bias and MACD-vs-Signal trend state across three user-selectable timeframes, using clear color-coded cells for instant visual interpretation. A weighted scoring system combines all six signals into a single market bias classification (Strong Bullish → Strong Bearish). This helps traders quickly understand higher- and lower-timeframe alignment, market regime, and overall trend quality. Ideal for trend- and momentum-followers who want a clean, actionable market overview at a glance.

Multi-Confluence Signal System📊 OPTIMIZED MULTI-CONFLUENCE SIGNAL SYSTEM
A professional-grade trading indicator that combines multiple technical analysis methods to generate high-probability buy and sell signals. Designed for daily timeframe Bitcoin/crypto trading with optimized parameters based on real market backtesting.
🎯 KEY FEATURES:
- Multi-Confluence Scoring (8 components) - Each signal shows strength rating
- Smart Top & Bottom Detection - Catches reversals using price action patterns
- Ichimoku Cloud Integration - Dynamic support/resistance visualization
- Dual EMA System (20/50) - Clear trend identification
- RSI + MACD + Volume Confirmation - Multi-indicator validation
- Signal Alternation - Only shows directional changes (no repeated signals)
- Minimal Bar Spacing - Prevents signal clustering and overtrading
✅ OPTIMIZED FOR:
- Catching parabolic tops with rejection wicks
- Identifying capitulation bottoms in downtrends
- Avoiding false signals during consolidation
- 4-8 quality signals per 4-month period on daily charts
- Works in both trending and volatile markets
🔧 TECHNICAL COMPONENTS:
- EMA 20/50 trend system
- RSI (14) with adjusted overbought/oversold levels (68/32)
- MACD for momentum confirmation
- Ichimoku Cloud for trend context
- Volume analysis (1.3x threshold)
- Candlestick pattern recognition (engulfing, hammers, shooting stars)
- Capitulation detection for extreme moves
- Price extension filters (±5-10% from EMAs)
⚠️ BEST PRACTICES:
- Optimized for Daily timeframe
- Combine with your own risk management
- Higher scores = higher probability trades
- Wait for signal confirmation on candle close
- Use in conjunction with key support/resistance levels
💡 SIGNAL LOGIC:
BUY signals trigger on: Capitulation candles, extreme oversold + reversal patterns, MACD turnarounds in downtrends, or high confluence scores with bullish patterns
SELL signals trigger on: Rejection wicks at tops, bearish engulfings with overbought RSI, parabolic extensions, MACD reversals, or high confluence scores with bearish patterns
📈 Created through iterative backtesting and optimization on Bitcoin price action from 2024-2025.
⭐ Free to use • Leave feedback • Happy trading!

GSC MACD by TejasThis script is based Mr. Saleel Choudhary, GSC Academy MACD Concepts. This indicator is available only for the GSC Students and No one else.
GSC MACD by TejasThis is an indicator based on Mr. Saleel Choudhary, GSC Academy MACD signals. This indicator is only and only available to GSC Students and Nobody else.
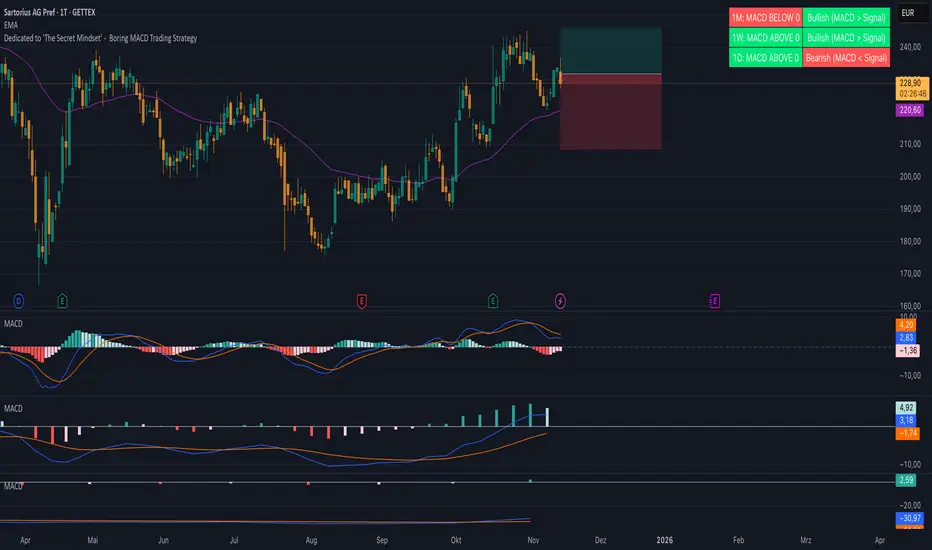
Boring MACD Trading Strategy - Dedicated to 'The Secret Mindset'This indicator displays the MACD status across three selectable timeframes, regardless of the chart timeframe you are currently viewing.
For each timeframe, it shows whether the MACD line is above or below the zero line, indicating bullish or bearish momentum.
It also shows whether the MACD line is above or below the signal line, revealing the current trend condition as bullish, bearish, or neutral.
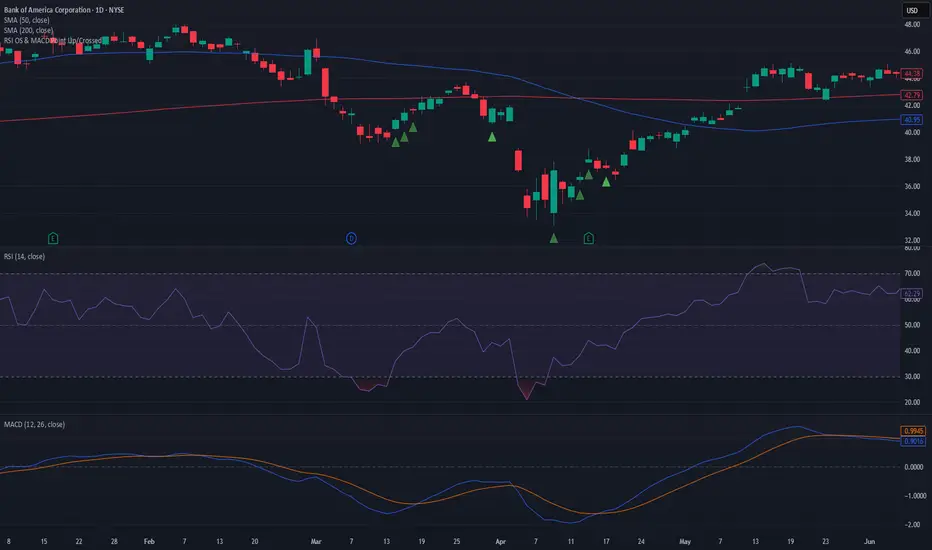
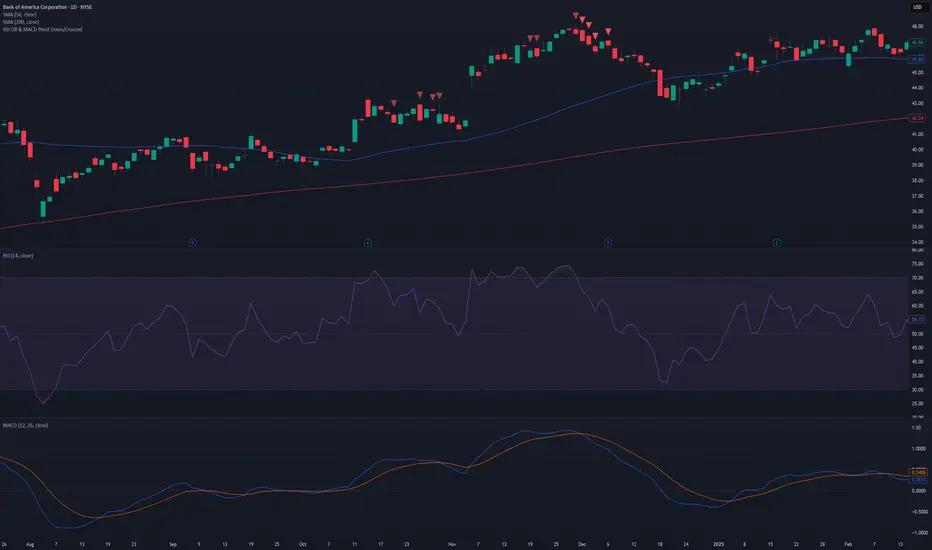
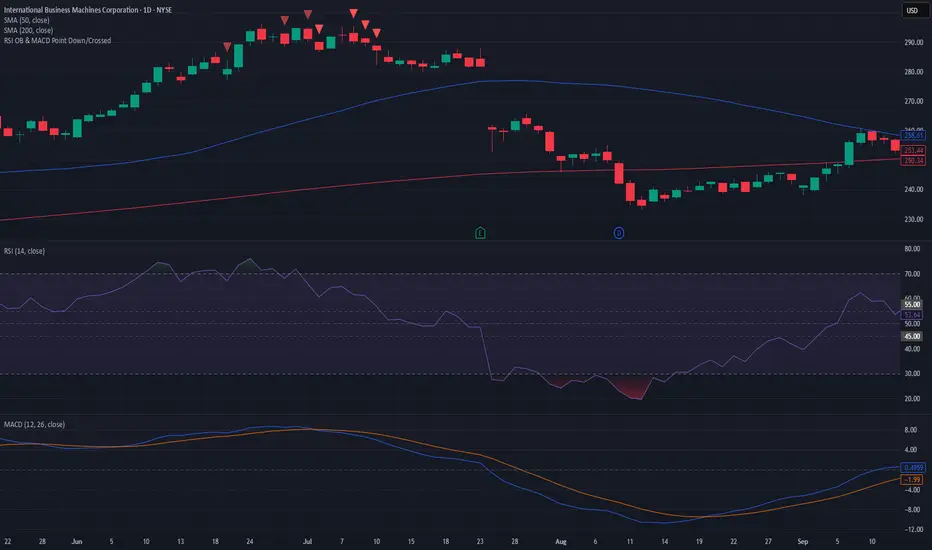
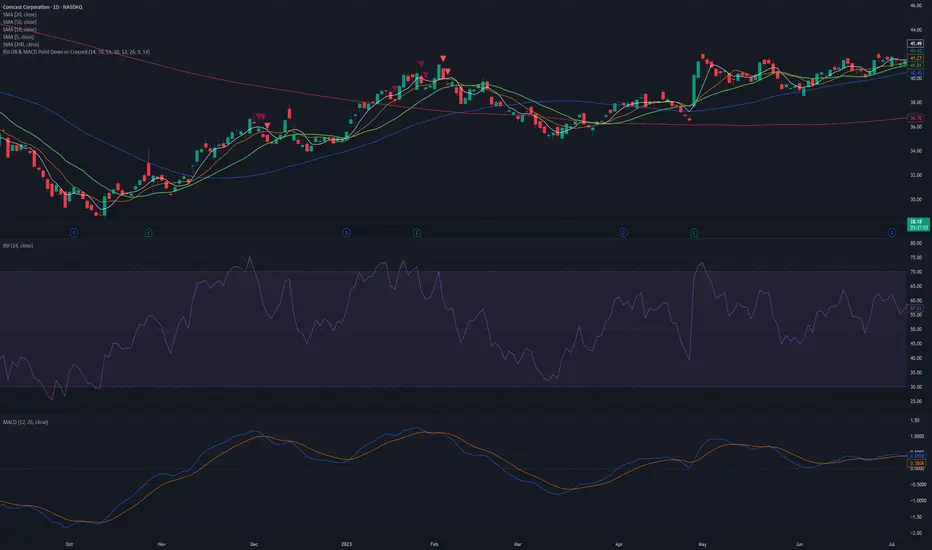
RSI OB & MACD Point Down or Crossed - PSPine script screener indicator for RSI OB and MACD point down or cross.
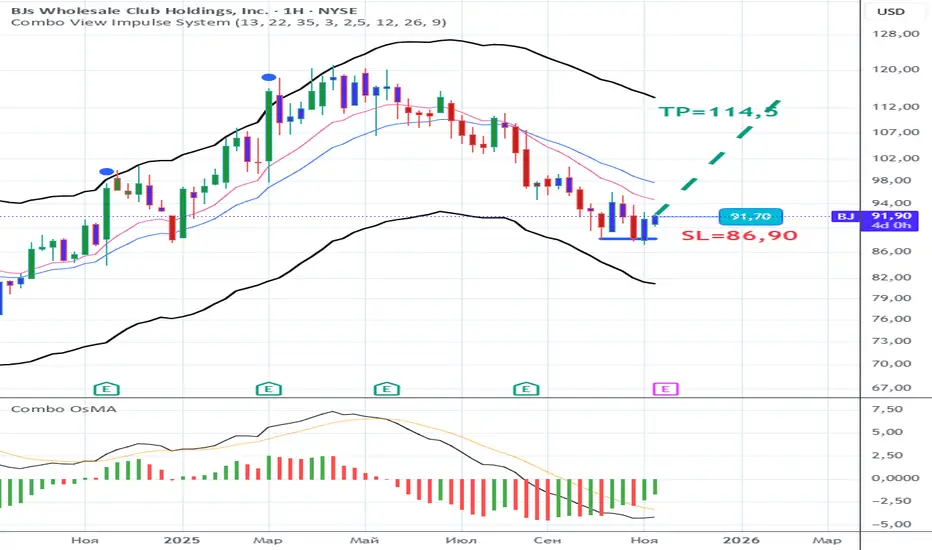
Combo OsMAMACD + OsMA Combo shows classic MACD (12,26,9) lines together with a colored OsMA histogram. Histogram bars change color based on momentum: one color for increasing bars, another for decreasing. Helps visualize trend strength and momentum shifts.

MACD - Ostinato TradingMACD oscillator from Ostinato Trading, the classic momentum indicator. With this particular code you can superpose two different MACD and add a background to display cross of second indicator if you don't want to display it completely.

TPAmacd — Free by TPA OG💎 TPAmacd — Free by TPA OG
Professional Divergence Detection for Confident Technical Analysis
🧭 Overview
TPAmacd is an advanced divergence-analysis tool built for traders who value precision, adaptability, and clarity.
It automatically identifies bullish and bearish divergences on the MACD histogram, confirms momentum shifts, and provides a clean, customizable visual framework — helping you interpret market transitions with greater confidence.
⚙️ Key Features
- Auto-detected Bullish / Bearish Divergences — instantly highlights potential momentum shifts.
- Multi-Timeframe Compatibility — analyze divergences seamlessly across any chart period.
- Histogram Reversal Alerts — get notified as momentum changes direction.
- Customizable Settings — choose between EMA / SMA, set color themes, and adjust visual precision.
- Efficient, Lightweight Design — optimized for clarity and performance on all devices.
📈 Why Traders Choose TPAmacd
- Professional-grade divergence mapping
- Intuitive design — minimal clutter, maximum context
- Adaptable for scalping, swing, or long-term analysis
- Clear alerts and smooth integration with your workflow
⚠️ Important Disclaimer
This script is provided for educational and informational purposes only.
It does not constitute financial, investment, or trading advice.
No indicator, including TPAmacd or any related tools by TPA OG, can guarantee accuracy or profitability.
All trading involves risk, and past performance is not indicative of future results.
Always perform independent analysis and use appropriate risk-management practices before placing any trade.

MACD Remastered [CHE]MACD Remastered — Robust MACD with confirmed pivot-based divergence, optional signal bands, and ready-to-use alerts.
Summary
This indicator augments classic MACD with a robust, confirmed pivot-based divergence engine and an optional signal channel using Bollinger Bands. Divergence signals are only produced after a pivot is confirmed, which reduces noise from transient swings. A line-of-sight clearance check filters cases where the MACD histogram path contradicts the divergence, further cutting false flags. Histogram coloring clarifies momentum changes, while optional triangles project the same signals onto the main chart for quick context.
Motivation: Why this design?
Standard MACD divergence tools tend to fire early in volatile phases and flip during consolidation. The core idea here is to delay decision points until a pivot is confirmed and to validate the path between pivots. This addresses fake flips and improves signal credibility at the cost of some latency. Optional bands around the Signal line add context about compression and expansion without altering MACD’s core behavior.
What’s different vs. standard approaches?
Reference baseline: Classical MACD (fast and slow moving averages, Signal line, histogram) with simple divergence checks.
Architecture differences:
Confirmed pivot logic with left and right bars.
Line-of-sight clearance test across the histogram path between pivots.
Optional Signal-line Bollinger Bands with configurable length and width.
Composite “Any Divergence” alert plus separate regular and hidden alerts.
Optional main-chart triangles using forced overlay for at-a-glance context.
Practical effect: Fewer early or contradictory divergence signals, clearer momentum context via histogram colors and a visible Signal channel during compression and expansion.
How it works (technical)
The MACD line derives from a fast and a slow moving average on a chosen source. The Signal line smooths the MACD line using a selected moving average type and length. The histogram is the difference between MACD and Signal and is colored by direction and acceleration.
Divergence uses confirmed pivots: a pivot forms only after a set number of bars on the right side, so the event is locked in. The engine retrieves the last two relevant pivots and checks price movement versus the MACD histogram movement to classify regular or hidden divergence. A line-of-sight clearance routine traverses the histogram path between the two pivots and rejects the signal if the path invalidates the directional relationship. When enabled, Bollinger Bands are plotted around the Signal line; width scales with standard deviation. Programmatic alerts fire only on confirmed bars. No higher-timeframe requests are used.
Parameter Guide
Oscillator MA Type — Sets fast and slow MA family for MACD. Default: EMA. Tip: EMA is more responsive; SMA is steadier.
Fast Length — Fast MA period. Default: 12. Trade-off: Shorter is quicker but noisier.
Slow Length — Slow MA period. Default: 26. Trade-off: Longer reduces noise but adds lag.
Source — Price input. Default: Close. Tip: Use a stable source for consistency.
Signal MA Type — Moving average family for Signal. Default: EMA.
Signal Length — Smoothing of MACD into Signal. Default: 9. Trade-off: Longer smooths more, reacts slower.
Calculate Divergence — Enables divergence engine. Default: True.
Enable Bollinger Bands on Signal — Adds bands around Signal. Default: False.
BB Length — Sampling window for bands. Default: 20. Active: Only when bands are enabled.
BB StdDev — Band width in standard deviations. Default: 2.0. Bounds: between about zero point zero zero one and fifty.
Pivot Left / Pivot Right — Bars to the left and right that define a confirmed pivot. Default: five and five. Trade-off: Larger values mean stronger but slower pivots.
Min / Max Bars Between Pivots — Valid window between two pivots. Default: five and sixty. Tip: Increase minimum to reduce micro-divergences.
Detect Hidden — Include hidden divergence. Default: True.
Draw Lines — Draw connector lines on the MACD pane. Default: True.
Alerts: Enable / Regular / Hidden / Frequency / Prefix — Control alert emission, categories, cadence, and label. Defaults: Enabled, both categories on, once per bar close, prefix “MACD RM”.
Reading & Interpretation
Histogram: Columns above zero reflect positive momentum; below zero reflect negative momentum. Color shifts indicate momentum increasing or decreasing within each side.
MACD and Signal: Crosses and distance indicate momentum shifts and strength. When bands are enabled, touches and departures hint at compression and expansion around the Signal.
Divergence: Solid green lines and labels indicate regular bullish; solid red indicate regular bearish. Dashed teal and dashed orange denote hidden bullish and hidden bearish. Triangles on the main chart mirror these events for quicker visibility.
Practical Workflows & Combinations
Trend following: Use histogram color transitions with a structure filter such as higher highs and higher lows for long bias, or lower highs and lower lows for short bias. Divergence against the prevailing structure suggests caution or partial exits.
Exits and risk: In a long, regular bearish divergence near resistance can justify scaling out or tightening stops. Hidden divergence in the trend direction can support continuation but should not replace risk controls.
Multi-asset / Multi-timeframe: Works across liquid futures, forex, indices, and large-cap equities. Start with defaults on four-hour and daily; shorten lengths on intraday only when liquidity is strong.
Behavior, Constraints & Performance
Repaint and confirmation: Signals are anchored only after the right-side pivot bars complete; alerts trigger on confirmed bars. This intentionally adds latency to reduce noise.
No higher-timeframe requests: No `security` calls are used; repaint risk is primarily tied to live bars before confirmation.
Resources: Declared `max_bars_back` is five hundred. The divergence path check iterates between pivots, bounded by the maximum bars parameter. Line objects may accumulate; limits are set for lines and labels.
Known limits: Latency at sharp turns, potential misses during fast single-bar reversals, and sensitivity to extremely choppy sessions if minimum gap between pivots is set too low.
Sensible Defaults & Quick Tunin g
Starting point: EMA, twelve and twenty-six with Signal nine; pivots five and five; minimum five, maximum sixty; alerts on close; bands off.
Too many flips: Increase Signal length, raise pivot counts, and increase minimum bars between pivots. Consider disabling hidden divergence.
Too sluggish: Reduce pivot counts, lower Signal length, and enable bands to visualize early compression.
Cluttered chart: Keep lines off and rely on labels and main-chart triangles. Use the alert prefix to route events cleanly.
What this indicator is—and isn’t
This is a visualization and signal layer for MACD with confirmed, path-checked divergence and optional Signal bands. It is not a trading system, not predictive, and not a position management framework. Use it together with structure analysis, liquidity context, and explicit risk controls.
Disclaimer
The content provided, including all code and materials, is strictly for educational and informational purposes only. It is not intended as, and should not be interpreted as, financial advice, a recommendation to buy or sell any financial instrument, or an offer of any financial product or service. All strategies, tools, and examples discussed are provided for illustrative purposes to demonstrate coding techniques and the functionality of Pine Script within a trading context.
Any results from strategies or tools provided are hypothetical, and past performance is not indicative of future results. Trading and investing involve high risk, including the potential loss of principal, and may not be suitable for all individuals. Before making any trading decisions, please consult with a qualified financial professional to understand the risks involved.
By using this script, you acknowledge and agree that any trading decisions are made solely at your discretion and risk.
Do not use this indicator on Heikin-Ashi, Renko, Kagi, Point-and-Figure, or Range charts, as these chart types can produce unrealistic results for signal markers and alerts.
Best regards and happy trading
Chervolino

Ultimate MACD Suite [BigBeluga]🔵 OVERVIEW
The Ultimate MACD Suite is an advanced momentum-based system that enhances the classic MACD with modern features tailored for professional traders.
It transforms MACD into a full market-decision engine — offering multi-timeframe confluence, adaptive histogram behavior, divergence detection, heatmap trend visualization, and actionable reversal signals.
This toolkit goes far beyond standard MACD, helping traders identify trend momentum shifts, exhaustion zones, high-probability reversal areas, and breakout confirmation signals across multiple timeframes simultaneously. It's to be used as part of a major trading system and to simplify usage of the MACD.
⚠️ Note:
This is not a traditional MACD — it uses normalized values , enhanced visual feedback, and a multi-timeframe dashboard engine for superior signal quality and clarity.
🔵 CONCEPTS
Combines MACD momentum, signal-line crossovers, and histogram reversals into one system
Uses normalized scaling to detect extreme momentum levels and exhaustion zones
Multi-timeframe dashboard displays consensus signal alignment across several timeframes
Divergence engine identifies bullish & bearish trend weakening early
Heatmap mode visually distinguishes strong trend phases from neutral or fading momentum
Reversal arrows & crosses highlight actionable turning points on chart
🔵 FEATURES
Normalized MACD Engine — improves signal clarity across all assets/timeframes
MACD Heatmap Mode — color-coded slope intensity for trend strength monitoring
MACD Rising and Falling Mode — color-coded rising and falling MACD regimes
Histogram Reversal Detection — early momentum fade signal before price turns
Signal-Line Momentum Shifts — bullish ▲ & bearish ▼ alerts on cross-confirmation
Overbought/Oversold Bands — enhanced visual thresholds at ±80 levels
Smart Divergence Detection (Non-Lag) — confirms regular bullish & bearish divergences
Multi-Timeframe Dashboard — MACD, signal, histogram & divergence signals across 5+ TFs
Reversal Push-Filter — ensures only clean signals after confirmed momentum inflection
On-Chart Reversal Labels — optional compact signal markers for clean visual execution
Histogram Color Logic — rising/falling or heatmap mode for deeper momentum reading
🔵 HOW TO USE
Look for MACD crossing above signal + green histogram to confirm bullish momentum
Use ▼ and ▲ arrows to catch confirmed momentum reversals
Monitor the dashboard — the more timeframes align, the stronger the setup
Watch divergences for trend exhaustion or reversal setups
Treat histogram trend shifts as early momentum clues before price reacts
Use ±80 levels to identify overheated conditions & fade opportunities
Combine with structure, volume, or BigBeluga liquidity tools for higher accuracy
🔵 ALERTS
The indicator includes a full alert suite for automation and real-time trade readiness:
MACD crossovers (Bullish / Bearish)
Histogram reversals & zero-line shifts
Bullish / Bearish divergence detection
Overbought / Oversold MACD alerts
Bullish ▲ and bearish ▼ reversal triggers
Use these alerts to automate signal monitoring or feed algorithmic systems.
🔵 CONCLUSION
The Ultimate MACD Suite transforms a classic indicator into a powerful trading engine.
With multi-timeframe alignment, heatmapping, divergence logic, normalized scaling and automated signals, it becomes an elite momentum-confirmation and reversal-timing system built for serious traders.
Whether scalping intraday or managing swing positions, this MACD engine helps identify the most profitable phases of trend movement — while warning early when a trend is weakening.
Script pago

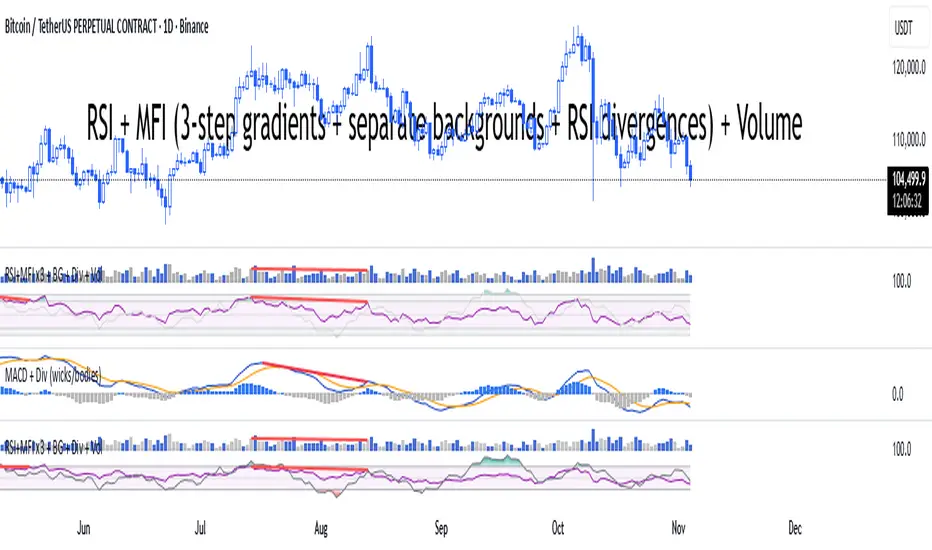
RSI + MFI + VolumeIndicator shows RSI + MFI + Volume in one panel, marks divergences separate for wicks and bodies, green dots shows where MFI and RSI are oversold
MACD (classic) + Divergences (wicks & bodies, fast/slow)macd with divergences. Wicks + bodies. Two settings for right bar

MACD HTF Hardcoded (A/B Presets) + Regimes [CHE] MACD HTF Hardcoded (A/B Presets) + Regimes — Higher-timeframe MACD emulation with acceptance-based regime filter and on-chart diagnostics
Summary
This indicator emulates a higher-timeframe MACD directly on the current chart using two hardcoded preset families and a time-bucket mapping, avoiding cross-timeframe requests. It classifies four MACD regimes and applies an acceptance filter that requires several consecutive bars before a state is considered valid. A small dead-band around zero reduces noise near the axis. An on-chart table reports the active preset, the inferred time bucket, the resolved lengths, and the current regime.
Pine version: v6
Overlay: false
Primary outputs: MACD line, Signal line, Histogram columns, zero line, regime-change alert, info table
Motivation: Why this design?
Cross-timeframe indicators often rely on external timeframe requests, which can introduce repaint paths and added latency. This design provides a deterministic alternative: it maps the current chart’s timeframe to coarse higher-timeframe buckets and uses fixed EMA lengths that approximate those views. The dead-band suppresses flip-flops around zero, and the acceptance counter reduces whipsaw by requiring sustained agreement across bars before acknowledging a regime.
What’s different vs. standard approaches?
Baseline: Classical MACD with user-selected lengths on the same timeframe, or higher-timeframe MACD via cross-timeframe requests.
Architecture differences:
Hardcoded A and B length families with a bucket map derived from the chart timeframe.
No `request.security`; all calculations occur on the current series.
Regime classification from MACD and Histogram sign, gated by an acceptance count and a small zero dead-band.
Diagnostics table for transparency.
Practical effect: The MACD behaves like a slower, higher-timeframe variant without external requests. Regimes switch less often due to the dead-band and acceptance logic, which can improve stability in choppy sessions.
How it works (technical)
The script derives a coarse bucket from the chart timeframe using `timeframe.in_seconds` and maps it to preset-specific EMA lengths. EMAs of the source build MACD and Signal; their difference is the Histogram. Signs of MACD and Histogram define four regimes: strong bull, weak bull, strong bear, and weak bear. A small, user-defined band around zero treats values near the axis as neutral. An acceptance counter checks whether the same regime persisted for a given number of consecutive bars before it is emitted as the filtered regime. A single alert condition fires when the filtered regime changes. The histogram columns change shade based on position relative to zero and whether they are rising or falling. A persistent table object shows preset, bucket tag, resolved lengths, and the filtered regime. No cross-timeframe requests are used, so repaint risk is limited to normal live-bar movement; values stabilize on close.
Parameter Guide
Source — Input series for MACD — Default: Close — Using a smoother source increases stability but adds lag.
Preset — A or B length family — Default: “3,10,16” — Switch to “12,26,9” for the classic family mapped to buckets.
Table Position — Anchor for the info table — Default: Top right — Choose a corner that avoids covering price action.
Table Size — Table text size — Default: Normal — Use small on dense charts, large for presentations.
Dark Mode — Table theme — Default: Enabled — Match your chart background for readability.
Show Table — Toggle diagnostics table — Default: Enabled — Disable for a cleaner pane.
Zero dead-band (epsilon) — Noise gate around zero — Default: Zero — Increase slightly when you see frequent flips near zero.
Acceptance bars (n) — Bars required to confirm a regime — Default: Three — Raise to reduce whipsaw; lower to react faster.
Reading & Interpretation
Histogram columns: Above zero indicates bullish pressure; below zero indicates bearish pressure. Darker shade implies the histogram increased compared with the prior bar; lighter shade implies it decreased.
MACD vs. Signal lines: The spread corresponds to histogram height.
Regimes:
Strong bull: MACD above zero and Histogram above zero.
Weak bull: MACD above zero and Histogram below zero.
Strong bear: MACD below zero and Histogram below zero.
Weak bear: MACD below zero and Histogram above zero.
Table: Inspect active preset, bucket tag, resolved lengths, and the filtered regime number with its description.
Practical Workflows & Combinations
Trend following: Use strong bull to favor long exposure and strong bear to favor short exposure. Use weak states as pullback or transition context. Combine with structure tools such as swing highs and lows or a baseline moving average for confirmation.
Exits and risk: In strong trends, consider exiting partial size on a regime downgrade to a weak state. In choppy sessions, increase the acceptance bars to reduce churn.
Multi-asset / Multi-timeframe: Works on time-based charts across liquid futures, indices, currencies, and large-cap equities. Bucket mapping helps retain a consistent feel when moving from lower to higher timeframes.
Behavior, Constraints & Performance
Repaint/confirmation: No cross-timeframe requests; values can evolve intrabar and settle on close. Alerts follow your TradingView alert timing settings.
Resources: `max_bars_back` is set to five thousand. Very large resolved lengths require sufficient history to seed EMAs; expect a warm-up period on first load or after switching symbols.
Known limits: Dead-band and acceptance can delay recognition at sharp turns. Extremely thin markets or large gaps may still cause brief regime reversals.
Sensible Defaults & Quick Tuning
Start with preset “3,10,16”, dead-band near zero, and acceptance of three bars.
Too many flips near zero: increase the dead-band slightly or raise the acceptance bars.
Too sluggish in clean trends: reduce the acceptance bars by one.
Too sensitive on fast lower timeframes: switch to the “12,26,9” preset family or raise the acceptance bars.
Want less clutter: hide the table and keep the alert.
What this indicator is—and isn’t
This is a visualization and regime layer for MACD using higher-timeframe emulation and stability gates. It is not a complete trading system and does not generate position sizing or risk management. Use it with market structure, execution rules, and protective stops.
Disclaimer
The content provided, including all code and materials, is strictly for educational and informational purposes only. It is not intended as, and should not be interpreted as, financial advice, a recommendation to buy or sell any financial instrument, or an offer of any financial product or service. All strategies, tools, and examples discussed are provided for illustrative purposes to demonstrate coding techniques and the functionality of Pine Script within a trading context.
Any results from strategies or tools provided are hypothetical, and past performance is not indicative of future results. Trading and investing involve high risk, including the potential loss of principal, and may not be suitable for all individuals. Before making any trading decisions, please consult with a qualified financial professional to understand the risks involved.
By using this script, you acknowledge and agree that any trading decisions are made solely at your discretion and risk.
Do not use this indicator on Heikin-Ashi, Renko, Kagi, Point-and-Figure, or Range charts, as these chart types can produce unrealistic results for signal markers and alerts.
Best regards and happy trading
Chervolino
