Session, Weekly, Daily LevelsScroll down for hungarian description!
Magyar leíráshoz görgess lejjebb!
Overview
This script provides a unified market structure mapping tool that automatically identifies and visualizes key intraday, daily, and weekly reference levels. It helps traders contextualize price action throughout the trading week by marking true session opens, previous day highs/lows, weekly highs/lows, and weekday opens, all with accurate historical anchoring and correct timezone handling.
What This Script Does
1. Intraday Session Opens (Tokyo, London, New York)
- Detects the exact candle where each session opens.
- Draws horizontal rays with labels.
- Automatically clears lines at the start of each new day.
- Uses a custom local-to-exchange timezone conversion system.
2. Weekly Levels
- Last week high and low (precise bar anchoring, not HTF aggregation)
- Current week open (also Monday open)
- Auto-reset on new week
- Levels are always drawn from the true candle where they formed.
3. Previous Day High & Low
- Continuously tracks intraday highs and lows.
- On a new day, stores yesterday’s values and anchors rays to the exact bars.
- Levels remain visible for the full current day and reset the next day.
4. Weekday Opens (Tue–Fri)
- Captures the exact opening price of Tuesday–Friday.
- Monday open = Week open, so it is not shown separately.
- Auto-reset on new week.
Timezone Logic (Original Feature)
The script converts:
local session times → exchange timezone → chart timestamps
It works correctly regardless of chart timezone or instrument exchange location.
Line Drawing Logic
- Finds the exact bar_index where each level forms.
- Draws rays extending to the right.
- Labels are placed ahead of price.
- Safe updating prevents “bar index too far” errors.
How to Use
- Identify daily/weekly structure.
- Track bias relative to session opens.
- Observe reactions around weekday opens.
- Compare price action to last week's range.
Originality
- Custom timezone conversion engine.
- True historical bar anchoring.
- Fully automated weekly/daily structural resets.
- Independent styling for each level type.
- Not a mashup; all components follow one unified logic.
Limitations
- Does not predict trend or direction.
- Structural tool only.
Summary
A precise and reliable market structure tool that unifies weekly, daily, and intraday reference levels with full timezone automation and true-candle anchoring.
MAGYAR LEÍRÁS
--------------
Áttekintés
Ez az indikátor egy összetett piaci szerkezet-feltérképező eszköz, amely automatikusan megjeleníti a legfontosabb intraday, napi és heti referenciaértékeket. A célja, hogy a kereskedő tisztán lássa a piac aktuális környezetét: hol nyíltak a főbb devizapiaci szekciók, hogyan alakult a tegnapi tartomány, hol volt a múlt heti csúcs/mélypont, és hogyan nyitottak az egyes hétköznapok.
Mit tud a script?
1. Szekciónyitások (Tokyo, London, New York)
- Megkeresi a pontos gyertyát, amely a szekciónyitáskori árat tartalmazza.
- Vízszintes vonalat és címkét rajzol.
- Minden nap elején automatikusan törli a korábbi nap szintjeit.
- Egyedi időzóna-konverziós rendszerrel működik (helyi idő → tőzsdei idő → chart idő).
2. Heti szintek
- Múlt heti maximum és minimum (pontos gyertyapontra horgonyozva)
- Aktuális heti nyitóár (egyben a hétfői nyitó is)
- Új hét kezdetekor automatikusan frissül.
- A múlt heti high/low nem fix időpontra, hanem a valódi gyertyára kerül.
3. Előző napi High és Low
- Folyamatosan követi a napi maximumot és minimumot.
- Napváltáskor elmenti és pontos gyertyáról indítja a ray-t.
- A szintek a teljes nap folyamán megmaradnak, majd a következő nap törlődnek.
4. Hétköznapok nyitóárai (Kedd–Péntek)
- A kedd, szerda, csütörtök és péntek nyitóárát rögzíti és megjeleníti.
- A hétfői nyitó a Week Open, ezért külön nem jelenik meg.
- Heti váltáskor automatikusan törlődnek.
Időzóna-kezelés (egyedi megoldás)
A script a felhasználó helyi idejét átszámítja az instrumentum tőzsdei időzónájára, majd a chartra vetíti.
Ez biztosítja, hogy minden szekciónyitás helyesen jelenik meg, bármely chart vagy instrumentum esetén.
Vonalrajzolási logika
- A szintek a valódi bar_index alapján kerülnek rögzítésre.
- Jobbra nyúló ray-eket rajzol.
- A címkék mindig a jobb oldalon, előre helyezve jelennek meg.
- Biztonságos frissítési rendszer akadályozza meg a hibákat (pl. “bar index too far”).
Használat
- Napi/heti szerkezet meghatározása.
- Bias követése a session openekhez viszonyítva.
- Reakciók figyelése a hétköznapok nyitóárai körül.
- Összevetés a múlt heti tartománnyal.
Eredetiség
- Egyedi időzóna-kezelő motor.
- Igazi gyertyapont-alapú horgonyzás.
- Automatikus napi/heti reset.
- Minden szint külön stílusban konfigurálható.
- Nem mashup; egységes rendszer.
Összegzés
Professzionális, pontos eszköz a piaci szerkezet feltérképezésére, amely egyesíti a heti, napi és intraday szinteket, teljes időzóna-automatizálással és gyertyapontra horgonyzott kijelölésekkel.
Intraday-trading

Session AnchorsDescription
This indicator highlights the four main global trading sessions — London, New York AM, New York PM, and Asia — as color-coded boxes on the chart. Each session is defined by fixed start/end times (New York time) and dynamically updates with the evolving high and low during that interval. This provides a clear view of how volatility and structure shift as trading activity passes from one region to another.
How to use
• Works on any timeframe.
• Toggle sessions on/off based on your trading hours.
• Observe price behavior as one session closes and another opens.
• Use session boxes as context for liquidity, volatility, and structure analysis.
Originality
This script delivers a clean, customizable visualization of global market hours and session ranges, avoiding extra overlays so traders can isolate session-based behavior without distraction.
⚠️ Disclaimer
This indicator does not generate signals. It provides a structural mapping of global sessions for contextual analysis only.

Candle close on high time frameOVERVIEW
This indicator plots persistent closing levels of higher time frame candles (H1, H4, and Daily) on the active intraday chart in real time. Unlike similar tools, it offers granular control over line projection length, fully independent toggles per timeframe, and a built-in mechanism that automatically limits the total number of historical levels to avoid chart clutter and performance issues.
CONCEPTS
Key levels from higher time frames often act as areas where price reacts or consolidates. By projecting each candle's exact closing price forward as a horizontal reference, traders can quickly identify dynamic support and resistance zones relevant to the current price action. This indicator enables seamless multi-timeframe analysis without the need to manually switch chart intervals or re-draw lines.
FEATURES
Independent Time Frame Selection: Enable or disable H1, H4, and Daily levels individually to tailor the analysis.
Custom Extension Length: Each timeframe's closing level can be projected forward for a user-defined number of bars.
Performance Optimization: The script maintains an internal limit (default: 100) on the number of active lines. When this threshold is exceeded, the oldest lines are removed automatically.
Visual Differentiation: Colors for each timeframe are fully customizable, enabling immediate recognition of level origin.
Immediate Update: New levels appear as soon as a higher timeframe candle closes, ensuring real-time reference.
USAGE
From the indicator inputs, select which timeframes you want to track.
Adjust the extension lengths to fit your trading style and time horizon.
Customize the line colors for clarity and personal preference.
Use these projected levels as part of your confluence criteria for entries, exits, or stop placement.
Combine with trend indicators or price action tools to enhance your multi-timeframe strategy.
ORIGINALITY AND ADDED VALUE
While similar scripts exist that plot higher timeframe levels, this implementation differs in:
Its efficient automatic cleanup of old lines to preserve chart performance.
The independent extension and color settings per timeframe.
Immediate reaction to new candle closes without repainting.
Simplicity of use combined with precise customization.
This combination makes it a practical and flexible tool for traders who rely on clear HTF level visualization without manual drawing or the limitations of built-in TradingView tools.
LICENSE
This script is published open-source under the Mozilla Public License 2.0.

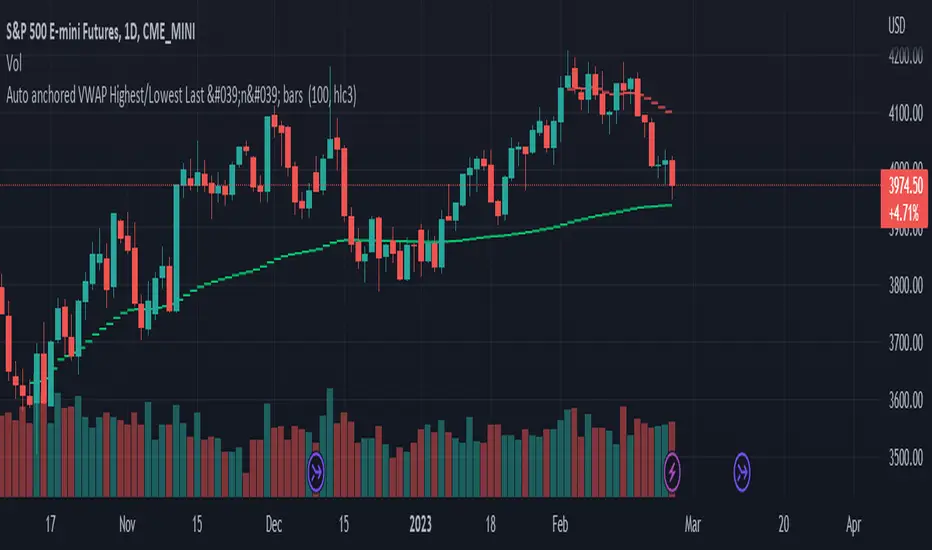
Auto anchored VWAP Highest/Lowest Last 'n' bars The VWAP (Volume Weighted Average Price) indicator is used to calculate the average price weighted by volume. This indicator is designed to automatically draw VWAPs from the highest and lowest points of the last 'n' bars.
It utilizes arrays to calculate the values of VWAP and plot it on the chart on the last historical bar. This version was coded to get a similar version to the official "VWAP Auto anchored" with the highest/lowest selected settings.
To use VWAP, traders can look for price movements relative to the VWAP line to identify potential support or resistance levels. It can also be used in conjunction with other technical indicators to develop trading strategies.