Walk Forward PatternsINTRO
In Euclidean geometry, every mathematical output has a planar projection. 'Walk Forward Patterns' can be considered a practical example of this concept. On the other hand, this indicator might also be viewed as an experiment in 'how playing with Lego as a child contributes to time series analysis' :)
OVERVIEW
This script dynamically generates the necessary optimization and testing ranges for Walk Forward Analysis based on user-defined bar count and length inputs. It performs automatic calculations for each step, offers 8 different window options depending on the inputs, and visualizes the results dynamically. I should also note that most of the window models consist of original patterns I have created.
ADDITIONAL INFO : WHAT IS WALK FORWARD ANALYSIS?
Although it is not the main focus of this indicator, providing a brief definition of Walk Forward Analysis can be helpful in correctly interpreting the results it generates. Walk Forward Analysis (WFA) is a systematic method for optimizing parameters and validating trading strategies. It involves dividing historical data into variable segments, where a strategy is first optimized on an in-sample period and then tested on an out-of-sample period. This process repeats by shifting the windows forward, ensuring that each test evaluates the strategy on unseen data, helping to assess its robustness and adaptability in real market conditions.
ORIGINALITY
There are very few studies on Walk Forward Analysis in TradingView. Even worse, there are no any open-source studies available. Someone has to start somewhere, I suppose. And in my personal opinion, determining the optimization and backtest intervals is the most challenging part of WFA. These intervals serve as a prerequisite for automated parameter optimization. I felt the need to publish this pattern module, which I use in my own WFA models, partly due to this gap on community scripts.
INDICATOR MECHANICS
To use the indicator effectively, you only need to perform four simple tasks:
Specify the total number of bars in your chart in the 'Bar Index' parameter.
Define the optimization (In-Sample Test) length.
Define the testing (Out-Of-Sample Test) length.
Finally, select the window type.
The indicator automatically models everything else (including the number of steps) based on your inputs. And the result; you now have a clear idea of which bars to use for your Walk Forward tests!
A COMMONLY USED WINDOW SELECTION METHOD: ROLLING
A more concrete definition of Walk Forward Analysis, specifically for the widely used Rolling method, can be described as follows:
Parameters that have performed well over a certain period are identified (Optimization: In-Sample).
These parameters are then tested on a shorter, subsequent period (Backtest: Out-of-Sample).
The process is repeated forward in time (At each step, the optimization and backtest periods are shifted by the backtest length).
If the cumulative percentage profit obtained from the backtest results is greater than half of the historical optimization profit, the strategy is considered "successful."
If the strategy is successful, the most recent (untested) optimization values are used for live trading.
OTHER WINDOW OPTIONS
ANCHORED: That's a pattern based on progressively expanding optimization ranges at each step. Backtest ranges move forward in a staircase-like manner.
STATIC: Optimization ranges remain fixed, while backtest ranges are shifted forward.
BLOCKED: Optimization ranges are shifted forward in groups of three blocks. Backtest ranges are also shifted in a staircase manner, even at the cost of creating gaps from the optimization end bars.
TRIANGULAR: Optimization ranges are shifted forward in triangular regions, while backtest ranges move in a staircase pattern.
RATIO: The optimization length increases by 25% of the initial step’s fixed length at each step. In other words, the length grows by 25% of the first step's length incrementally. Backtest ranges always start from the bar where the optimization ends.
FIBONACCI: A variation of the Ratio method, where the optimization shift factor is set to 0.618
RANDOM WALK
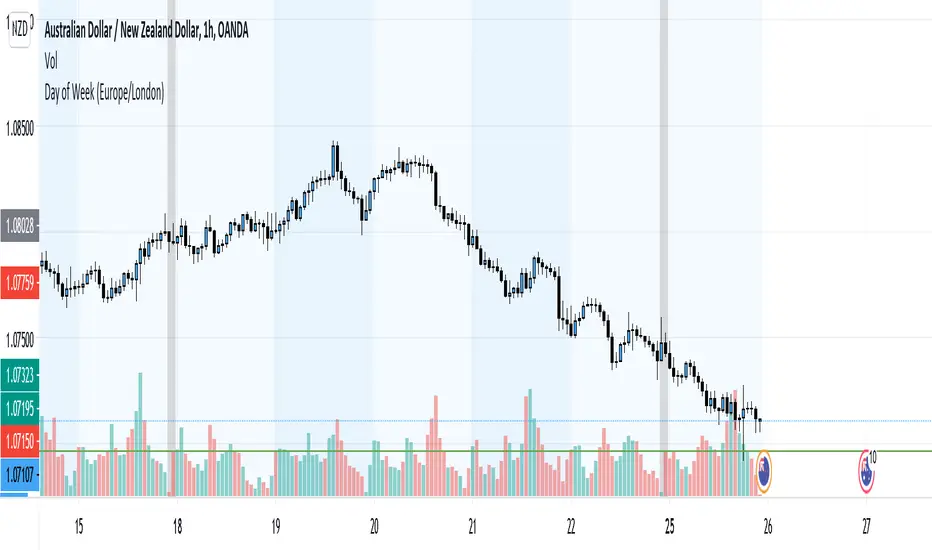
Unlike the window models explained above, we can also generate optimization and backtest ranges completely randomly—offering almost unlimited variations! When you select the "Random" option in the "Window" parameter on the indicator interface, random intervals are generated based on various trigonometric calculations. By changing the numerical value in the '🐒' parameter, you can create entirely unique patterns.
WHY THE 🐒 EMOJI?
Two reasons.
First, I think that as humanity, we are a species of tailless primates who become happy when we understand things :). At least evolutionarily. The entire history of civilization is built on the effort to express the universe in a scale we can comprehend. 'Knowledge' is an invention born from this effort, which is why we feel happiness when we 'understand'. Second, I can't think of a better metaphor for randomness than a monkey sitting at a keyboard. See: Monkey Test.
Anyway, I’m rambling :)
NOTES
The indicator generates results for up to 100 steps. As the number of steps increases, the table may extend beyond the screen—don’t forget to zoom out!
FINAL WORDS
I haven’t published a Walk Forward script yet . However, there seem to be examples that can perform parameter optimization in the true sense of the word, producing more realistic results without falling into overfitting in my library. Hopefully, I’ll have the chance to publish one in the coming weeks. Sincerely thanks to Kıvanç Özbilgiç, Robert Pardo, Kevin Davey, Ernest P. Chan for their inspiring publishments.
DISCLAIMER
That's just a script, nothing more. I hope it helps everyone. Do not forget to manage your risk. And trade as safely as possible. Best of luck!
© dg_factor
Interval

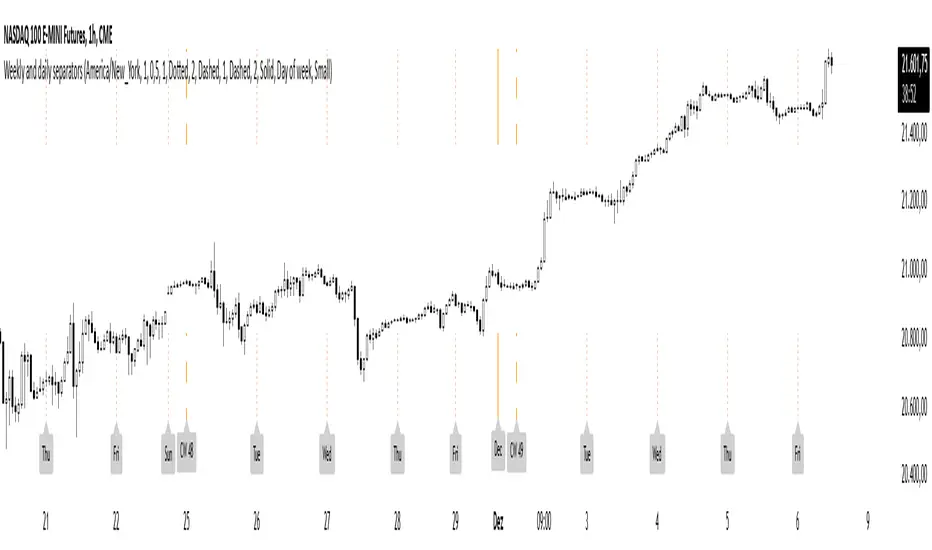
Weekly and daily separatorsThis script plots vertical line between each trading week (thick, solid) and smaller lines (dotted) between each trading day. This helps kepping a better overview on the aspect of time on the higher timeframes below 1D. The distance of the lines to the top and bottom of the chart is controlled by your chart settings menu under Appearance -> Margins.
CC - Array-meta Consolidated Interval Display (ACID)This script extends my other two Array examples (which I've also provided to you open source):
The Ticker-centric 5m,15m,45m,1h,4h,1d resolution labels using arrays:
And the more Macro VIX,GLD,TLT,QQQ,SPY,IWM 1d resolution labels using arrays:
This script aims to show how to use min/max/avg with Arrays easily. My next example after this will be exploring the usage of variance versus covariance ratios over different periodic interval resolutions. Currently, this is using the following intervals: 5m,15m,45m,1h,4h,1d. It takes these intervals, calculates the values at those resolutions and puts the absolute min and max from the 5 minute to the 1 day resolutions.
It's more of an example of the power that arrays can hold, as all this truly is right now is a min/max bound calculator. The real gem lies in the avg calculators for multiple resoltuions tied into a single label with readable data. Check out the code and let me know what you think. If you need more examples, the other two scripts I mentioned before are also open source.
Using this on intervals of less than 1D sometimes times out, the way I wrote it is memory intensive, may not work for non-pro users.
Thanks!
NONE OF THIS IS FOREWARD LOOKING STATEMENTS, THIS IS NOT A PREDECTIVE ANALYSIS TOOL. THIS IS A RESEARCH ATTEMPT AT A NOVEL INDICATOR. I am not responsible for outcomes using it.
Please use and give criticisms freely. I am experimenting with combining resolutions and comparing covariance values at different levels right now, so let me know your thoughts! The last indicator will likely not be open source, but may be depending on how complex I get.

[RS]Cyclic Interval Average PriceEXPERIMENTAL:
Cyclic interval price averaging at every x bars.
Lines for trend line and intra trend slope(not working as intended).

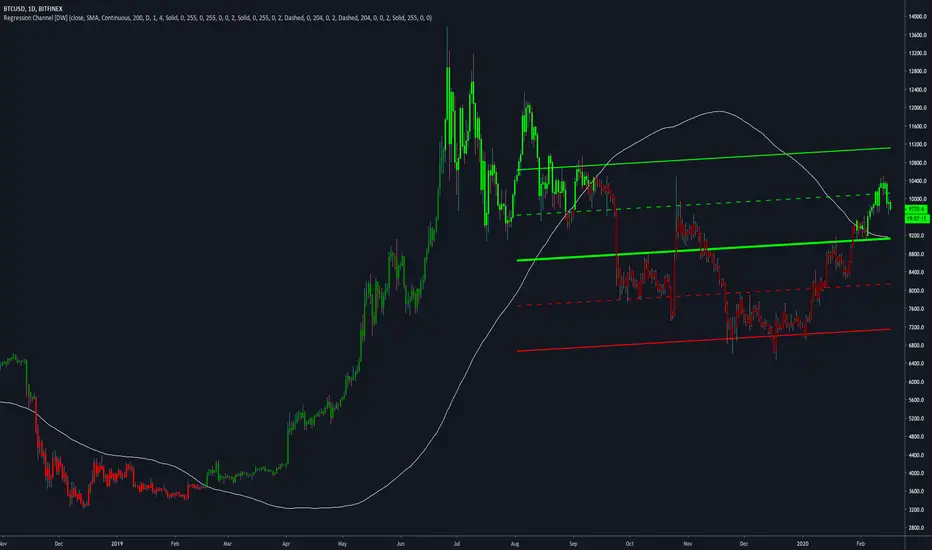
Regression Channel [DW]This is an experimental study which calculates a linear regression channel over a specified period or interval using custom moving average types for its calculations.
Linear regression is a linear approach to modeling the relationship between a dependent variable and one or more independent variables.
In linear regression, the relationships are modeled using linear predictor functions whose unknown model parameters are estimated from the data.
The regression channel in this study is modeled using the least squares approach with four base average types to choose from:
-> Arnaud Legoux Moving Average (ALMA)
-> Exponential Moving Average (EMA)
-> Simple Moving Average (SMA)
-> Volume Weighted Moving Average (VWMA)
When using VWMA, if no volume is present, the calculation will automatically switch to tick volume, making it compatible with any cryptocurrency, stock, currency pair, or index you want to analyze.
There are two window types for calculation in this script as well:
-> Continuous, which generates a regression model over a fixed number of bars continuously.
-> Interval, which generates a regression model that only moves its starting point when a new interval starts. The number of bars for calculation cumulatively increases until the end of the interval.
The channel is generated by calculating standard deviation multiplied by the channel width coefficient, adding it to and subtracting it from the regression line, then dividing it into quartiles.
To observe the path of the regression, I've included a tracer line, which follows the current point of the regression line. This is also referred to as a Least Squares Moving Average (LSMA).
For added predictive capability, there is an option to extend the channel lines into the future.
A custom bar color scheme based on channel direction and price proximity to the current regression value is included.
I don't necessarily recommend using this tool as a standalone, but rather as a supplement to your analysis systems.
Regression analysis is far from an exact science. However, with the right combination of tools and strategies in place, it can greatly enhance your analysis and trading.
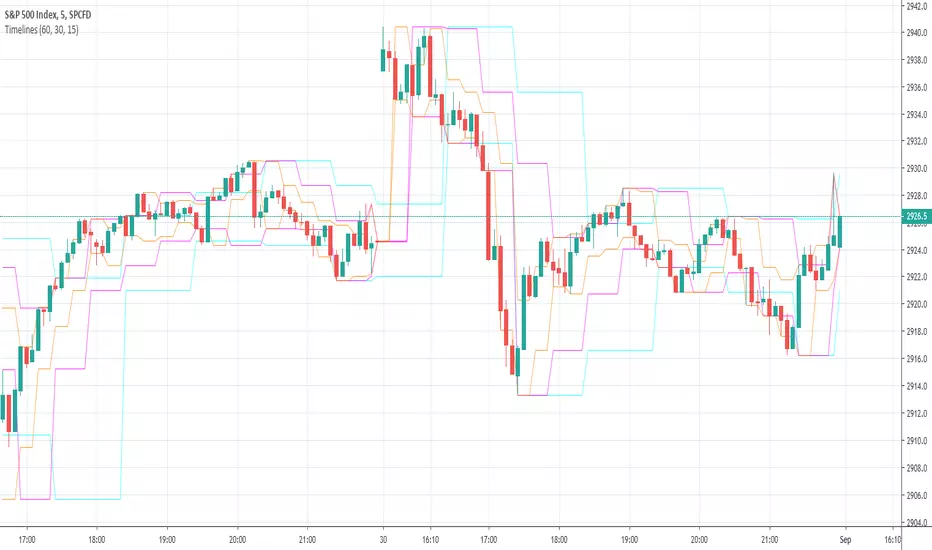
Timelines-Buschi
English:
This is a little, simple script I made upon request from a user.
It shows the highs ad lows of up to three custom timelines (e. g. 60 min, 30 min and 15 min) within a chart.
Deutsch:
Dies ist ein kleines, einfaches Skript, das ich auf Anfrage eines Nutzers erstellt habe.
Es zeigt die Hochs und Tiefs von bis zu drei individueller Zeitreihen (z. B. 60 min, 30 min und 15 min) innerhalb eines Charts.
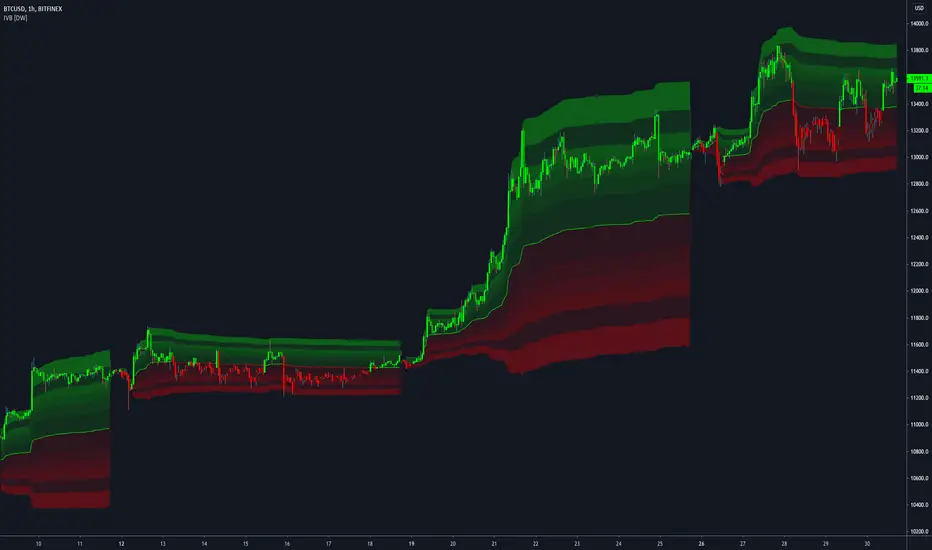
Interval Volatility Bands [DW]This is an experimental study that utilizes Volume Weighted Average Price or Time Weighted Average Price calculations, Bollinger Bands, and Fibonacci numbers to estimate volatility over a specified interval.
First, the basis is calculated by selecting:
-VWAP, which has the option to be calculated using real volume or tick volume
-TWAP, which has the option to be calculated using the standard method or exponential method
Next, standard deviation from the basis is calculated and multiplied by a specified expansion coefficient. The result is then added to and subtracted from the basis to calculate the high and low bands.
There are three band calculation methods to chosse from in this script:
-Standard, which uses the default calculations
-Average, which takes a cumulative average of standard deviation
-Hybrid, which takes the maximum of the standard and average standard deviation methods
Lastly, the high and low band ranges are multiplied by Fibonacci Percentages 23.6 - 78.6.
A custom color scheme with eight default presets to choose from is included.
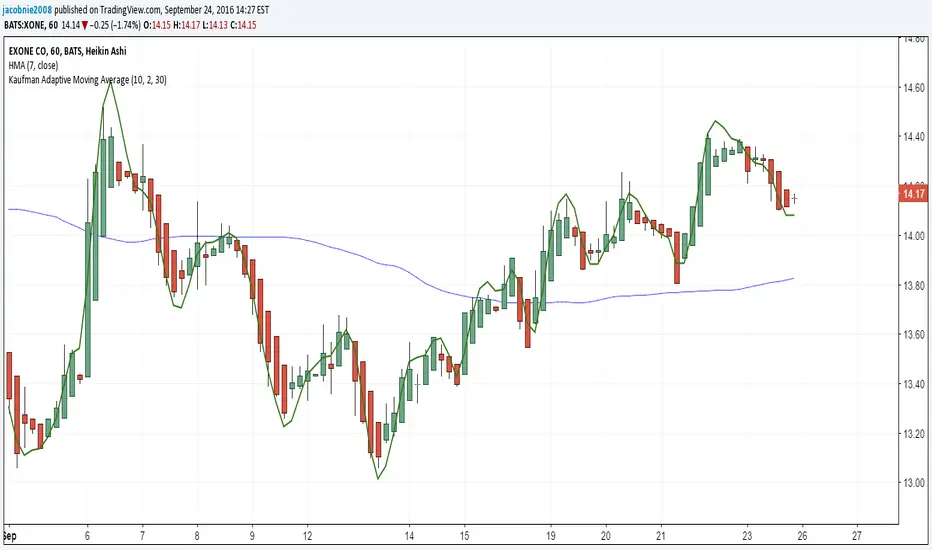
Kaufman Adaptive Moving Average (day)The KAMA will not change when the interval changes from day to something like 5 minutes or 30 minutes. Allows for more precise trading with the same indicator on a different interval.