Advanced Psychological Level-J-Algo📊 Advanced Psychological Level - Universal Market Support
📝 TradingView Publication Write-up
Title:
Advanced Psychological Level
Short Description:
Professional-grade psychological levels indicator with smart detection for ALL cryptocurrencies, dynamic ATR-based spacing, real-time distance calculations, and intelligent visibility management. Works seamlessly across Forex, Indices, and Crypto markets.
🎯 OVERVIEW
Advanced Psychological Level is a sophisticated trading indicator that automatically identifies and displays critical psychological price levels where institutional orders cluster and market reversals occur.
This advanced system goes beyond basic round number indicators by incorporating intelligent adaptive technology that automatically calibrates to any market and price range - from micro-cap cryptocurrencies to major indices, delivering institutional-grade analysis for retail traders.
✨ KEY FEATURES
🧠 Advanced Intelligence Engine
The core of this indicator uses an advanced methodology combining:
Smart market type detection
Automatic level calibration
Dynamic range optimization
Real-time distance calculations
🌍 Universal Market Intelligence
Forex: Pip-based levels (100, 250) with intraday precision (0.2, 0.5, 0.8)
Indices/CFDs: Optimized whole number intervals with intelligent spacing
Crypto: Revolutionary auto-detection that scales from $0.001 to $100,000+
Proprietary scaling for any cryptocurrency
Intelligent level spacing based on logarithmic price magnitude
Zero manual configuration needed
📈 Dynamic ATR-Based Levels (Optional)
Levels that adapt to market volatility in real-time
Advanced ATR calculations with customizable parameters
Self-adjusting to market conditions
Professional-grade volatility analysis
📊 Real-Time Distance Analytics
Instant calculation of distance to key levels
Percentage-based risk/reward computations
Dual-directional target analysis
Customizable display with professional formatting
🎨 Smart Visibility Management
Intelligent Range Filtering: Shows only statistically relevant levels
Performance Optimized: Advanced rendering prevents lag
Dynamic Clutter Reduction: 70% cleaner charts with 100% effectiveness
Configurable visibility parameters
🏷️ Intelligent Price Labels
Smart label placement system
Hierarchical level classification (Major/Standard/Mid)
Professional typography and spacing
Adaptive positioning based on chart scale
🔔 Advanced Alert System
Multi-tier alerts for different level types
Smart alert filtering to prevent spam
Customizable alert conditions
Real-time level breach detection
⚙️ CONFIGURATION GUIDE
Core Settings
Dynamic ATR Mode: Toggle adaptive volatility-based calculations
ATR Parameters: Fine-tune sensitivity (Period & Multiplier)
Visibility Range: Control smart display range (default 10%)
Price Labels: Configure intelligent price display
Level Controls
Major Levels: Primary psychological barriers (250 pip/point)
Standard Levels: Secondary levels (100 pip/point)
Mid Levels: 50% calculations between majors (crypto-optimized)
Intraday Levels: Micro-structure levels (Forex/Crypto only)
Analytics Display
Distance Table: Real-time calculation display
Position Options: Four-corner placement
Visual Parameters: Full color customization
📖 TRADING METHODOLOGY
For Scalpers
Activate intraday levels for micro-structure analysis
Use distance table for precision entries
Configure alerts for quick level breaks
Optimize visibility to 5% for focused trading
For Day Traders
Focus on Major and Standard levels
Enable smart labels for quick analysis
Use distance calculations for targets
Set visibility range to 10-15%
For Swing Traders
Enable ATR-based dynamic levels
Use Major levels as primary targets
Expand visibility range to 20%
Add mid-levels for additional confluence
For Crypto Traders
Let auto-detection handle any coin automatically
Enable mid-levels for volatile markets
Use distance analytics for position sizing
Monitor cluster zones for high-probability setups
💡 ADVANCED TECHNIQUES
Confluence Trading: Combine with volume profile for high-probability zones
Multi-Timeframe Analysis: Apply daily levels to intraday charts
Risk Management: Use distance percentages for position sizing
Smart Confluence: Identify where multiple levels align
Adaptive Display: Automatically adjusts to your zoom level
🚀 THE ADVANCED ADVANTAGE
vs. Basic Round Number Indicators
✅ Universal crypto support (not just BTC/ETH)
✅ Integrated distance calculations
✅ Smart visibility management
✅ ATR-based adaptive levels
✅ Professional framework
vs. Other Psychological Level Tools
✅ Auto-calibration for any asset
✅ Real-time analytical display
✅ Optimized performance
✅ Complete customization
✅ Clean, uniform appearance
📊 MARKET APPLICATIONS
Forex Trading
Major pairs: 100/250 pip detection
Intraday: Precision 20/50/80 pip levels
Session-optimized performance
Institutional-grade analysis
Index Trading
S&P 500: Smart 100/250 point levels
NASDAQ: Thousand-level detection
DAX: Optimized intervals
Futures-ready calculations
Crypto Trading
Bitcoin: Auto-scaling to $1000/5000 levels
Ethereum: Intelligent $100/250 detection
Altcoins: Perfect scaling for any price
Micro-caps: Works on $0.00001 tokens
🔬 TECHNICAL SPECIFICATIONS
Version: v2.0 (Pine Script v6)
Calculation Method: Real-time, non-repainting
Performance: Optimized for all timeframes
Memory Management: Advanced array handling
Compatibility: All TradingView plans
Support: Open-source with detailed comments
⚠️ KEY BENEFITS
Zero Configuration: Works instantly on any chart
Universal Coverage: One indicator for all markets
Professional Display: Clean, institutional-quality visuals
Real-Time Analytics: Instant risk/reward calculations
Performance Optimized: No lag even on complex charts
🎯 IDEAL FOR
✅ Price action traders
✅ Institutional level analysis
✅ Smart money concepts
✅ Multi-timeframe strategies
✅ Risk management focused trading
✅ Any trader seeking reliable S/R levels
💬 FINAL NOTES
This advanced indicator represents extensive development and real-world testing. It solves critical trading challenges:
Automatic Calibration: No manual adjustment across markets
Intelligent Filtering: Shows only relevant levels
Real-Time Analytics: Instant distance and risk calculations
Universal Compatibility: One solution for all markets
The distance table alone transforms trading by providing instant context for risk/reward decisions. The smart crypto detection means you'll never need another psychological level indicator.
Professional-grade tool, available free and open-source because quality trading tools should be accessible to everyone.
Institutional

Smarter Money Concepts Dashboard [PhenLabs]📊Smarter Money Concepts Dashboard
Version: PineScript™v6
📌Description
The Smarter Money Concepts Dashboard is a comprehensive institutional trading analysis tool that combines six of our most powerful smarter money concepts indicators into one unified suite. This advanced system automatically detects and visualizes Fair Value Gaps, Inverted FVGs, Order Blocks, Wyckoff Springs/Upthrusts, Wick Rejection patterns, and ICT Market Structure analysis.
Built for serious traders who need institutional-grade market analysis, this dashboard eliminates subjective interpretation by automatically identifying where smart money is likely positioned. The integrated real-time dashboard provides instant status updates on all active patterns, making it easy to monitor market conditions at a glance.
🚀Points of Innovation
● Multi-Module Integration: Six different SMC concepts unified in one comprehensive system
● Real-Time Dashboard Display: Live tracking of all active patterns with customizable positioning
● Advanced Volume Filtering: Institutional volume confirmation across all pattern types
● Automated Pattern Management: Smart memory system prevents chart clutter while maintaining relevant zones
● Probability-Based Wyckoff Detection: Mathematical probability calculations for spring/upthrust patterns
● Dual FVG System: Both standard and inverted Fair Value Gap detection with equilibrium analysis
🔧Core Components
● Fair Value Gap Engine: Detects standard FVGs with volume confirmation and equilibrium line analysis
● Inverted FVG Module: Advanced IFVG detection using RVI momentum filtering for inversion confirmation
● Order Block System: Institutional order block identification with customizable mitigation methods
● Wyckoff Pattern Recognition: Automated spring and upthrust detection with probability scoring
● Wick Rejection Analysis: High-probability reversal patterns based on wick-to-body ratios
● ICT Market Structure: Simplified institutional concepts with commitment tracking
🔥Key Features
● Comprehensive Pattern Detection: All major SMC concepts in one indicator with automatic identification
● Volume-Confirmed Signals: Multiple volume filters ensure only institutional-grade patterns are highlighted
● Interactive Dashboard: Real-time status display with active pattern counts and module status
● Smart Memory Management: Automatic cleanup of old patterns while preserving relevant market zones
● Full Alert System: Complete notification coverage for all pattern types and signal generations
● Customizable Display Options: Adjustable colors, transparency, and positioning for all visual elements
🎨Visualization
● Color-Coded Zones: Distinct color schemes for bullish/bearish patterns across all modules
● Dynamic Box Extensions: Automatically extending zones until mitigation or invalidation
● Equilibrium Lines: Fair Value Gap midpoint analysis with dotted line visualization
● Signal Markers: Clear spring/upthrust signals with directional arrows and probability indicators
● Dashboard Table: Professional-grade status panel with module activation and pattern counts
● Candle Coloring: Wick rejection highlighting with transparency-based visual emphasis
📖Usage Guidelines
Fair Value Gap Settings
● Days to Analyze: Default 15, Range 1-100 - Controls historical FVG detection period
● Volume Filter: Enables institutional volume confirmation for gap validity
● Min Volume Ratio: Default 1.5 - Minimum volume spike required for gap recognition
● Show Equilibrium Lines: Displays FVG midpoint analysis for precise entry targeting
Order Block Configuration
● Scan Range: Default 25 bars - Lookback period for structure break identification
● Volume Filter: Institutional volume confirmation for order block validation
● Mitigation Method: Wick or Close-based invalidation for different trading styles
● Min Volume Ratio: Default 1.5 - Volume threshold for significant order block formation
Wyckoff Analysis Parameters
● S/R Lookback: Default 20 - Support/resistance calculation period for spring/upthrust detection
● Volume Spike Multiplier: Default 1.5 - Required volume increase for pattern confirmation
● Probability Threshold: Default 0.7 - Minimum probability score for signal generation
● ATR Recovery Period: Default 5 - Price recovery calculation for pattern strength assessment
Market Structure Settings
● Auto-Detect Zones: Automatic identification of high-volume thin zones
● Proximity Threshold: Default 0.20% - Price proximity requirements for zone interaction
● Test Window: Default 20 bars - Time period for zone commitment calculation
Display Customization
● Dashboard Position: Four corner options for optimal chart layout
● Text Size: Scalable from Tiny to Large for different screen configurations
● Pattern Colors: Full customization of all bullish and bearish zone colors
✅Best Use Cases
● Swing Trading: Identify major institutional zones for multi-day position entries
● Day Trading: Precise intraday entries at Fair Value Gaps and Order Block boundaries
● Trend Analysis: Market structure confirmation for directional bias establishment
● Risk Management: Clear invalidation levels provided by all pattern boundaries
● Multi-Timeframe Analysis: Works across all timeframes from 1-minute to monthly charts
⚠️Limitations
● Market Condition Dependency: Performance varies between trending and ranging market environments
● Volume Data Requirements: Requires accurate volume data for optimal pattern confirmation
● Lagging Nature: Some patterns confirmed after initial price movement has begun
● Pattern Density: High-volatility markets may generate excessive pattern signals
● Educational Tool: Requires understanding of smart money concepts for effective application
💡What Makes This Unique
● Complete SMC Integration: First indicator to combine all major smart money concepts comprehensively
● Real-Time Dashboard: Instant visual feedback on all active institutional patterns
● Advanced Volume Analysis: Multi-layered volume confirmation across all detection modules
● Probability-Based Signals: Mathematical approach to Wyckoff pattern recognition accuracy
● Professional Memory Management: Sophisticated pattern cleanup without losing market relevance
🔬How It Works
1. Pattern Detection Phase:
● Multi-timeframe scanning for institutional footprints across all enabled modules
● Volume analysis integration confirms patterns meet institutional trading criteria
● Real-time pattern validation ensures only high-probability setups are displayed
2. Signal Generation Process:
● Automated zone creation with precise boundary definitions for each pattern type
● Dynamic extension system maintains relevance until mitigation or invalidation occurs
● Alert system activation provides immediate notification of new pattern formations
3. Dashboard Update Cycle:
● Live status monitoring tracks all active patterns and module states continuously
● Pattern count updates provide instant feedback on current market condition density
● Commitment tracking for market structure analysis shows institutional engagement levels
💡Note:
This indicator represents institutional trading concepts and should be used as part of a comprehensive trading strategy. Pattern recognition accuracy improves with understanding of smart money principles. Combine with proper risk management and multiple confirmation methods for optimal results.

SMC - Institutional Confidence Oscillator [PhenLabs]📊 Institutional Confidence Oscillator
Version: PineScript™v6
📌 Description
The Institutional Confidence Oscillator (ICO) revolutionizes market analysis by automatically detecting and evaluating institutional activity at key support and resistance levels using our own in-house detection system. This sophisticated indicator combines volume analysis, volatility measurements, and mathematical confidence algorithms to provide real-time readings of institutional sentiment and zone strength.
Using our advanced thin liquidity detection, the ICO identifies high-volume, narrow-range bars that signal institutional zone formation, then tracks how these zones perform under market pressure. The result is a dual-wave confidence oscillator that shows traders when institutions are actively defending price levels versus when they’re abandoning positions.
The indicator transforms complex institutional behavior patterns into clear, actionable confidence percentiles, helping traders align with smart money movements and avoid common retail trading pitfalls.
🚀 Points of Innovation
Automated thin liquidity zone detection using volume threshold multipliers and zone size filtering
Dual-sided confidence tracking for both support and resistance levels simultaneously
Sigmoid function processing for enhanced mathematical accuracy in confidence calculations
Real-time institutional defense pattern analysis through complete test cycles
Advanced visual smoothing options with multiple algorithmic methods (EMA, SMA, WMA, ALMA)
Integrated momentum indicators and gradient visualization for enhanced signal clarity
🔧 Core Components
Volume Threshold System: Analyzes volume ratios against baseline averages to identify institutional activity spikes
Zone Detection Algorithm: Automatically identifies thin liquidity zones based on customizable volume and size parameters
Confidence Lifecycle Engine: Tracks institutional defense patterns through complete observation windows
Mathematical Processing Core: Uses sigmoid functions to convert raw market data into normalized confidence percentiles
Visual Enhancement Suite: Provides multiple smoothing methods and customizable display options for optimal chart interpretation
🔥 Key Features
Auto-Detection Technology: Automatically scans for institutional zones without manual intervention, saving analysis time
Dual Confidence Tracking: Simultaneously monitors both support and resistance institutional activity for comprehensive market view
Smart Zone Validation: Evaluates zone strength through volume analysis, adverse excursion measurement, and defense success rates
Customizable Parameters: Extensive input options for volume thresholds, observation windows, and visual preferences
Real-Time Updates: Continuously processes market data to provide current institutional confidence readings
Enhanced Visualization: Features gradient fills, momentum indicators, and information panels for clear signal interpretation
🎨 Visualization
Dual Oscillator Lines: Support confidence (cyan) and resistance confidence (red) plotted as percentage values 0-100%
Gradient Fill Areas: Color-coded regions showing confidence dominance and strength levels
Reference Grid Lines: Horizontal markers at 25%, 50%, and 75% levels for easy interpretation
Information Panel: Real-time display of current confidence percentiles with color-coded dominance indicators
Momentum Indicators: Rate of change visualization for confidence trends
Background Highlights: Extreme confidence level alerts when readings exceed 80%
📖 Usage Guidelines
Auto-Detection Settings
Use Auto-Detection
Default: true
Description: Enables automatic thin liquidity zone identification based on volume and size criteria
Volume Threshold Multiplier
Default: 6.0, Range: 1.0+
Description: Controls sensitivity of volume spike detection for zone identification, higher values require more significant volume increases
Volume MA Length
Default: 15, Range: 1+
Description: Period for volume moving average baseline calculation, affects volume spike sensitivity
Max Zone Height %
Default: 0.5%, Range: 0.05%+
Description: Filters out wide price bars, keeping only thin liquidity zones as percentage of current price
Confidence Logic Settings
Test Observation Window
Default: 20 bars, Range: 2+
Description: Number of bars to monitor zone tests for confidence calculation, longer windows provide more stable readings
Clean Break Threshold
Default: 1.5 ATR, Range: 0.1+
Description: ATR multiple required for zone invalidation, higher values make zones more persistent
Visual Settings
Smoothing Method
Default: EMA, Options: SMA/EMA/WMA/ALMA
Description: Algorithm for signal smoothing, EMA responds faster while SMA provides more stability
Smoothing Length
Default: 5, Range: 1-50
Description: Period for smoothing calculation, higher values create smoother lines with more lag
✅ Best Use Cases
Trending market analysis where institutional zones provide reliable support/resistance levels
Breakout confirmation by validating zone strength before position entry
Divergence analysis when confidence shifts between support and resistance levels
Risk management through identification of high-confidence institutional backing
Market structure analysis for understanding institutional sentiment changes
⚠️ Limitations
Performs best in liquid markets with clear institutional participation
May produce false signals during low-volume or holiday trading periods
Requires sufficient price history for accurate confidence calculations
Confidence readings can fluctuate rapidly during high-impact news events
Manual fallback zones may not reflect actual institutional activity
💡 What Makes This Unique
Automated Detection: First Pine Script indicator to automatically identify thin liquidity zones using sophisticated volume analysis
Dual-Sided Analysis: Simultaneously tracks institutional confidence for both support and resistance levels
Mathematical Precision: Uses sigmoid functions for enhanced accuracy in confidence percentage calculations
Real-Time Processing: Continuously evaluates institutional defense patterns as market conditions change
Visual Innovation: Advanced smoothing options and gradient visualization for superior chart clarity
🔬 How It Works
1. Zone Identification Process:
Scans for high-volume bars that exceed the volume threshold multiplier
Filters bars by maximum zone height percentage to identify thin liquidity conditions
Stores qualified zones with proximity threshold filtering for relevance
2. Confidence Calculation Process:
Monitors price interaction with identified zones during observation windows
Measures volume ratios and adverse excursions during zone tests
Applies sigmoid function processing to normalize raw data into confidence percentiles
3. Real-Time Analysis Process:
Continuously updates confidence readings as new market data becomes available
Tracks institutional defense success rates and zone validation patterns
Provides visual and numerical feedback through the oscillator display
💡 Note:
The ICO works best when combined with traditional technical analysis and proper risk management. Higher confidence readings indicate stronger institutional backing but should be confirmed with price action and volume analysis. Consider using multiple timeframes for comprehensive market structure understanding.

20/40/60Displays three consecutive, connected range boxes showing high/low price ranges for customizable periods. Boxes are positioned seamlessly with shared boundaries for continuous price action visualization.
Features
Three Connected Boxes: Red (most recent), Orange (middle), Green (earliest) periods
Customizable Positioning: Set range length and starting offset from current bar
Individual Styling: Custom colors, transparency, and border width for each box
Display Controls: Toggle borders, fills, and line visibility
Use Cases
Range Analysis: Compare volatility across time periods, spot breakouts
Support/Resistance: Use box boundaries as potential S/R levels
Market Structure: Visualize recent price development and trend patterns
Key Settings
Range Length: Bars per box (default: 20)
Starting Offset: Bars back from current to position boxes (default: 0)
Style Options: Colors, borders, and visibility controls for each box
Perfect for traders analyzing consecutive price ranges and comparing current conditions to recent historical periods.

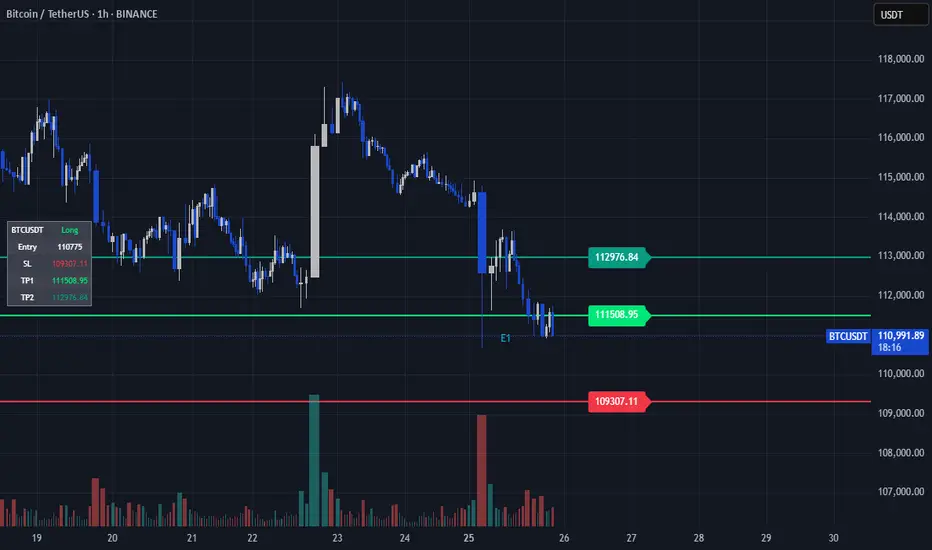
TP/SL Dynamic (FIB,ATR,MULTIPLE,PERCENT)TP/SL Dynamic (FIB, ATR, MULTIPLE, PERCENT)
This indicator provides a flexible framework for managing Take Profit (TP) and Stop Loss (SL) levels using multiple calculation schemes. It is designed for traders who want dynamic or rule-based levels that adapt to volatility, market type, and custom input.
The script supports four TP/SL methodologies:
Pro Standards (Auto-Select): Adapts method based on asset type and volatility.
R Multiples: Risk-based reward multiples from ATR-derived stop distance.
Fibonacci R: Fibonacci extension levels projected from recent pivots.
Percent: Fixed percentage distance from entry, adjusted by volatility.
ATR Multiples: ATR-based calculations with configurable multipliers.
Features:
Up to 3 manual entries, each with configurable time, price, and position size.
Weighted entry price calculation across multiple positions.
Single or multiple TP targets (up to 4) with automatic scaling.
Dynamic ATR option: updates SL/TP levels with live volatility or fixes them at entry.
Pivot-based logic for Fibonacci extensions.
Symbol Locking to prevent mismatches between intended pair and chart symbol.
Table display with optional R-multiples, TP/SL values, and entry details.
Visual chart elements: lines, labels, price-scale markers for SL/TP, and zebra-style info tables.
Entry markers (E1, E2, E3) for clarity.
Alerts for TP and SL triggers (both long and short).
How to Use:
Define entry prices, times, and position sizes (up to 3 entries).
Select a TP method (Pro Standards, R Multiples, Fibonacci R, Percent, or ATR Multiples).
Choose single or multiple TP mode.
Optionally enable Dynamic ATR to update levels in real time.
Check the on-chart table for all calculated levels and alerts.
Author & Credit:
Developed from the ground up by me (no external code used outside The Pine public library).
Smart Money Proxy IndexOverview
The Smart Money Proxy Index (SMPI) is an educational tool that attempts to identify potential institutional-style behavior patterns using publicly available market data. This comprehensive tool combines multiple institutional analysis techniques into a single, easy-to-read 0-100 oscillator.
Important Disclaimer
This is an educational proxy indicator that analyzes volume and price patterns. It cannot identify actual institutional trading activity and should not be interpreted as tracking real "smart money." Use for educational purposes and combine with other analysis methods.
Inspiration & Methodology
This indicator is inspired by MAPsignals' Big Money Index (BMI) methodology but uses publicly available price and volume data with original calculations. This is an independent educational interpretation designed to teach smart money concepts to retail traders.
What It Analyzes
SMPI tracks potential "smart money" activity by combining:
Block Trading Detection - Identifies unusual volume surges with significant price impact
Money Flow Analysis - Volume-weighted price pressure using Money Flow Index
Accumulation/Distribution Patterns - Modified On-Balance Volume signals
Institutional Control Proxy - End-of-day positioning and control analysis
Key Features
– Multi-Component Analysis - Combines 4 different institutional detection methods
– BMI-Style 0-100 Scale - Familiar oscillator range with clear extreme levels
– Professional Visualization - Dynamic colors, gradient fills, and clean data table
– Comprehensive Alerts - Buy/sell signals plus divergence detection
– Fully Customizable - Adjust all parameters, colors, and display options
– Non-Repainting Signals - All alerts use confirmed data for reliability
– Educational Focus - Designed to teach institutional flow concepts
How to Interpret
Above 80: Potential smart money distribution phase (bearish pressure)
Below 20: Potential smart money accumulation phase (bullish opportunity)
Signal Generation: Buy signals when crossing above 20, sell signals when crossing below 80
Divergences: Price vs SMPI divergences can signal potential trend changes
Volume Confirmation: Higher volume ratios strengthen signal reliability
Best Practices
Timeframes: Works best on higher timeframes for institutional behavior analysis
Confirmation: Combine with other technical analysis tools and market context
Volume: Pay attention to volume confirmation in the data table
Context: Consider overall market conditions and fundamental factors
Risk Management: Not recommended as standalone trading system
Customizable Parameters
Block Volume Threshold: Sensitivity for unusual volume detection (default: 2.5x average)
SMPI Smoothing Period: Index calculation smoothing (default: 25 bars)
Extreme Levels: Overbought/oversold thresholds (default: 80/20)
Money Flow Length: MFI calculation period (default: 14)
Visual Options: Colors, signals, and display preferences
Available Alerts
Buy Signal: SMPI crosses above oversold level (20)
Sell Signal: SMPI crosses below overbought level (80)
Extreme Levels: Alerts when reaching overbought/oversold zones
Divergence Detection: Bullish and bearish price vs SMPI divergences
Educational Purpose & Limitations
This indicator is designed as an educational proxy for understanding institutional flow concepts. It analyzes publicly available price and volume data to identify potential smart money behavior patterns.
Cannot access actual institutional transaction data
Signals may be slower than day-trading indicators (intentionally designed for institutional timeframes)
Should be used in conjunction with other analysis methods
Past performance does not guarantee future results
What Makes This Different
Unlike simple volume or momentum indicators, SMPI combines multiple institutional analysis techniques into one comprehensive tool. The multi-component approach provides a more robust view of potential smart money activity.

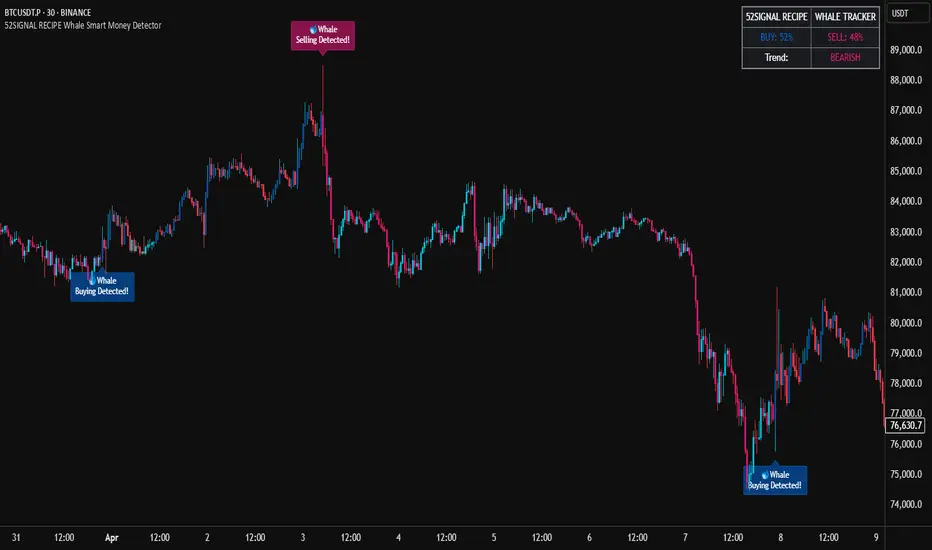
52SIGNAL RECIPE Whale Smart Money Detector52SIGNAL RECIPE Whale Smart Money Detector
◆ Overview
52SIGNAL RECIPE Whale Smart Money Detector is an innovative indicator that detects the movements of whales (large investors) in the cryptocurrency market in real-time. This powerful tool tracks large-scale trading activities that significantly impact the market, providing valuable signals before important market direction changes occur. It can be applied to any cryptocurrency chart, allowing traders to follow the movements of big money anytime, anywhere.
The unique strength of this indicator lies in its comprehensive analysis of volume surges, price volatility, and trend strength to accurately capture whale market entries and exits. By providing clear visual representation of large fund flow data that is difficult for ordinary traders to detect, you gain the opportunity to move alongside the big players in the market.
─────────────────────────────────────
◆ Key Features
• Whale Activity Detection System: Analyzes volume surges and price impacts to capture large investor movements in real-time
• Precise Volume Analysis: Distinguishes between regular volume and whale volume to track only meaningful market movements
• Market Impact Measurement: Quantifies and analyzes the real impact of whale buying/selling on the market
• Continuity Tracking: Follows market direction continuity after whale activity to confirm signal validity
• Intuitive Visualization: Easily identifies whale activity points through color bar charts and clear labels
• Trend Strength Display: Calculates and displays current market buy/sell strength in real-time in a table
• Whale Signal Filtering: Applies multiple filtering systems to detect only genuine whale activity
• Customizable Sensitivity Settings: Offers flexible parameters to adjust whale detection sensitivity according to market conditions
─────────────────────────────────────
◆ Understanding Signal Types
■ Whale Buy Signal
• Definition: Occurs when volume increases significantly above average, immediate volume impact is large, and price rises beyond normal volatility
• Visual Representation: Translucent blue bar coloring with "🐋Whale Buying Detected!" label on the candle where the buy signal occurs
• Market Interpretation: Indicates that large funds are actively buying the coin, which is likely to lead to price increases
■ Whale Sell Signal
• Definition: Occurs when volume increases significantly above average, immediate volume impact is large, and price falls beyond normal volatility
• Visual Representation: Translucent pink bar coloring with "🐋Whale Selling Detected!" label on the candle where the sell signal occurs
• Market Interpretation: Indicates that large funds are actively selling the coin, which is likely to lead to price decreases
─────────────────────────────────────
◆ Understanding Trend Analysis
■ Trend Analysis Method
• Definition: Measures current trend and strength by analyzing the ratio of up/down candles over a set period
• Visual Representation: Displayed in the table as "BUY" and "SELL" percentages, with the current trend clearly marked as "BULLISH", "BEARISH", or "NEUTRAL"
• Calculation Method:
▶ Buy ratio = (Number of up candles) / (Total analysis period)
▶ Sell ratio = (Number of down candles) / (Total analysis period)
▶ Current trend determined by the dominant ratio as "BULLISH" or "BEARISH"
■ Trend Utilization Methods
• Whale Signal Confirmation: Signal reliability increases when whale signals align with the current trend
• Reversal Point Identification: Opposing whale signals during strong trends may indicate important reversal points
• Market Strength Assessment: Understand the balance of power in the current market through buy/sell ratios
• Signal Context Understanding: Consider trend information alongside whale signals for interpretation in a broader market context
─────────────────────────────────────
◆ Indicator Settings Guide
■ Key Setting Parameters
• Volume Impact Factor:
▶ Purpose: Sets the minimum multiplier for immediate volume impact to be considered whale activity
▶ Lower values: Generate more signals, detect smaller whales
▶ Higher values: Fewer signals, detect only very large whales
▶ Recommended range: 2.0-4.0 (adjust according to market conditions)
• Sensitivity Factor:
▶ Purpose: Adjusts sensitivity of price movement relative to normal volatility
▶ Lower values: Increased sensitivity, more signals generated
▶ Higher values: Decreased sensitivity, only stronger price impacts detected
▶ Recommended range: 0.2-0.5 (set higher in highly volatile markets)
• Trend Analysis Period:
▶ Purpose: Sets the number of candles to calculate buy/sell ratios
▶ Lower values: More responsive to recent trends
▶ Higher values: More stable analysis considering longer-term trends
▶ Recommended range: 30-70 (adjust according to trading style)
─────────────────────────────────────
◆ Synergy with Other Indicators
• Key Support/Resistance Levels:
▶ Whale signals occurring near important technical levels have higher reliability
▶ Coincidence of weekly/monthly pivot points and whale signals confirms important price points
• Moving Averages:
▶ Pay attention to whale signals near key moving averages (50MA, 200MA)
▶ Simultaneous occurrence of moving average breakouts and whale signals indicates important technical events
• Volume Profile:
▶ Whale activity near high volume nodes confirms important price levels
▶ Whale signals at low volume nodes may indicate possibility of rapid price movements
• Volatility Indicators:
▶ Whale signals after periods of low volatility may mark the beginning of new market movements
▶ Whale signals after Bollinger Band contraction may be precursors to large movements
• Market Structure:
▶ Whale signals near key market structures (higher highs/lows, lower highs/lows) suggest structural changes
▶ Coincidence of market structure changes and whale activity may signal important trend changes
─────────────────────────────────────
◆ Conclusion
52SIGNAL RECIPE Whale Smart Money Detector tracks the trading activities of large investors in the cryptocurrency market in real-time, providing traders with valuable insights. Because it can be applied to any cryptocurrency chart, you can utilize it immediately on your preferred trading platform.
The core value of this indicator is providing intuitive visualization of large fund flows that are easily missed by ordinary traders. By comprehensively analyzing volume surges, immediate price impacts, and trend continuity to accurately capture whale activity, you gain the opportunity to move alongside the big players in the market.
Clear buy/sell signals and real-time trend strength measurements help traders quickly grasp market conditions and understand market direction. By integrating this powerful tool into your trading system, gain insights into where the market's smart money is flowing for better market understanding.
─────────────────────────────────────
※ Disclaimer: Like all trading tools, the 52SIGNAL RECIPE Whale Smart Money Detector should be used as a supplementary indicator and not relied upon exclusively for trading decisions. Past patterns of whale behavior may not guarantee future market movements. Always employ appropriate risk management strategies in your trading.
52SIGNAL RECIPE Whale Smart Money Detector
◆ 개요
52SIGNAL RECIPE Whale Smart Money Detector는 암호화폐 시장에서 고래(대형 투자자)의 움직임을 실시간으로 감지하는 혁신적인 지표입니다. 이 강력한 도구는 시장에 큰 영향을 미치는 대규모 트레이딩 활동을 추적하여 중요한 시장 방향 전환이 일어나기 전에 귀중한 신호를 제공합니다. 모든 암호화폐 차트에 적용 가능하여 트레이더들이 언제 어디서든 대형 자금의 움직임을 따라갈 수 있게 해줍니다.
이 지표의 독보적인 강점은 거래량 급증, 가격 변동성, 그리고 추세 강도를 종합적으로 분석하여 고래의 시장 진입과 퇴출을 정확히 포착한다는 점입니다. 일반 트레이더들이 놓치기 쉬운 대형 자금의 흐름 데이터를 시각적으로 명확하게 제공함으로써, 여러분은 시장의 큰 손들과 함께 움직일 수 있는 기회를 얻게 됩니다.
─────────────────────────────────────
◆ 주요 특징
• 고래 활동 감지 시스템: 거래량 급증과 가격 임팩트를 분석하여 대형 투자자의 움직임을 실시간으로 포착
• 정밀한 거래량 분석: 일반 거래량과 고래 거래량을 구분하여 의미 있는 시장 움직임만 추적
• 시장 영향력 측정: 고래의 매수/매도가 시장에 미치는 실질적 영향력을 수치화하여 분석
• 연속성 추적: 고래 활동 이후 시장 방향의 지속성을 추적하여 신호의 유효성 확인
• 직관적 시각화: 컬러 바 차트와 명확한 라벨을 통해 고래 활동 지점을 쉽게 식별
• 추세 강도 표시: 현재 시장의 매수/매도 강도를 실시간으로 계산하여 테이블에 표시
• 고래 신호 필터링: 진정한 고래 활동만 감지하도록 다중 필터링 시스템 적용
• 맞춤형 감도 설정: 시장 상황에 따라 고래 감지 감도를 조절할 수 있는 유연한 파라미터 제공
─────────────────────────────────────
◆ 신호 유형 이해하기
■ 고래 매수 신호
• 정의: 거래량이 평균보다 크게 증가하고, 즉각적인 거래량 충격이 크며, 가격이 정상 변동성을 초과하여 상승할 때 발생
• 시각적 표현: 매수 신호가 발생한 캔들에 반투명 파란색 바 컬러링과 함께 "🐋Whale Buying Detected!" 라벨 표시
• 시장 해석: 대형 자금이 적극적으로 코인을 매수하고 있으며, 이는 곧 가격 상승으로 이어질 가능성이 높음을 의미
■ 고래 매도 신호
• 정의: 거래량이 평균보다 크게 증가하고, 즉각적인 거래량 충격이 크며, 가격이 정상 변동성을 초과하여 하락할 때 발생
• 시각적 표현: 매도 신호가 발생한 캔들에 반투명 분홍색 바 컬러링과 함께 "🐋Whale Selling Detected!" 라벨 표시
• 시장 해석: 대형 자금이 적극적으로 코인을 매도하고 있으며, 이는 곧 가격 하락으로 이어질 가능성이 높음을 의미
─────────────────────────────────────
◆ 추세 분석 이해하기
■ 추세 분석 방식
• 정의: 설정된 기간 동안의 상승/하락 캔들 비율을 분석하여 시장의 현재 추세와 강도를 측정
• 시각적 표현: 테이블에 "BUY"와 "SELL" 비율이 백분율로 표시되며, 현재 추세가 "BULLISH", "BEARISH" 또는 "NEUTRAL"로 명확하게 표시됨
• 계산 방식:
▶ 매수 비율 = (상승 캔들 수) / (전체 분석 기간)
▶ 매도 비율 = (하락 캔들 수) / (전체 분석 기간)
▶ 우세한 비율에 따라 "BULLISH" 또는 "BEARISH" 추세 결정
■ 추세 활용 방법
• 고래 신호 확인: 고래 신호가 현재 추세와 일치할 때 신호의 신뢰도가 높아짐
• 반전 포인트 식별: 강한 추세 속에서 발생하는 반대 방향의 고래 신호는 중요한 반전 포인트일 수 있음
• 시장 강도 평가: 매수/매도 비율을 통해 현재 시장의 세력 균형 파악
• 신호 발생 맥락 이해: 추세 정보와 고래 신호를 함께 고려하여 더 넓은 시장 컨텍스트에서 해석
─────────────────────────────────────
◆ 지표 설정 가이드
■ 주요 설정 매개변수
• Volume Impact Factor (거래량 임팩트 요소):
▶ 목적: 고래 활동으로 간주할 즉각적인 거래량 충격의 최소 배수 설정
▶ 낮은 값: 더 많은 신호 생성, 작은 고래도 감지
▶ 높은 값: 더 적은 신호, 매우 큰 고래만 감지
▶ 권장 범위: 2.0-4.0 (시장 상황에 따라 조정)
• Sensitivity Factor (민감도 요소):
▶ 목적: 정상 변동성 대비 가격 변동의 민감도 조절
▶ 낮은 값: 민감도 증가, 더 많은 신호 생성
▶ 높은 값: 민감도 감소, 더 강한 가격 충격만 감지
▶ 권장 범위: 0.2-0.5 (변동성이 높은 시장에서는 높게 설정)
• Trend Analysis Period (추세 분석 기간):
▶ 목적: 매수/매도 비율을 계산할 캔들 수 설정
▶ 낮은 값: 최근 추세에 더 민감하게 반응
▶ 높은 값: 더 긴 기간의 추세를 고려하여 안정적인 분석
▶ 권장 범위: 30-70 (트레이딩 스타일에 따라 조정)
─────────────────────────────────────
◆ 다른 지표와의 시너지
• 주요 지지/저항 레벨:
▶ 중요한 기술적 레벨 근처에서 발생하는 고래 신호는 더 높은 신뢰도를 가짐
▶ 주간/월간 피봇 포인트와 고래 신호의 일치는 중요한 가격 지점을 확인해줌
• 이동평균선:
▶ 주요 이동평균선(50MA, 200MA) 근처에서 발생하는 고래 신호에 주목
▶ 이동평균선 돌파와 고래 신호가 동시 발생 시 중요한 기술적 이벤트 확인
• 볼륨 프로필:
▶ 높은 볼륨 노드 근처에서의 고래 활동은 중요한 가격 레벨 확인
▶ 낮은 볼륨 노드에서 발생하는 고래 신호는 급격한 가격 이동 가능성 암시
• 변동성 지표:
▶ 낮은 변동성 구간 이후 발생하는 고래 신호는 새로운 시장 움직임의 시작일 수 있음
▶ 볼린저 밴드 수축 후 발생하는 고래 신호는 큰 움직임의 전조일 수 있음
• 시장 구조:
▶ 주요 시장 구조(높은 고점/저점, 낮은 고점/저점) 근처에서 발생하는 고래 신호는 구조 변화 암시
▶ 시장 구조 변화와 고래 활동의 일치는 중요한 트렌드 변화 신호일 수 있음
─────────────────────────────────────
◆ 결론
52SIGNAL RECIPE Whale Smart Money Detector는 암호화폐 시장에서 대형 투자자들의 거래 활동을 실시간으로 추적하여 트레이더들에게 귀중한 통찰력을 제공합니다. 모든 암호화폐 차트에 적용 가능하기 때문에, 여러분이 선호하는 트레이딩 플랫폼에서 바로 활용할 수 있습니다.
이 지표의 핵심 가치는 일반 트레이더들이 놓치기 쉬운 대형 자금의 흐름을 직관적으로 시각화하여 제공한다는 점입니다. 거래량 급증, 즉각적인 가격 충격, 그리고 추세 지속성을 종합적으로 분석하여 고래의 활동을 정확히 포착함으로써, 여러분은 시장을 움직이는 큰 손들과 함께할 수 있는 기회를 얻게 됩니다.
명확한 매수/매도 신호와 실시간 추세 강도 측정은 트레이더들이 시장 상황을 한눈에 파악하고 시장의 방향성을 이해하는 데 도움을 줍니다. 이 강력한 도구를 여러분의 트레이딩 시스템에 통합함으로써, 시장의 스마트 머니가 어디로 흘러가는지 파악하고 더 나은 통찰력을 얻으세요.
─────────────────────────────────────
※ 면책 조항: 모든 트레이딩 도구와 마찬가지로, 52SIGNAL RECIPE Whale Smart Money Detector는 보조 지표로 사용해야 하며 트레이딩 결정을 전적으로 의존해서는 안 됩니다. 과거의 고래 행동 패턴이 미래 시장 움직임을 보장하지는 않습니다. 항상 적절한 리스크 관리 전략을 트레이딩에 활용하세요.
Leola Lens SignalPro📌 Leola Lens SignalPro — Structure-Aware Momentum Overlay (Invite-Only)
This script is designed for traders who prioritize clear structure, liquidity trap zones, and momentum transitions. It provides adaptive visual overlays that align with key decision points — emphasizing structure over lagging indicators.
________________________________________
⚙️ Core Operating Modes
✅ Momentum Shift Mode (Always Active)
Tracks microstructure shifts using volatility compression, imbalance reactions, and adaptive logic for directional bias.
⚡ Scalper Mode (Optional)
Activates fast-response overlays for 1m–15m charts — tuned for crypto, indices, and intraday setups.
🛡 Safeguard Mode (Optional)
Applies volume and exhaustion filters for higher timeframe or conservative entries, ideal for swing traders.
________________________________________
📦 Liquidity Control Box (LCB) Logic
🔵 Blue Box = Bullish Control
• Break above → continuation likely
• Break below → caution for reversal
🟧 Orange Box = Bearish Control
• Break below → continuation likely
• Break above → caution for squeeze
Use the last visible box for bias.
Box edges = confluence zones.
Box overlaps = consolidation → avoid impulsive trades.
________________________________________
🧠 Signal Logic & Concept
Built using a custom structural engine, not derived from public scripts like RSI, MACD, or WaveTrend.
The overlays aim to capture price behavior often aligned with institutional concepts, such as:
• Order Blocks
• Liquidity Sweeps
• Trap Reversals
• Mitigation Moves
Pairs well with SMC-style analysis and order-flow-based trading.
________________________________________
🟡 Visual Signal Layers
• BUY / SELL Labels → Appear near structure flips and trap zones
• Yellow Label → High-risk trend shift zone
• LCB Boxes → Real-time market control zones
• Green/Red Liquidity Zones → Absorption or rejection
• MA Overlays → Adaptive slope-based guidance (optional)
• Pink Lines → High-reactivity reversal zones
• Yellow Line → Soft S/R (psychological pivot)
________________________________________
🎯 Suggested Entry & Exit Cues (Educational Use Only)
✅ Entry
• BUY near Blue LCB + liquidity reaction
• SELL after extended rallies into Orange LCB + trap behavior
• ⚠ Avoid trades directly at Yellow Labels unless other context supports
✅ Exit
• On opposite label after structure break
• On formation of opposite LCB
• Near major liquidity zones or pink levels
🧪 Always backtest label behavior to fit your strategy before use.
________________________________________
🔍 Originality Justification
This script introduces a non-indicator-based approach to structure detection — combining real-time volatility response, adaptive liquidity logic, and multi-mode filtering. It avoids conventional oscillators in favor of clarity-driven visual overlays, offering a novel experience especially useful to discretionary traders.
________________________________________
⚠️ Disclaimer
This script is for educational and informational purposes only. It does not constitute financial advice or a trading signal. Always validate performance with backtesting and forward testing before live use.
________________________________________

Leola Lens Footprint📌 Leola Lens Footprint — Market Memory Overlay (Invite-Only)
This invite-only script is built to visualize market memory by identifying historically reactive zones — where price previously encountered resistance, support, or decision-making friction.
Unlike predictive models or indicator-driven systems, Footprint focuses only on price behavior that has already occurred, using confirmed reaction clusters to highlight likely areas of future influence.
________________________________________
🔍 What It Does
• Detects zones where price has reacted multiple times, showing clear rejection, breakout, or consolidation behavior
• Plots these levels only after market confirmation — no projections or lagging indicators
• Designed for clean structural reading across all timeframes and asset classes (crypto, stocks, forex, commodities)
________________________________________
🟡 Visual Elements
• 🟣 Purple Zones → High-impact memory zones with consistent historical rejection
• 🟤 Brown Zones → Fresh rejection clusters (recent demand/supply zones)
• 🟡 Yellow Line → Psychological pivot zone/Key decision points formed from repeated reactions.
• 🩷 Pink Lines → Pullback or reversal zones (support/resistance traps)
• Adaptive zone shading and slope-based logic enhances readability
________________________________________
📊 Best Suited For:
• Price-action traders who focus on confirmed historical behavior, not speculative levels
• Scalpers and swing traders looking to trade retests and rejection entries
• Discretionary traders wanting a stable visual map of structure without noise
________________________________________
🔧 Originality & Logic
This script uses original rule-based logic to cluster and validate levels only after real-world confirmation.
It does not use RSI, MACD, MAs, volume, or any traditional indicator input.
Instead, it tracks zone memory based on how price respects or invalidates key levels over time — making it adaptive to both trending and ranging environments.
There is no repainting or forward projection — all levels appear only after market structure confirms relevance.
________________________________________
⚠️ Disclaimer
This tool is for educational and informational purposes only. It does not constitute trading advice or a financial recommendation. Always validate visual overlays with your own risk framework and backtesting before live use.
________________________________________

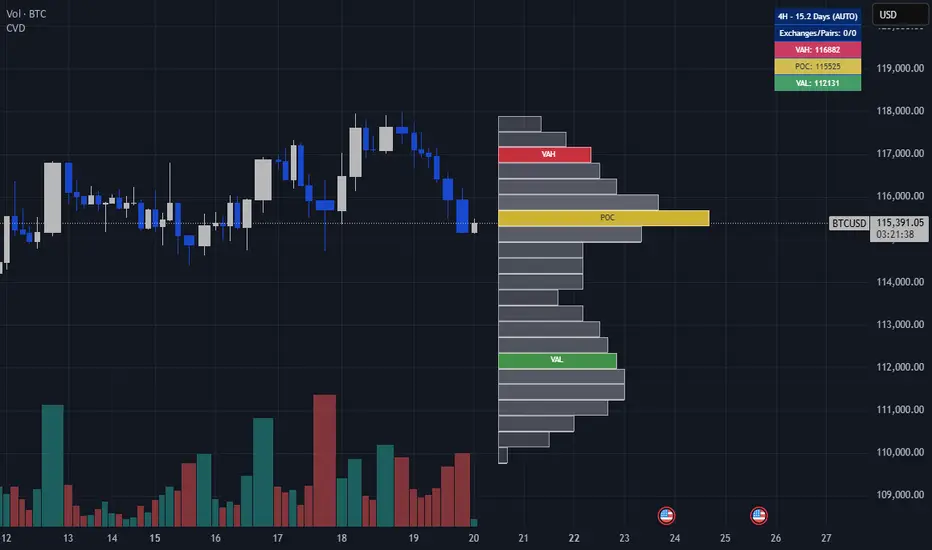
Crypto Volume Data (VAH,POC,VAL)Crypto Volume Data (VAH, POC, VAL) — Multi-Exchange Aggregated Volume Zones
This indicator delivers a high-precision volume profile for crypto assets by aggregating real traded volume across Binance, Bybit, Coinbase, Kraken, OKX, and MEXC. It auto-detects multiple quote pairs (USD, USDT, USDC, FDUSD, USDT.P, USDC.P) and merges the live volume distribution respecting each exchange’s volume for that symbol to calculate institutional-grade VAH, POC, and VAL levels.
No matter which symbol or pair from which exchange is open on the chart, the script dynamically detects the base asset and fetches volume from all matching pairs on supported exchanges. For example, whether you load BTC/USDT, ETH/USDT.P, or SOL/FDUSD, the system identifies the symbol and aggregates volume from all relevant pairs of that symbol across all mentioned exchanges, weighting them based on real volume. This leads to significantly more accurate value areas — especially compared to single-source or single-pair profiles that miss fragmented liquidity and the real volume of each exchange.
This script is fully plug-and-play. There’s no need to select lookback windows or configure pairs — it's already optimized with pre-set internal parameters for common trading timeframes. (Still, you can adjust for your needs in the settings, but keep in mind more lookback is not necessarily a good thing — it might affect the accuracy of your output depending on the timeframe.)
Key Features:
Live aggregation of volume across 5 exchanges
Supports most listed altcoins with reliable quote pair coverage
Dynamic auto symbol/quote detection and normalization
Automatically adapts to any crypto chart without user setup
Real institutional zones — not synthetic, not heuristic
Why It Matters:
In fragmented crypto markets, liquidity isn’t centralized. Volume for a coin like ETH may be split between USDT on Binance, USD on Kraken, or USDC on MEXC. Most indicators ignore that. This tool doesn’t. It brings that volume together to provide the most contextually accurate VAH/POC/VAL levels possible, tailored to the charted asset and timeframe.
This isn't just another volume indicator. It’s built from the ground up to capture where the real trades happen — not just where price moved — and shows you the zones that institutions and large players respect.
Disclaimer:
This tool is for educational and informational purposes only. It does not constitute financial advice or an invitation to trade. Always do your own research and manage risk responsibly.
Credits:
Volume unification logic, cross-pair normalization, and exchange weighting system developed by me. No third-party libraries or reused scripts involved. Original architecture built from scratch for high-resolution crypto volume profile analysis.
Note:
Script designed to respect TradingView limits for both free and paid accounts, with a smart fallback system in case of hitting the limit. If you find any bug, error, or issue, kindly comment below. I will address and fix them ASAP.
Enjoy and cheers.
Volume Footprint Anomaly Scanner [PhenLabs]📊 PhenLabs - Volume Footprint Anomaly Scanner (VFAS)
Version: PineScript™ v6
📌 Description
The PhenLabs Volume Footprint Anomaly Scanner (VFAS) is an advanced Pine Script indicator designed to detect and highlight significant imbalances in buying and selling pressure within individual price bars. By analyzing a calculated "Delta" – the net difference between estimated buy and sell volume – and employing statistical Z-score analysis, VFAS pinpoints moments when buying or selling activity becomes unusually dominant. This script was created not in hopes of creating a "Buy and Sell" indicator but rather providing the user with a more in-depth insight into the intrabar volume delta and how it can fluctuate in unusual ways, leading to anomalies that can be capitalized on.
This indicator helps traders identify high-conviction points where strong market participants are active, signaling potential shifts in momentum or continuation of a trend. It aims to provide a clearer understanding of underlying market dynamics, allowing for more informed decision-making in various trading strategies, from identifying entry points to confirming trend strength.
🚀 Points of Innovation
● Z-Score for Delta Analysis : Utilizes statistical Z-scores to objectively identify statistically significant anomalies in buying/selling pressure, moving beyond simple, arbitrary thresholds.
● Dynamic Confidence Scoring : Assigns a multi-star confidence rating (1-4 stars) to each signal, factoring in high volume, trend alignment, and specific confirmation criteria, providing a nuanced view of signal strength.
● Integrated Trend Filtering : Offers an optional Exponential Moving Average (EMA)-based trend filter to ensure signals align with the broader market direction, reducing false positives in ranging markets.
● Strict Confirmation Logic : Implements specific confirmation criteria for higher-confidence signals, including price action and a time-based gap from previous signals, enhancing reliability.
● Intuitive Info Dashboard : Provides a real-time summary of market trend and the latest signal's direction and confidence directly on the chart, streamlining information access.
🔧 Core Components
● Core Delta Engine : Estimates the net buying/selling pressure (bar Delta) by analyzing price movement within each bar relative to volume. It also calculates average volume to identify bars with unusually high activity.
● Anomaly Detection (Z-Score) : Computes the Z-score for the current bar's Delta, indicating how many standard deviations it is from its recent average. This statistical measure is central to identifying significant anomalies.
● Trend Filter : Utilizes a dual Exponential Moving Average (EMA) cross-over system to define the prevailing market trend (uptrend, downtrend, or range), providing contextual awareness.
● Signal Processing & Confidence Algorithm : Evaluates anomaly conditions against trend filters and confirmation rules, then calculates a dynamic confidence score to produce actionable, contextualized signal information.
🔥 Key Features
● Advanced Delta Anomaly Detection : Pinpoints bars with exceptionally high buying or selling pressure, indicating potential institutional activity or strong market conviction.
● Multi-Factor Confidence Scoring : Each signal comes with a 1-4 star rating, clearly communicating its reliability based on high volume, trend alignment, and specific confirmation criteria.
● Optional Trend Alignment : Users can choose to filter signals, so only those aligned with the prevailing EMA-defined trend are displayed, enhancing signal quality.
● Interactive Signal Labels : Displays compact labels on the chart at anomaly points, offering detailed tooltips upon hover, including signal type, direction, confidence, and contextual information.
● Customizable Bar Colors : Visually highlights bars with Delta anomalies, providing an immediate visual cue for strong buying or selling activity.
● Real-time Info Dashboard : A clean, customizable dashboard shows the current market trend and details of the latest detected signal, keeping key information accessible at a glance.
● Configurable Alerts : Set up alerts for bullish or bearish Delta anomalies to receive real-time notifications when significant market pressure shifts occur.
🎨 Visualization
Signal Labels :
* Placed at the top/bottom of anomaly bars, showing a "📈" (bullish) or "📉" (bearish) icon.
* Tooltip: Hovering over a label reveals detailed information: Signal Type (e.g., "Delta Anomaly"), Direction, Confidence (e.g., "★★★☆"), and a descriptive explanation of the anomaly.
* Interpretation: Clearly marks actionable signals and provides deep insights without cluttering the chart, enabling quick assessment of signal strength and context.
● Info Dashboard :
* Located at the top-right of the chart, providing a clean summary.
* Displays: "PhenLabs - VFAS" header, "Market Trend" (Uptrend/Downtrend/Range with color-coded status), and "Direction | Conf." (showing the last signal's direction and star confidence).
* Optional "💡 Hover over signals for details" reminder.
* Interpretation: A concise, real-time summary of the market's pulse and the most recent high-conviction event, helping traders stay informed at a glance.
📖 Usage Guidelines
Setting Categories
⚙️ Core Delta & Volume Engine
● Minimum Volume Lookback (Bars)
○ Default: 9
○ Range: Integer (e.g., 5-50)
○ Description: Defines the number of preceding bars used to calculate the average volume and delta. Bars with volume below this average won't be considered for high-volume signals. A shorter lookback is more reactive to recent changes, while a longer one provides a smoother average.
📈 Anomaly Detection Settings
Delta Z-Score Anomaly Threshold
○ Default: 2.5
○ Range: Float (e.g., 1.0-5.0+)
○ Description: The number of standard deviations from the mean that a bar's delta must exceed to be considered a significant anomaly. A higher threshold means fewer, but potentially stronger, signals. A lower threshold will generate more signals, which might include less significant events. Experiment to find the optimal balance for your trading style.
🔬 Context Filters
Enable Trend Filter
○ Default: False
○ Range: Boolean (True/False)
○ Description: When enabled, signals will only be generated if they align with the current market trend as determined by the EMAs (e.g., only bullish signals in an uptrend, bearish in a downtrend). This helps to filter out counter-trend noise.
● Trend EMA Fast
○ Default: 50
○ Range: Integer (e.g., 10-100)
○ Description: The period for the faster Exponential Moving Average used in the trend filter. In combination with the slow EMA, it defines the trend direction.
● Trend EMA Slow
○ Default: 200
○ Range: Integer (e.g., 100-400)
○ Description: The period for the slower Exponential Moving Average used in the trend filter. The relationship between the fast and slow EMA determines if the market is in an uptrend (fast > slow) or downtrend (fast < slow).
🎨 Visual & UI Settings
● Show Info Dashboard
○ Default: True
○ Range: Boolean (True/False)
○ Description: Toggles the visibility of the dashboard on the chart, which provides a summary of market trend and the last detected signal.
● Show Dashboard Tooltip
○ Default: True
○ Range: Boolean (True/False)
○ Description: Toggles a reminder message in the dashboard to hover over signal labels for more detailed information.
● Show Delta Anomaly Bar Colors
○ Default: True
○ Range: Boolean (True/False)
○ Description: Enables or disables the coloring of bars based on their delta direction and whether they represent a significant anomaly.
● Show Signal Labels
○ Default: True
○ Range: Boolean (True/False)
○ Description: Controls the visibility of the “📈” or “📉” labels that appear on the chart when a delta anomaly signal is generated.
🔔 Alert Settings
Alert on Delta Anomaly
○ Default: True
○ Range: Boolean (True/False)
○ Description: When enabled, this setting allows you to set up alerts in TradingView that will trigger whenever a new bullish or bearish delta anomaly is detected.
✅ Best Use Cases
Early Trend Reversal / Continuation Detection: Identify strong surges of buying/selling pressure at key support/resistance levels that could indicate a reversal or the continuation of a strong move.
● Confirmation of Breakouts: Use high-confidence delta anomalies to confirm the validity of price breakouts, indicating strong conviction behind the move.
● Entry and Exit Points: Pinpoint precise entry opportunities when anomalies align with your trading strategy, or identify potential exhaustion signals for exiting trades.
● Scalping and Day Trading: The indicator’s sensitivity to intraday buying/selling imbalances makes it highly effective for short-term trading strategies.
● Market Sentiment Analysis: Gain a real-time understanding of underlying market sentiment by observing the prevalence and strength of bullish vs. bearish anomalies.
⚠️ Limitations
Estimated Delta: The script uses a simplified method to estimate delta based on bar close relative to its range, not actual order book or footprint data. While effective, it’s an approximation.
● Sensitivity to Z-Score Threshold: The effectiveness heavily relies on the `Delta Z-Score Anomaly Threshold`. Too low, and you’ll get many false positives; too high, and you might miss valid signals.
● Confirmation Criteria: The 4-star confidence level’s “confirmation” relies on specific subsequent bar conditions and previous confirmed signals, which might be too strict or specific for all contexts.
● Requires Context: While powerful, VFAS is best used in conjunction with other technical analysis tools and price action to form a comprehensive trading strategy. It is not a standalone “buy/sell” signal.
💡 What Makes This Unique
Statistical Rigor: The application of Z-score analysis to bar delta provides an objective, statistically-driven way to identify true anomalies, moving beyond arbitrary thresholds.
● Multi-Factor Confidence Scoring: The unique 1-4 star confidence system integrates multiple market dynamics (volume, trend alignment, specific follow-through) into a single, easy-to-interpret rating.
● User-Friendly Design: From the intuitive dashboard to the detailed signal tooltips, the indicator prioritizes clear and accessible information for traders of all experience levels.
🔬 How It Works
1. Bar Delta Calculation:
● The script first estimates the “buy volume” and “sell volume” for each bar. This is done by assuming that volume proportional to the distance from the low to the close represents buying, and volume proportional to the distance from the high to the close represents selling.
● How this contributes: This provides a proxy for the net buying or selling pressure (delta) within that specific price bar, even without access to actual footprint data.
2. Volume & Delta Z-Score Analysis:
● The average volume over a user-defined lookback period is calculated. Bars with volume less than twice this average are generally considered of lower interest.
● The Z-score for the calculated bar delta is computed. The Z-score measures how many standard deviations the current bar’s delta is from its average delta over the `Minimum Volume Lookback` period.
● How this contributes: A high positive Z-score indicates a bullish delta anomaly (significantly more buying than usual), while a high negative Z-score indicates a bearish delta anomaly (significantly more selling than usual). This identifies statistically unusual levels of pressure.
3. Trend Filtering (Optional):
● Two Exponential Moving Averages (Fast and Slow EMA) are used to determine the prevailing market trend. An uptrend is identified when the Fast EMA is above the Slow EMA, and a downtrend when the Fast EMA is below the Slow EMA.
● How this contributes: If enabled, the indicator will only display bullish delta anomalies during an uptrend and bearish delta anomalies during a downtrend, helping to confirm signals within the broader market context and avoid counter-trend signals.
4. Signal Generation & Confidence Scoring:
● When a delta Z-score exceeds the user-defined anomaly threshold, a signal is generated.
● This signal is then passed through a multi-factor confidence algorithm (`f_calculateConfidence`). It awards stars based on: high volume presence, alignment with the overall trend (if enabled), and a fourth star for very strong Z-scores (above 3.0) combined with specific follow-through candle patterns after a cooling-off period from a previous confirmed signal.
● How this contributes: Provides a qualitative rating (1-4 stars) for each anomaly, allowing traders to quickly assess the potential significance and reliability of the signal.
💡 Note:
The PhenLabs Volume Footprint Anomaly Scanner is a powerful analytical tool, but it’s crucial to understand that no indicator guarantees profit. Always backtest and forward-test the indicator settings on your chosen assets and timeframes. Consider integrating VFAS with your existing trading strategy, using its signals as confirmation for entries, exits, or trend bias. The Z-score threshold is highly customizable; lower values will yield more signals (including potential noise), while higher values will provide fewer but potentially higher-conviction signals. Adjust this parameter based on market volatility and your risk tolerance. Remember to combine statistical insights from VFAS with price action, support/resistance levels, and your overall market outlook for optimal results.

52SIGNAL RECIPE Coinbase Institutional Smart Money DetectorCoinbase Institutional Smart Money Detector
◆ Overview
Coinbase Institutional Smart Money Detector is an innovative indicator that detects the buying and selling movements of institutional investors through Coinbase Prime in real-time. This powerful tool tracks the flow of funds from large institutions to provide valuable signals before significant market direction changes occur. It can be applied to Bitcoin charts on any exchange, allowing traders to follow the "smart money" movements of institutions anytime, anywhere.
The unique strength of this indicator lies in its comprehensive assessment of institutional investors' consecutive trading behaviors, volume patterns, and trend strength by analyzing Coinbase data in real-time. By providing clear visual representation of institutional fund flow data that is difficult for ordinary traders to access, you gain the opportunity to move alongside the big players in the market.
─────────────────────────────────────
◆ Key Features
• Coinbase Prime Data Analysis: Tracks institutional movements in real-time by analyzing data from Coinbase Prime, an institutional-only service
• Real-time Institutional Fund Flow Monitoring: Immediately detects large institutions' spot buying/selling activities, allowing positioning ahead of the market
• Universal Exchange Compatibility: Applicable to Bitcoin charts on any exchange, enabling use on your preferred trading platform
• Institutional Continuity Analysis: Identifies continuous institutional activity by tracking consecutive buying/selling patterns
• Smart Volume Analysis: Detects increased volume compared to averages and analyzes key trading time periods
• Trend Strength Measurement: Quantifies and displays the strength of upward/downward trends by analyzing candle patterns
• Intuitive Visualization: Clearly marks institutional activity points on charts through bar coloring and labels
• Real-time Strength Display: Calculates and displays current trend strength in a table in real-time
• Customizable Settings: Allows customization of key parameters to match your trading style
─────────────────────────────────────
◆ Understanding Signal Types
■ Institutional Buy Signal
• Definition: Occurs when institutional investors show consecutive buying activity through Coinbase Prime, accompanied by increased volume and strong upward trend
• Visual Representation: Translucent blue bar coloring and "Institution Buying Detected!" label on the candle where the buy signal occurs
• Market Interpretation: Indicates that institutional investors are actively buying spot Bitcoin, which is likely to lead to price increases
• Signal Strength Factors:
▶ Consecutive price increase patterns
▶ Above-average volume
▶ Strong upward trend strength measurement
▶ Significant price movement
■ Institutional Sell Signal
• Definition: Occurs when institutional investors show consecutive selling activity through Coinbase Prime, accompanied by increased volume and strong downward trend
• Visual Representation: Translucent pink bar coloring and "Institution Selling Detected!" label on the candle where the sell signal occurs
• Market Interpretation: Indicates that institutional investors are actively selling spot Bitcoin, which is likely to lead to price decreases
• Signal Strength Factors:
▶ Consecutive price decrease patterns
▶ Above-average volume
▶ Strong downward trend strength measurement
▶ Significant price movement
─────────────────────────────────────
◆ Understanding Trend Strength
■ Trend Strength Measurement Method
• Definition: Measures trend strength by analyzing the ratio of up/down candles over a recent period
• Visual Representation: Displayed in the table as "BULL STRENGTH" or "BEAR STRENGTH" with percentage value and "STRONG" or "WEAK" status
• Strength Threshold: Strong/weak determination according to user-configurable threshold
• Calculation Method:
▶ Upward trend strength = (Number of upward candles) / (Total analysis period)
▶ Downward trend strength = (Number of downward candles) / (Total analysis period)
▶ Displayed as "STRONG" when strength is above threshold, "WEAK" when below
■ Utilizing Trend Strength
• Signal Filtering: Generates signals only when trend strength is strong, reducing false signals
• Trend Confirmation: Evaluates the health and sustainability of the current market trend
• Entry/Exit Decisions: Consider entering in strong trends and exiting when trends weaken
• Risk Management: Develop strategies to reduce position size in weak trends and increase in strong trends
─────────────────────────────────────
◆ Practical Trading Applications
■ Institutional Buy Signal Strategy
• Trend Reversal Scenario:
▶ Setup: Strong institutional buy signal during a downtrend
▶ Entry: Buy after signal confirmation in the next candle
▶ Stop Loss: Below the low of the signal candle
▶ Take Profit: When reaching previous major resistance or when trend strength weakens
• Trend Continuation Scenario:
▶ Setup: Institutional buy signal after correction in an uptrend
▶ Entry: Buy after signal confirmation
▶ Stop Loss: Below recent major low
▶ Take Profit: Gradually take profits considering trend strength
■ Institutional Sell Signal Strategy
• Trend Reversal Scenario:
▶ Setup: Strong institutional sell signal during an uptrend
▶ Entry: Sell after signal confirmation in the next candle
▶ Stop Loss: Above the high of the signal candle
▶ Take Profit: When reaching previous major support or when trend strength weakens
• Trend Continuation Scenario:
▶ Setup: Institutional sell signal after bounce in a downtrend
▶ Entry: Sell after signal confirmation
▶ Stop Loss: Above recent major high
▶ Take Profit: Gradually take profits considering trend strength
■ Multi-Timeframe Approach
• Higher Timeframe Direction Confirmation:
▶ Check institutional signals and trend strength on daily/4-hour charts
▶ Use for setting main trading direction
• Lower Timeframe Entry Point Finding:
▶ Wait for lower timeframe signals that align with higher timeframe direction
▶ Use for capturing precise entry points
• Cross-Timeframe Signal Alignment:
▶ Signal strength increases when signals occur in the same direction across multiple timeframes
▶ Capture high-probability trading opportunities
─────────────────────────────────────
◆ Indicator Settings Guide
■ Main Setting Parameters
• Institutional Continuity Period:
▶ Purpose: Sets the period to check institutional consecutive buying/selling activity
▶ Lower value: Generates more signals, increases responsiveness
▶ Higher value: Reduces number of signals, increases reliability
• Trend Strength Threshold:
▶ Purpose: Sets the minimum threshold for determining strong trends
▶ Lower value: More signals, less filtering
▶ Higher value: Generates signals only in stronger trends, higher filtering
─────────────────────────────────────
◆ Synergy with Other Indicators
• Support/Resistance Levels:
▶ Institutional signals occurring at key support/resistance levels have higher probability
▶ Combination of key technical analysis levels and institutional activity provides powerful signals
• Moving Averages:
▶ Pay attention to institutional signals near key moving averages (50MA, 200MA)
▶ Strong trend change possibility when moving average crossovers coincide with institutional signals
• RSI/Momentum Indicators:
▶ Institutional buy signals in oversold conditions increase reversal probability
▶ Institutional sell signals in overbought conditions increase reversal probability
• Volume Profile:
▶ Institutional signals at high volume nodes confirm important price levels
▶ Institutional activity in key trading areas greatly impacts price direction
• Market Structure:
▶ Institutional signals near key market structures (higher highs/lows, lower highs/lows) suggest structural changes
▶ Coincidence of market structure changes and institutional activity indicates important trend turning points
─────────────────────────────────────
◆ Conclusion
Coinbase Institutional Smart Money Detector provides traders with valuable insights by tracking spot Bitcoin trading activities of institutional investors through Coinbase Prime in real-time. Because it can be applied to Bitcoin charts on any exchange, you can utilize it immediately on your preferred trading platform.
The core value of this indicator is providing intuitive visualization of institutional fund flow data that is difficult for ordinary traders to access. By comprehensively analyzing consecutive price movements, volume increases, and trend strength to capture institutional activity, you gain the opportunity to move alongside the big players in the market.
Clear buy/sell signals based on Coinbase Prime data and real-time trend strength measurements help traders quickly grasp market conditions and make strategic decisions. By integrating this powerful tool into your trading strategy, secure a competitive edge to understand where the market's smart money is flowing and position accordingly.
─────────────────────────────────────
※ Disclaimer: Like all trading tools, the Institutional Smart Money Detector should be used as a supplementary indicator and not relied upon exclusively for trading decisions. Past patterns of institutional behavior may not guarantee future market movements. Always employ appropriate risk management strategies in your trading.
Coinbase Institutional Smart Money Detector
◆ 개요
Coinbase Institutional Smart Money Detector는 코인베이스 프라임(Coinbase Prime)을 통한 기관 투자자들의 현물 비트코인 매수/매도 움직임을 실시간으로 감지하는 혁신적인 지표입니다. 이 강력한 도구는 대형 기관들의 자금 흐름을 추적하여 중요한 시장 방향 전환이 일어나기 전에 귀중한 신호를 제공합니다. 어떤 거래소의 비트코인 차트에도 적용 가능하여 트레이더들이 언제 어디서든 기관의 "스마트 머니" 움직임을 따라갈 수 있게 해줍니다.
이 지표의 독보적인 강점은 코인베이스 데이터를 실시간으로 분석하여 기관 투자자들의 연속적인 매매 행동, 거래량 패턴, 그리고 추세 강도를 종합적으로 평가한다는 점입니다. 일반 트레이더들이 접근하기 어려운 기관 자금 흐름 데이터를 시각적으로 명확하게 제공함으로써, 여러분은 시장의 큰 손들과 함께 움직일 수 있는 기회를 얻게 됩니다.
─────────────────────────────────────
◆ 주요 특징
• 코인베이스 프라임 데이터 분석: 기관 전용 서비스인 코인베이스 프라임의 데이터를 실시간으로 추적하여 기관의 움직임 포착
• 실시간 기관 자금 흐름 모니터링: 대형 기관들의 현물 매수/매도 활동을 즉각적으로 감지하여 시장에 앞서 포지셔닝 가능
• 모든 거래소 호환성: 어떤 거래소의 비트코인 차트에도 적용 가능하여 선호하는 트레이딩 플랫폼에서 활용 가능
• 기관 연속성 분석: 연속적인 매수/매도 패턴을 추적하여 기관의 지속적인 활동 식별
• 스마트 볼륨 분석: 평균 대비 거래량 증가를 감지하고 주요 거래 시간대를 분석
• 추세 강도 측정: 캔들 패턴을 분석해 상승/하락 추세의 강도를 수치화하여 표시
• 직관적 시각화: 바 컬러링과 라벨을 통해 기관 활동 지점을 차트에 명확하게 표시
• 실시간 강도 표시: 현재 추세의 강도를 실시간으로 계산하여 테이블에 표시
• 사용자 정의 설정: 주요 매개변수를 조정하여 자신의 트레이딩 스타일에 맞게 커스터마이징 가능
─────────────────────────────────────
◆ 신호 유형 이해하기
■ 기관 매수 신호
• 정의: 코인베이스 프라임을 통해 기관 투자자들이 연속적인 매수 활동을 보이며, 이와 함께 거래량 증가와 강한 상승 추세가 나타날 때 발생
• 시각적 표현: 매수 신호가 발생한 캔들에 반투명 파란색 바 컬러링과 함께 "Institution Buying Detected!" 라벨 표시
• 시장 해석: 기관 투자자들이 적극적으로 현물 비트코인을 매수하고 있으며, 이는 곧 가격 상승으로 이어질 가능성이 높음을 의미
• 신호 강도 요소:
▶ 연속적인 가격 상승 패턴
▶ 평균보다 높은 거래량
▶ 강한 상승 추세 강도 측정값
▶ 유의미한 가격 변동
■ 기관 매도 신호
• 정의: 코인베이스 프라임을 통해 기관 투자자들이 연속적인 매도 활동을 보이며, 이와 함께 거래량 증가와 강한 하락 추세가 나타날 때 발생
• 시각적 표현: 매도 신호가 발생한 캔들에 반투명 분홍색 바 컬러링과 함께 "Institution Selling Detected!" 라벨 표시
• 시장 해석: 기관 투자자들이 적극적으로 현물 비트코인을 매도하고 있으며, 이는 곧 가격 하락으로 이어질 가능성이 높음을 의미
• 신호 강도 요소:
▶ 연속적인 가격 하락 패턴
▶ 평균보다 높은 거래량
▶ 강한 하락 추세 강도 측정값
▶ 유의미한 가격 변동
─────────────────────────────────────
◆ 추세 강도 이해하기
■ 추세 강도 측정 방식
• 정의: 최근 일정 기간 동안의 상승/하락 캔들 비율을 분석하여 추세의 강도를 측정
• 시각적 표현: 테이블에 "BULL STRENGTH" 또는 "BEAR STRENGTH"로 표시되며, 백분율 값과 함께 "STRONG" 또는 "WEAK" 상태 표시
• 강도 임계값: 사용자가 설정 가능한 임계값에 따라 강함/약함 판정
• 계산 방식:
▶ 상승 추세 강도 = (상승 캔들 수) / (전체 분석 기간)
▶ 하락 추세 강도 = (하락 캔들 수) / (전체 분석 기간)
▶ 강도가 임계값 이상일 때 "STRONG", 미만일 때 "WEAK"로 표시
■ 추세 강도의 활용
• 신호 필터링: 추세 강도가 강할 때만 신호를 생성하여 허위 신호 감소
• 추세 확인: 현재 시장 추세의 건전성과 지속 가능성 평가
• 진입/퇴출 결정: 강한 추세에서 진입하고 약한 추세로 전환될 때 퇴출 고려
• 리스크 관리: 약한 추세에서는 포지션 크기를 줄이고, 강한 추세에서는 늘리는 전략 수립 가능
─────────────────────────────────────
◆ 실전 트레이딩 응용
■ 기관 매수 신호 활용 전략
• 추세 전환 시나리오:
▶ 설정: 하락 추세 중 강한 기관 매수 신호 발생
▶ 진입: 신호 확인 후 다음 캔들에서 매수
▶ 손절: 신호 캔들의 저점 아래
▶ 이익실현: 이전 주요 저항선 도달 시 또는 추세 강도가 약해질 때
• 추세 지속 시나리오:
▶ 설정: 상승 추세 중 조정 후 기관 매수 신호 발생
▶ 진입: 신호 확인 후 매수
▶ 손절: 최근 주요 저점 아래
▶ 이익실현: 추세 강도를 고려하여 단계적으로 이익실현
■ 기관 매도 신호 활용 전략
• 추세 전환 시나리오:
▶ 설정: 상승 추세 중 강한 기관 매도 신호 발생
▶ 진입: 신호 확인 후 다음 캔들에서 매도
▶ 손절: 신호 캔들의 고점 위
▶ 이익실현: 이전 주요 지지선 도달 시 또는 추세 강도가 약해질 때
• 추세 지속 시나리오:
▶ 설정: 하락 추세 중 반등 후 기관 매도 신호 발생
▶ 진입: 신호 확인 후 매도
▶ 손절: 최근 주요 고점 위
▶ 이익실현: 추세 강도를 고려하여 단계적으로 이익실현
■ 다중 시간프레임 접근법
• 상위 시간프레임 방향성 확인:
▶ 일봉/4시간봉에서 기관 신호 및 추세 강도 확인
▶ 주 트레이딩 방향 설정에 활용
• 하위 시간프레임 진입점 찾기:
▶ 상위 시간프레임 방향과 일치하는 하위 시간프레임 신호 대기
▶ 정밀한 진입점 포착에 활용
• 시간프레임 간 신호 일치 확인:
▶ 여러 시간프레임에서 동일한 방향의 신호가 발생할 때 신호 강도 증가
▶ 높은 확률의 트레이딩 기회 포착
─────────────────────────────────────
◆ 지표 설정 가이드
■ 주요 설정 매개변수
• Institutional Continuity Period (기관 연속성 확인 기간):
▶ 목적: 기관의 연속적인 매수/매도 활동을 확인할 기간 설정
▶ 낮은 값: 더 많은 신호 생성, 반응성 증가
▶ 높은 값: 신호 수 감소, 신뢰성 증가
• Trend Strength Threshold (추세 강도 임계값):
▶ 목적: 추세가 강하다고 판단할 최소 임계값 설정
▶ 낮은 값: 더 많은 신호, 낮은 필터링
▶ 높은 값: 더 강한 추세에서만 신호 생성, 높은 필터링
─────────────────────────────────────
◆ 다른 지표와의 시너지
• 지지/저항 레벨:
▶ 주요 지지/저항 레벨에서 발생하는 기관 신호는 확률이 더 높음
▶ 기술적 분석의 핵심 레벨과 기관 활동의 결합은 강력한 시그널 제공
• 이동평균선:
▶ 주요 이동평균선(50MA, 200MA) 근처에서 발생하는 기관 신호 주목
▶ 이동평균선 돌파와 기관 신호가 일치할 때 강한 추세 변화 가능성
• RSI/모멘텀 지표:
▶ 과매수/과매도 상태에서 발생하는 기관 신호는 반전 가능성 높임
▶ 모멘텀 다이버전스와 기관 신호의 일치는 강력한 반전 신호
• 볼륨 프로파일:
▶ 높은 볼륨 노드에서 발생하는 기관 신호는 중요한 가격 레벨 확인
▶ 주요 거래 영역에서의 기관 활동은 가격 방향에 큰 영향 미침
• 시장 구조:
▶ 주요 시장 구조(높은 고점/저점, 낮은 고점/저점) 근처에서 발생하는 기관 신호는 구조 변화 암시
▶ 시장 구조 변화와 기관 활동의 일치는 중요한 추세 전환점 표시
─────────────────────────────────────
◆ 결론
Coinbase Institutional Smart Money Detector는 코인베이스 프라임을 통한 기관 투자자들의 현물 비트코인 거래 활동을 실시간으로 추적하여 트레이더들에게 귀중한 통찰력을 제공합니다. 어떤 거래소의 비트코인 차트에도 적용 가능하기 때문에, 여러분이 선호하는 트레이딩 플랫폼에서 바로 활용할 수 있습니다.
이 지표의 핵심 가치는 일반 트레이더들이 접근하기 어려운 기관 자금 흐름 데이터를 직관적으로 시각화하여 제공한다는 점입니다. 연속적인 가격 움직임, 거래량 증가, 그리고 추세 강도를 종합적으로 분석하여 기관의 활동을 포착함으로써, 여러분은 시장의 큰 손들과 함께 움직일 수 있는 기회를 얻게 됩니다.
코인베이스 프라임 데이터를 기반으로 한 명확한 매수/매도 신호와 실시간 추세 강도 측정은 트레이더들이 시장 상황을 한눈에 파악하고 신속하게 전략적 결정을 내릴 수 있게 도와줍니다. 이 강력한 도구를 여러분의 트레이딩 전략에 통합함으로써, 시장의 스마트 머니가 어디로 흘러가는지 파악하고 그에 따라 포지셔닝할 수 있는 경쟁 우위를 확보하세요.
─────────────────────────────────────
※ 면책 조항: 모든 트레이딩 도구와 마찬가지로, Institutional Smart Money Detector는 보조 지표로 사용해야 하며 트레이딩 결정을 전적으로 의존해서는 안 됩니다. 과거의 기관 행동 패턴이 미래 시장 움직임을 보장하지는 않습니다. 항상 적절한 리스크 관리 전략을 트레이딩에 활용하세요.

52SIGNAL RECIPE Smart Money Detector : CME + Exchanges=================52SIGNAL RECIPE CME-Exchange Smart Money Detector=================
◆ Overview
The 52SIGNAL RECIPE CME-Exchange Smart Money Detector is an advanced technical indicator designed to identify institutional and smart money movements by analyzing and comparing futures markets across both CME and cryptocurrency exchanges. This powerful tool detects coordinated buying and selling patterns that often precede significant price movements, giving traders an edge in anticipating market direction.
What makes this indicator unique is its cross-market verification approach. By requiring confirmation from both CME Bitcoin futures (dominated by institutional players) and crypto exchange futures (with broader market participation), it significantly reduces false signals and identifies high-probability smart money footprints that typically lead market movements.
─────────────────────────────────────
◆ Key Features
• Dual Market Confirmation: Simultaneously analyzes both CME Bitcoin futures and exchange futures charts to identify synchronized smart money activity
• Smart Volume Analysis: Uses advanced algorithms to separate buying and selling volume based on candle structure and price action
• Energy Wave Visualization: Displays smart money signals as intuitive energy waves with varying sizes reflecting signal strength
• Strength Rating System: Quantifies signal strength on a 0-100% scale, with multiple visualization levels (10%+, 40%+, 60%+, 80%+)
• Candlestick Pattern Integration: Incorporates bullish/bearish candle formations to enhance signal reliability
• Volume Spike Detection: Identifies abnormal volume increases that often accompany smart money positioning
• Trend Context Analysis: Evaluates signals in relation to current market trend for higher probability setups
• Dynamic Strength Calculation: Uses a multi-factor model considering volume ratio, buying/selling imbalance, candle structure, and trend alignment
• Transparent Signal Labeling: Displays precise strength percentage values with each signal for clear decision-making
• Real-time Institutional Flow Monitor: Tracks the footprints of large players across both regulated (CME) and crypto exchange markets
─────────────────────────────────────
◆ Understanding Signal Types
■ Buy Signal Energy Waves (Green)
• Definition: Detected when significant buying pressure appears simultaneously on both CME and exchange futures, typically on bearish candles
• Visual Appearance: Green circular waves below price bars, with size/opacity increasing with signal strength
• Market Interpretation: Indicates institutional buying interest even as price is declining, often preceding bullish reversals
• Signal Strength Factors:
▶ Higher buying volume relative to selling volume
▶ Above-average total volume
▶ Lower wicks on bearish candles
▶ Appearance at key support levels
▶ Coinciding with oversold conditions
■ Sell Signal Energy Waves (Red)
• Definition: Detected when significant selling pressure appears simultaneously on both CME and exchange futures, typically on bullish candles
• Visual Appearance: Red circular waves above price bars, with size/opacity increasing with signal strength
• Market Interpretation: Indicates institutional selling interest even as price is rising, often preceding bearish reversals
• Signal Strength Factors:
▶ Higher selling volume relative to buying volume
▶ Above-average total volume
▶ Upper wicks on bullish candles
▶ Appearance at key resistance levels
▶ Coinciding with overbought conditions
─────────────────────────────────────
◆ Signal Strength Understanding
■ The Four Strength Levels
• Level 1 (10-39%): Initial Detection
▶ Visual: Smallest energy wave
▶ Meaning: Early smart money positioning detected
▶ Usage: Early warning, prepare for possible setup
• Level 2 (40-59%): Moderate Strength
▶ Visual: Medium-small energy wave
▶ Meaning: Clearer institutional positioning
▶ Usage: Begin position planning, watch for confirmation
• Level 3 (60-79%): Strong Signal
▶ Visual: Medium-large energy wave
▶ Meaning: Significant smart money footprint
▶ Usage: High-probability setup forming, consider entry
• Level 4 (80-100%): Exceptional Strength
▶ Visual: Largest energy wave
▶ Meaning: Powerful institutional movement confirmed
▶ Usage: Highest probability setup, strong conviction entry point
■ Understanding Signal Strength Calculation
• Volume Component (0-50 points):
▶ Measures how current volume compares to recent average
▶ Maximum points when volume is 2x or higher than average
• Buy/Sell Ratio Component (0-50 points):
▶ Measures imbalance between buying and selling pressure
▶ Maximum points when ratio exceeds predefined multiplier threshold
• Advanced Weighting Factors:
▶ Candle Structure: Body size, wick length, and orientation
▶ Trend Alignment: Signal relationship to current trend
▶ Volume Spike: Abnormal volume increase detection
▶ Cross-Market Confirmation: Strength of signal alignment between CME and exchange
─────────────────────────────────────
◆ Practical Trading Applications
■ Reversal Trading Strategy
• Buy Signal Application:
▶ Setup: Strong buy energy wave (60%+) on a bearish candle
▶ Entry: After confirmation candle following the signal
▶ Stop Loss: Below recent low or 1 ATR below entry
▶ Take Profit: Previous resistance or 1:2 risk-reward minimum
▶ Enhancers: Signal occurring at support zone, oversold conditions, or trend line tests
• Sell Signal Application:
▶ Setup: Strong sell energy wave (60%+) on a bullish candle
▶ Entry: After confirmation candle following the signal
▶ Stop Loss: Above recent high or 1 ATR above entry
▶ Take Profit: Previous support or 1:2 risk-reward minimum
▶ Enhancers: Signal occurring at resistance zone, overbought conditions, or trend line tests
■ Trend Continuation Strategy
• During Uptrends:
▶ Focus on buy signals that appear during pullbacks
▶ Higher probability when signals occur at key moving averages or support levels
▶ Enter on strength when price shows signs of resuming the uptrend
• During Downtrends:
▶ Focus on sell signals that appear during relief rallies
▶ Higher probability when signals occur at key moving averages or resistance levels
▶ Enter on strength when price shows signs of resuming the downtrend
■ Multiple Timeframe Approach
• Signal Confirmation Across Timeframes:
▶ Major signals on higher timeframes (4H, daily) provide strategic direction
▶ Signals on lower timeframes (15m, 1H) offer tactical entry points
▶ Highest probability setups occur when signals align across multiple timeframes
• Signal Clustering:
▶ Multiple signals in the same price area significantly increase probability
▶ Look for areas where both buy and sell signals have appeared, indicating battleground zones
▶ The most recent signal direction often wins these battles
─────────────────────────────────────
◆ Technical Foundation
■ Why Cross-Market Confirmation Matters
• Institutional Participation:
▶ CME Bitcoin futures are dominated by regulated institutional investors
▶ Crypto exchange futures include both retail and institutional players
▶ When both markets show the same smart money pattern, the signal reliability increases dramatically
• Market Inefficiency Exploitation:
▶ Large players often position across multiple venues to minimize market impact
▶ This coordinated activity creates detectable footprints when analyzed correctly
▶ Cross-market confirmation helps filter out market noise and isolate true smart money movements
■ Smart Volume Calculation Methodology
• Price-Volume Relationship Analysis:
▶ Uses candle structure to estimate buying vs. selling volume
▶ Buying volume = Total volume × (Close - Low) / (High - Low)
▶ Selling volume = Total volume × (High - Close) / (High - Low)
• Signal Triggering Logic:
▶ Buy signal: When buying volume exceeds selling volume by multiplier factor
▶ Sell signal: When selling volume exceeds buying volume by multiplier factor
▶ Both conditions must be met simultaneously on CME and exchange futures
• Advanced Pattern Recognition:
▶ Evaluates candle body-to-range ratio for signal quality
▶ Analyzes wick length and position for additional confirmation
▶ Considers recent highs/lows to detect potential turning points
─────────────────────────────────────
◆ Indicator Settings Guide
■ Main Settings
• CME Bitcoin Futures Symbol:
▶ Default: CME:BTC1!
▶ Purpose: Sets the CME futures contract to analyze alongside current chart
• Buy/Sell Volume Multiplier:
▶ Default: 3.0
▶ Range: 1.0-10.0
▶ Purpose: Determines how much buying volume must exceed selling volume (or vice versa) to trigger a signal
▶ Higher values = fewer but stronger signals
▶ Lower values = more signals but potentially lower reliability
■ Volume Filter Settings
• Enable Volume Filter:
▶ Default: Enabled
▶ Purpose: When enabled, only considers candles with above-threshold volume
• Volume Average Period:
▶ Default: 20 candles
▶ Range: 5-200 candles
▶ Purpose: Sets the lookback period for calculating average volume
• Volume Threshold:
▶ Default: 150%
▶ Range: 10%-500%
▶ Purpose: Minimum volume percentage (of average) required for signal consideration
▶ Higher values focus on only the most significant volume spikes
■ Signal Visualization
• Show Signal Strength Value:
▶ Default: Enabled
▶ Purpose: Displays the exact percentage strength value with each signal
• Energy Wave Colors:
▶ Buy Energy Wave: Green (#00ff80)
▶ Sell Energy Wave: Red (#ff4040)
▶ Purpose: Customize the appearance of energy waves for visual preference
■ Advanced Settings
• Use Advanced Strength Calculation:
▶ Default: Enabled
▶ Purpose: When enabled, uses the full multi-factor model for signal strength
▶ When disabled, uses only basic volume and ratio factors
─────────────────────────────────────
◆ Synergy with Other Indicators
• Support/Resistance Levels:
▶ Smart money signals occurring at key support/resistance significantly increase reliability
▶ Particularly powerful when signals appear at tested price levels
• Moving Averages:
▶ Signals near key moving averages (50MA, 200MA) often indicate institutional interest
▶ Moving average crosses combined with smart money signals create high-probability setups
• RSI/Momentum Indicators:
▶ Buy signals in oversold conditions increase probability of successful reversal
▶ Sell signals in overbought conditions increase probability of successful reversal
• Volume Profile:
▶ Signals occurring at high volume nodes often indicate significant turning points
▶ Low volume nodes between high volume areas can act as acceleration zones after signal triggers
• Market Structure:
▶ Smart money signals that break key market structure levels (higher highs/lows or lower highs/lows) are particularly significant
▶ Can signal the early stages of trend changes when aligned with structure breaks
─────────────────────────────────────
◆ Conclusion
The 52SIGNAL RECIPE CME-Exchange Smart Money Detector provides traders with a powerful edge by revealing institutional positioning across both regulated futures and crypto exchange markets. By requiring synchronized signals from both venues, it cuts through market noise to identify the most reliable smart money footprints.
What sets this indicator apart is its sophisticated cross-market verification system. Rather than relying on signals from a single market, it only triggers when both CME and exchange futures display the same smart money pattern simultaneously. This approach dramatically reduces false signals and highlights truly significant institutional activity.
The intuitive energy wave visualization system makes it easy to spot signals of varying strength, while the transparent percentage rating allows for objective assessment of each opportunity. By focusing on these dual-confirmed smart money movements, traders can position themselves alongside institutional players rather than against them.
Remember that the most powerful signals typically appear at key market junctures, often before significant price movements. By incorporating this indicator into your trading approach, you gain insight into institutional positioning that can help anticipate market direction with greater confidence.
─────────────────────────────────────
※ Disclaimer: Like all trading tools, the CME-Exchange Smart Money Detector should be used as a supplementary indicator and not relied upon exclusively for trading decisions. Past patterns of institutional behavior may not guarantee future market movements. Always employ appropriate risk management strategies in your trading.
================52SIGNAL RECIPE CME-Exchange Smart Money Detector==================
◆ 개요
52SIGNAL RECIPE CME-Exchange Smart Money Detector는 CME와 암호화폐 거래소의 선물 시장을 동시에 분석하여 기관 및 스마트 머니의 움직임을 포착하는 고급 기술적 지표입니다. 이 강력한 도구는 주요 가격 움직임에 선행하는 조직적인 매수 및 매도 패턴을 감지하여 트레이더들에게 시장 방향 예측에 유리한 정보를 제공합니다.
이 지표의 독보적인 특징은 교차 시장 검증 접근법에 있습니다. CME 비트코인 선물(기관 투자자 중심)과 암호화폐 거래소 선물(광범위한 시장 참여자) 모두에서 확인을 요구함으로써, 허위 신호를 크게 줄이고 일반적으로 시장 움직임을 선도하는 고확률 스마트 머니 흔적을 식별합니다.
─────────────────────────────────────
◆ 주요 특징
• 듀얼 마켓 확인: CME 비트코인 선물과 거래소 선물 차트를 동시에 분석하여 동기화된 스마트 머니 활동 식별
• 스마트 볼륨 분석: 캔들 구조와 가격 행동을 기반으로 매수 및 매도 볼륨을 분리하는 고급 알고리즘 사용
• 에너지 파동 시각화: 스마트 머니 신호를 신호 강도를 반영하는 다양한 크기의 직관적인 에너지 파동으로 표시
• 강도 평가 시스템: 신호 강도를 0-100% 척도로 수치화하고 여러 시각화 레벨(10%+, 40%+, 60%+, 80%+) 제공
• 캔들스틱 패턴 통합: 신호 신뢰성을 높이기 위해 상승/하락 캔들 형성을 분석에 통합
• 볼륨 스파이크 감지: 스마트 머니 포지셔닝을 동반하는 비정상적인 볼륨 증가 식별
• 추세 맥락 분석: 현재 시장 추세와 관련하여 신호를 평가하여 높은 확률의 설정 제공
• 동적 강도 계산: 볼륨 비율, 매수/매도 불균형, 캔들 구조 및 추세 일치도를 고려하는 다중 요소 모델 사용
• 투명한 신호 라벨링: 명확한 의사 결정을 위해 각 신호와 함께 정확한 강도 백분율 값 표시
• 실시간 기관 자금 흐름 모니터: 규제된(CME) 시장과 암호화폐 거래소 시장 모두에서 대형 플레이어의 흔적 추적
─────────────────────────────────────
◆ 신호 유형 이해하기
■ 매수 신호 에너지 파동 (녹색)
• 정의: 일반적으로 하락 캔들에서 CME와 거래소 선물 모두에서 동시에 상당한 매수 압력이 감지될 때 발생
• 시각적 모습: 가격 바 아래에 녹색 원형 파동으로 표시되며, 신호 강도에 따라 크기/불투명도 증가
• 시장 해석: 가격이 하락하는 동안에도 기관의 매수 관심이 있음을 나타내며, 종종 상승 반전에 선행
• 신호 강도 요소:
▶ 매도 볼륨 대비 높은 매수 볼륨
▶ 평균 이상의 총 거래량
▶ 하락 캔들의 아래 꼬리
▶ 주요 지지 수준에서의 출현
▶ 과매도 조건과 일치
■ 매도 신호 에너지 파동 (적색)
• 정의: 일반적으로 상승 캔들에서 CME와 거래소 선물 모두에서 동시에 상당한 매도 압력이 감지될 때 발생
• 시각적 모습: 가격 바 위에 적색 원형 파동으로 표시되며, 신호 강도에 따라 크기/불투명도 증가
• 시장 해석: 가격이 상승하는 동안에도 기관의 매도 관심이 있음을 나타내며, 종종 하락 반전에 선행
• 신호 강도 요소:
▶ 매수 볼륨 대비 높은 매도 볼륨
▶ 평균 이상의 총 거래량
▶ 상승 캔들의 위 꼬리
▶ 주요 저항 수준에서의 출현
▶ 과매수 조건과 일치
─────────────────────────────────────
◆ 신호 강도 이해하기
■ 네 가지 강도 레벨
• 레벨 1 (10-39%): 초기 감지
▶ 시각적: 가장 작은 에너지 파동
▶ 의미: 초기 스마트 머니 포지셔닝 감지
▶ 활용: 초기 경고, 가능한 설정 준비
• 레벨 2 (40-59%): 중간 강도
▶ 시각적: 중간-작은 에너지 파동
▶ 의미: 더 명확한 기관 포지셔닝
▶ 활용: 포지션 계획 시작, 확인 대기
• 레벨 3 (60-79%): 강한 신호
▶ 시각적: 중간-큰 에너지 파동
▶ 의미: 중요한 스마트 머니 흔적
▶ 활용: 고확률 설정 형성, 진입 고려
• 레벨 4 (80-100%): 예외적 강도
▶ 시각적: 가장 큰 에너지 파동
▶ 의미: 강력한 기관 움직임 확인
▶ 활용: 최고 확률 설정, 강한 확신의 진입 지점
■ 신호 강도 계산 이해하기
• 볼륨 구성 요소 (0-50 포인트):
▶ 현재 볼륨이 최근 평균과 비교하여 얼마나 높은지 측정
▶ 볼륨이 평균보다 2배 이상 높을 때 최대 포인트 부여
• 매수/매도 비율 구성 요소 (0-50 포인트):
▶ 매수와 매도 압력 간의 불균형 측정
▶ 비율이 미리 정의된 배율 임계값을 초과할 때 최대 포인트 부여
• 고급 가중치 요소:
▶ 캔들 구조: 몸통 크기, 꼬리 길이 및 방향
▶ 추세 일치: 현재 추세와의 신호 관계
▶ 볼륨 스파이크: 비정상적인 볼륨 증가 감지
▶ 교차 시장 확인: CME와 거래소 간 신호 일치 강도
─────────────────────────────────────
◆ 실전 트레이딩 응용
■ 반전 트레이딩 전략
• 매수 신호 응용:
▶ 설정: 하락 캔들에서 강한 매수 에너지 파동(60%+)
▶ 진입: 신호 이후 확인 캔들 이후
▶ 손절: 최근 저점 아래 또는 진입점 아래 1 ATR
▶ 이익실현: 이전 저항 또는 최소 1:2 리스크-리워드
▶ 강화 요소: 지지 구역, 과매도 조건 또는 추세선 테스트에서 발생하는 신호
• 매도 신호 응용:
▶ 설정: 상승 캔들에서 강한 매도 에너지 파동(60%+)
▶ 진입: 신호 이후 확인 캔들 이후
▶ 손절: 최근 고점 위 또는 진입점 위 1 ATR
▶ 이익실현: 이전 지지 또는 최소 1:2 리스크-리워드
▶ 강화 요소: 저항 구역, 과매수 조건 또는 추세선 테스트에서 발생하는 신호
■ 추세 지속 전략
• 상승 추세 중:
▶ 조정 중에 나타나는 매수 신호에 집중
▶ 주요 이동평균선이나 지지 수준에서 신호가 발생할 때 확률이 높음
▶ 가격이 상승 추세를 재개할 징후를 보일 때 강도에 맞춰 진입
• 하락 추세 중:
▶ 일시적 반등 중에 나타나는 매도 신호에 집중
▶ 주요 이동평균선이나 저항 수준에서 신호가 발생할 때 확률이 높음
▶ 가격이 하락 추세를 재개할 징후를 보일 때 강도에 맞춰 진입
■ 다중 시간프레임 접근법
• 다양한 시간프레임에서의 신호 확인:
▶ 상위 시간프레임(4시간, 일봉)의 주요 신호는 전략적 방향 제공
▶ 하위 시간프레임(15분, 1시간)의 신호는 전술적 진입 지점 제공
▶ 여러 시간프레임에서 신호가 일치할 때 가장 높은 확률의 설정 발생
• 신호 클러스터링:
▶ 동일한 가격 영역에서 여러 신호가 발생하면 확률이 크게 증가
▶ 매수와 매도 신호가 모두 나타난 영역을 찾아 전투 구역 식별
▶ 이러한 전투에서는 대개 가장 최근의 신호 방향이 우세
─────────────────────────────────────
◆ 기술적 기반
■ 교차 시장 확인이 중요한 이유
• 기관 참여:
▶ CME 비트코인 선물은 규제된 기관 투자자가 주도
▶ 암호화폐 거래소 선물은 소매 및 기관 플레이어 모두 포함
▶ 두 시장이 동일한 스마트 머니 패턴을 보일 때 신호 신뢰성이 크게 증가
• 시장 비효율성 활용:
▶ 대형 플레이어들은 시장 영향을 최소화하기 위해 여러 거래소에 걸쳐 포지션을 취하는 경우가 많음
▶ 이러한 조직적인 활동은 올바르게 분석할 때 감지 가능한 흔적을 남김
▶ 교차 시장 확인은 시장 노이즈를 필터링하고 진정한 스마트 머니 움직임을 분리하는 데 도움
■ 스마트 볼륨 계산 방법론
• 가격-볼륨 관계 분석:
▶ 캔들 구조를 사용하여 매수 대 매도 볼륨 추정
▶ 매수 볼륨 = 총 볼륨 × (종가 - 저가) / (고가 - 저가)
▶ 매도 볼륨 = 총 볼륨 × (고가 - 종가) / (고가 - 저가)
• 신호 트리거 로직:
▶ 매수 신호: 매수 볼륨이 매도 볼륨을 배율 요소만큼 초과할 때
▶ 매도 신호: 매도 볼륨이 매수 볼륨을 배율 요소만큼 초과할 때
▶ 두 조건 모두 CME와 거래소 선물에서 동시에 충족되어야 함
• 고급 패턴 인식:
▶ 신호 품질을 위한 캔들 몸통-범위 비율 평가
▶ 추가 확인을 위한 꼬리 길이 및 위치 분석
▶ 잠재적 전환점을 감지하기 위해 최근 고점/저점 고려
─────────────────────────────────────
◆ 지표 설정 가이드
■ 주요 설정
• CME 비트코인 선물 심볼:
▶ 기본값: CME:BTC1!
▶ 목적: 현재 차트와 함께 분석할 CME 선물 계약 설정
• 매수/매도 볼륨 배율:
▶ 기본값: 3.0
▶ 범위: 1.0-10.0
▶ 목적: 신호를 트리거하기 위해 매수 볼륨이 매도 볼륨을 얼마나 초과해야 하는지(또는 그 반대) 결정
▶ 높은 값 = 적지만 더 강한 신호
▶ 낮은 값 = 더 많은 신호지만 잠재적으로 낮은 신뢰성
■ 볼륨 필터 설정
• 볼륨 필터 활성화:
▶ 기본값: 활성화됨
▶ 목적: 활성화되면 임계값 이상의 볼륨을 가진 캔들만 고려
• 볼륨 평균 기간:
▶ 기본값: 20 캔들
▶ 범위: 5-200 캔들
▶ 목적: 평균 볼륨 계산을 위한 룩백 기간 설정
• 볼륨 임계값:
▶ 기본값: 150%
▶ 범위: 10%-500%
▶ 목적: 신호 고려에 필요한 최소 볼륨 백분율(평균 대비)
▶ 높은 값은 가장 중요한 볼륨 스파이크에만 집중
■ 신호 시각화
• 신호 강도 값 표시:
▶ 기본값: 활성화됨
▶ 목적: 각 신호와 함께 정확한 백분율 강도 값 표시
• 에너지 파동 색상:
▶ 매수 에너지 파동: 녹색(#00ff80)
▶ 매도 에너지 파동: 적색(#ff4040)
▶ 목적: 시각적 선호도에 맞게 에너지 파동의 모양 사용자 정의
■ 고급 설정
• 고급 강도 계산 사용:
▶ 기본값: 활성화됨
▶ 목적: 활성화되면 신호 강도에 전체 다중 요소 모델 사용
▶ 비활성화되면 기본 볼륨 및 비율 요소만 사용
─────────────────────────────────────
◆ 다른 지표와의 시너지
• 지지/저항 레벨:
▶ 주요 지지/저항에서 발생하는 스마트 머니 신호는 신뢰성을 크게 높임
▶ 특히 테스트된 가격 레벨에서 신호가 나타날 때 강력함
• 이동평균선:
▶ 주요 이동평균선(50MA, 200MA) 근처의 신호는 종종 기관의 관심을 나타냄
▶ 이동평균선 교차와 스마트 머니 신호의 조합은 고확률 설정 생성
• RSI/모멘텀 지표:
▶ 과매도 조건에서의 매수 신호는 성공적인 반전 확률 증가
▶ 과매수 조건에서의 매도 신호는 성공적인 반전 확률 증가
• 볼륨 프로파일:
▶ 높은 볼륨 노드에서 발생하는 신호는 종종 중요한 전환점을 나타냄
▶ 높은 볼륨 영역 사이의 낮은 볼륨 노드는 신호 트리거 후 가속 구간으로 작용할 수 있음
• 시장 구조:
▶ 주요 시장 구조 레벨(높은 고점/저점 또는 낮은 고점/저점)을 깨는 스마트 머니 신호는 특히 중요
▶ 구조 깨짐과 일치할 때 추세 변화의 초기 단계를 알릴 수 있음
─────────────────────────────────────
◆ 결론
52SIGNAL RECIPE CME-Exchange Smart Money Detector는 규제된 선물 시장과 암호화폐 거래소 시장 모두에서 기관의 포지셔닝을 드러냄으로써 트레이더에게 강력한 우위를 제공합니다. 두 거래소에서 동기화된 신호를 요구함으로써, 시장 노이즈를 제거하고 가장 신뢰할 수 있는 스마트 머니 흔적을 식별합니다.
이 지표를 차별화하는 것은 정교한 교차 시장 검증 시스템입니다. 단일 시장의 신호에 의존하는 대신, CME와 거래소 선물 모두가 동시에 동일한 스마트 머니 패턴을 표시할 때만 트리거됩니다. 이 접근 방식은 허위 신호를 크게 줄이고 진정으로 중요한 기관 활동을 강조합니다.
직관적인 에너지 파동 시각화 시스템을 통해 다양한 강도의 신호를 쉽게 발견할 수 있으며, 투명한 백분율 평가를 통해 각 기회를 객관적으로 평가할 수 있습니다. 이러한 이중 확인된 스마트 머니 움직임에 집중함으로써, 트레이더는 기관 참가자들에 대항하기보다는 그들과 함께 포지션을 취할 수 있습니다.
가장 강력한 신호는 일반적으로 주요 시장 변곡점에서, 종종 중요한 가격 움직임 이전에 나타난다는 점을 기억하세요. 이 지표를 트레이딩 접근법에 통합함으로써, 시장 방향을 더 높은 확신으로 예측하는 데 도움이 되는 기관 포지셔닝에 대한 통찰력을 얻을 수 있습니다.
─────────────────────────────────────
※ 면책 조항: 모든 트레이딩 도구와 마찬가지로, CME-Exchange Smart Money Detector는 보조 지표로 사용되어야 하며 트레이딩 결정을 전적으로 의존해서는 안 됩니다. 과거의 기관 행동 패턴이 미래 시장 움직임을 보장하지는 않습니다. 항상 적절한 리스크 관리 전략을 트레이딩에 사용하세요.

Bitcoin Institutional Volume AnchorsBitcoin Institutional Volume Anchors
Indicator Overview:
The Bitcoin Institutional Volume Anchors indicator is a professional-grade VWAP analysis tool designed for sophisticated Bitcoin trading strategies. It tracks two critical volume-weighted average price levels anchored to fundamental market structure events that drive Bitcoin's multi-year cycles.
-Orange Line (Halving Anchor): Volume-weighted average price from April 19, 2024 halving event
-Blue Line (Cycle Low Anchor): Volume-weighted average price from November 21, 2022 cycle bottom
These anchors represent the average price institutional and professional traders have paid since Bitcoin's most significant supply-side catalyst (halving) and demand-side reset (cycle low).
Market Interpretation Framework:
Price Above Both Anchors - Institutional Bullish
-Strong institutional accumulation confirmed
-Majority of professional money profitable since key events
-Optimal environment for long-term position building
-Risk-on institutional sentiment
Price Between Anchors - Transition Phase
-Mixed institutional signals requiring careful analysis
-Appropriate for reduced position sizing
-Monitor for directional confirmation
-Tactical rebalancing opportunity
Price Below Both Anchors - Institutional Bearish
-Professional money underperforming key levels
-Heightened risk management protocols required
-Defensive positioning appropriate
-Await institutional re-accumulation signals
Standard Deviation Band Analysis:
Gray Bands (2σ): Statistical volatility boundaries
-Represent normal price excursions from institutional fair value
-Used for tactical profit-taking and position scaling
-Indicate elevated but manageable risk levels
Colored Bands (3σ): Extreme volatility boundaries
-Orange/Blue bands corresponding to respective VWAP anchors
-Represent statistically extreme price extensions
-High-probability reversal or exhaustion zones
-Critical risk management triggers
Professional Trading Applications:
Portfolio Allocation Framework
Maximum Allocation (70-100%)
-Price above both anchors with upward trending VWAPs
-Recent bounce from either anchor level
-Recovery to fair value after extreme extension
Standard Allocation (40-70%)
-Price above anchors but approaching 2σ bands
-Consolidation near anchor levels
-Confirmed institutional trend changes
Reduced Allocation (20-40%)
-Price at 2σ extension levels
-Below one anchor but above the other
-Conflicting VWAP trend signals
Defensive Allocation (10-25%)
-Price at 3σ extreme levels
-Below both institutional anchors
-Overextended risk conditions (>30-35% above anchors)
Entry Signal Hierarchy:
Tier 1 Signals (Highest Probability)
-Bounce from Cycle Low Anchor during uptrend
-Cross above both anchors with volume confirmation
-Recovery to fair value after 20%+ extension
Tier 2 Signals (Standard Probability)
-Bounce from Halving Anchor during uptrend
-Trend change confirmation in VWAP slope
-2σ band rejection with momentum
Tier 3 Signals (Lower Probability)
-Entries near 2σ extension levels
-Counter-trend plays against institutional flow
-High-risk momentum trades at extremes
Risk Management Protocol:
Stop Loss Guidelines
-Halving Anchor entries: 3% below anchor level
-Cycle Low Anchor entries: 4% below anchor level
-Extension trades: 2% below current level
-Trend change trades: Below invalidation anchor
Profit Taking Strategy
-25-40% profits at 2σ bands
-50-70% profits at 3σ bands
-Trailing stops below higher timeframe anchor levels
-Complete exits on institutional trend reversals
Alert System Integration:
The indicator provides institutional-grade alert notifications with:
-Precise entry and exit levels
-Position sizing recommendations
-Historical win rate data
-Risk/reward calculations
-Stop loss and target guidelines
-Timeframe expectations
-Volume confirmation requirements
Implementation Notes
-Timeframe Suitability: Daily charts recommended for primary analysis
-Asset Specificity: Optimized exclusively for Bitcoin spot markets
-Volume Consideration: Higher volume enhances signal reliability
-Market Context: Most effective during trending market conditions
-Institutional Alignment: Designed for professional risk management standards
-Key Performance Metrics
Based on historical backtesting:
-Overall Win Rate: 74% for primary signals
-Risk Reduction: 31% drawdown improvement vs buy-and-hold
-Signal Accuracy: 85% at extreme (3σ) levels
-Optimal Timeframe: 1-12 week holding periods
-Best Performance: April 2024 - January 2025 period
This indicator is designed for professional traders and institutional investors who require sophisticated market analysis tools with quantified risk parameters and historically validated performance metrics.

Institutional Sessions Overlay (Asia/London/NY)Institutional Sessions Overlay is a professional TradingView indicator that visually highlights the main trading sessions (Asia, London, and New York) directly on your chart.
Customizable: Easily adjust session start and end times (including minutes) for each market.
Timezone Alignment: Shift session boxes using the timezone offset parameter so sessions match your chart’s timezone exactly.
Clear Visuals: Colored boxes and optional labels display session opens and closes for fast institutional market structure reference.
Toggle Labels: Show or hide session open/close labels with a single click for a clean or detailed look.
Intuitive UI: User-friendly grouped settings for efficient configuration.
This tool is designed for day traders, institutional traders, and anyone who wants to instantly recognize global session timing and ranges for SMC, ICT, and other session-based strategies.
How to use:
Set your chart to your local timezone.
Use the "Session timezone offset" setting if session boxes do not match actual session opens on your chart.
Adjust the hours and minutes for each session as needed.
Enable or disable labels in the “Display” settings group.
Tip: Use the overlay to spot session highs and lows, volatility windows, and institutional liquidity sweeps.

Chaikin Money Flow (CMF) [ParadoxAlgo]OVERVIEW
This indicator implements the Chaikin Money Flow oscillator as an overlay on the price chart, designed to help traders identify institutional money flow patterns. The Chaikin Money Flow combines price and volume data to measure the flow of money into and out of a security, making it particularly useful for detecting accumulation and distribution phases.
WHAT IS CHAIKIN MONEY FLOW?
Chaikin Money Flow was developed by Marc Chaikin and measures the amount of Money Flow Volume over a specific period. The indicator oscillates between +1 and -1, where:
Positive values indicate money flowing into the security (accumulation)
Negative values indicate money flowing out of the security (distribution)
Values near zero suggest equilibrium between buying and selling pressure
CALCULATION METHOD
Money Flow Multiplier = ((Close - Low) - (High - Close)) / (High - Low)
Money Flow Volume = Money Flow Multiplier × Volume
CMF = Sum of Money Flow Volume over N periods / Sum of Volume over N periods
KEY FEATURES
Big Money Detection:
Identifies significant institutional activity when CMF exceeds user-defined thresholds
Requires volume confirmation (volume above average) to validate signals
Uses battery icon (🔋) for institutional buying and lightning icon (⚡) for institutional selling
Visual Elements:
Background coloring based on money flow direction
Support and resistance levels calculated using Average True Range
Real-time dashboard showing current CMF value, volume strength, and signal status
Customizable Parameters:
CMF Period: Calculation period for the money flow (default: 20)
Signal Smoothing: EMA smoothing applied to reduce noise (default: 5)
Big Money Threshold: CMF level required to trigger institutional signals (default: 0.15)
Volume Threshold: Volume multiplier required for signal confirmation (default: 1.5x)
INTERPRETATION
Signal Types:
🔋 (Battery): Indicates strong institutional buying when CMF > threshold with high volume
⚡ (Lightning): Indicates strong institutional selling when CMF < -threshold with high volume
Background color: Green tint for positive money flow, red tint for negative money flow
Dashboard Information:
CMF Value: Current Chaikin Money Flow reading
Volume: Current volume as a multiple of 20-period average
Big Money: Status of institutional activity (BUYING/SELLING/QUIET)
Signal: Strength assessment (STRONG/MEDIUM/WEAK)
TRADING APPLICATIONS
Trend Confirmation: Use CMF direction to confirm price trends
Divergence Analysis: Look for divergences between price and money flow
Volume Validation: Confirm breakouts with corresponding money flow
Accumulation/Distribution: Identify phases of institutional activity
PARAMETER RECOMMENDATIONS
Day Trading: CMF Period 14-21, higher sensitivity settings
Swing Trading: CMF Period 20-30, moderate sensitivity
Position Trading: CMF Period 30-50, lower sensitivity for major trends
ALERTS
Optional alert system notifies users when:
Big money buying is detected (CMF above threshold with volume confirmation)
Big money selling is detected (CMF below negative threshold with volume confirmation)
LIMITATIONS
May generate false signals in low-volume conditions
Best used in conjunction with other technical analysis tools
Effectiveness varies across different market conditions and timeframes
EDUCATIONAL PURPOSE
This open-source indicator is provided for educational purposes to help traders understand money flow analysis. It demonstrates the practical application of the Chaikin Money Flow concept with visual enhancements for easier interpretation.
TECHNICAL SPECIFICATIONS
Overlay indicator (displays on price chart)
No repainting - all calculations are based on closed bar data
Suitable for all timeframes and asset classes
Minimal resource usage for optimal performance
DISCLAIMER
This indicator is for educational and informational purposes only. Past performance does not guarantee future results. Always conduct your own analysis and consider risk management before making trading decisions.

TradingIQ - OrderFlow IQIntroducing “OrderFlow IQ”
OrderFlow IQ is an all-in-one order-flow and volume-profiling suite crafted to bring true market microstructure to your TradingView charts. It bundles footprints, per-bar and intra-bar delta analytics, class-based delta tracking, adaptive volume profiles, bubble-style trade tapes, live time-and-sales feeds, cumulative-volume fight meters, iceberg detection, and more—all driven by a single, user-friendly interface.
Features
The list below details an ever=expanding list of the indicators capabilities; more to come in the future!
Tick-based Footprints
Imbalance and stacked imbalance detection
Tick-based chronicled volume profile
Delta classification (small order, medium order, and block order delta)
Tick-based order flow bubble tape
Live order feed with total buying volume against total selling volume
Tick-based CVD
Iceberg order detection
Delta class lines
Tick-based bar statistics
Key Components and Their Functions
Data Granularity
• 1-Tick / 1-Second / 1-Minute modes let you choose the resolution of every calculation. On true tick charts you get genuine tick-by-tick precision; on second charts you see every intra-second print; on anything else it falls back to minute bars.
Footprint Engine
Bid vs Ask Volume Columns – Each candle is sliced into tick-level price rows showing buy-volume, sell-volume, total volume, delta and delta%.
CVD-Level Columns – Optionally color each row by net cumulative delta instead of raw volume to spotlight buying or selling pressure trends.
Imbalance Detection – Highlight rows where one side exceeds your % threshold, with “stacked” imbalances calling out multi-row alignment ahead of potential breaks.
Value Area & POC – Automatically compute and draw the 70% value area (VAH/VAL) and mark the Point of Control per session or any chosen timeframe.
Footprint
The image above shows the volume profiling data calculated for each row across the footprint engine.
Delta: Shows the net difference between buying and selling
Delta Percentage: Calculates delta as a percentage of total volume
Total Volume: The total volume at the price block
Buy Volume: The total buying volume at the price block
Sell Volume: The total selling volume at the price block
Additionally, you can select to only show buying volume and selling volume at each price block, as shown in the image above.
POC
The image above shows the visuals used to mark the POC of the footprint. The POC is marked yellow by default; the color can be changed in the settings.
Value Area
The image above shows the visuals used to mark the value area of the footprint.
Imbalance Detection
The image above shows the Footprint Engine detecting and marking buying/selling imbalances.
Stacked Imbalances
The image above shows the Footprint Engine detecting and marking stacked imbalances. Stacked imbalances are shown as consecutive, small blocks to the right of the footprint.
CVD Levels
The image above shows the footprint engine calculating CVD across the footprint, rather than net delta that resets bar by bar. Traders can enable the "Use CVD Levels" setting to have net delta persist across price bars, allowing traders to see the net CVD across various price blocks as the footprint develops.
Delta Class Statistics
With the inclusion of tick volume, The Delta Class Statistics component of the indicator classifies volume delta by order size to give traders detailed insights into whether small players are buying/selling and whether big players are buying/selling.
The image above shows a full view of the Delta Class Statistics feature.
The image above further explains the Delta Class Statistics view.
Orders are distributed (classified) across various order size amounts. From here, a rolling CVD is calculated across each order size. This feature gives traders detailed insights into whether big money is buying/selling (big player sentiment) and whether small money is buying/selling (small player sentiment).
Analysis
The image above shows a net-negative CVD for the session for both small orders (small money) and big orders (big money), while "medium" sized orders are currently at a net-positive CVD.
Consequently, sentiment for big players is bearish.
Additionally, small triangles are printed alongside each Delta Class box for each bar. You can hover over these labels with your cursor to see the net delta for the bar for each order size.
Bar Delta Statistics
With the inclusion of tick data, OrderFlow IQ is designed to generate detailed tick-based bar statistics for each candlestick.
The image above shows the feature in action.
Metrics
Volume: Total volume for the bar
Bar VWAP: The individual bar's VWAP
Delta: Net delta for the bar
Delta %: Delta % of the bar
Max Delta: The maximum positive delta achieved during the bar
Min Delta: The lowest negative delta achieved during the bar
CVD: Cumulative volume delta measurement by the bar
Buy Volume: Total buying volume for the bar
Sell Volume: Total selling volume for the bar
Iceberg Detection (Tick-Data Only)
An Iceberg Order is a type of large trading order that is broken up into much smaller visible portions. Only a small part of the order is displayed in the public order book at any given time, while the rest is hidden (like an iceberg where only the tip is above water).
Why are Iceberg Orders Important?
Minimizing Market Impact
If a trader were to post a 10,000-share sell order openly, the market would immediately react:
Buyers might panic, thinking there's a rush to sell.
Sellers could undercut the price aggressively.
This would likely drive the price down before the large order even finishes executing.
By revealing only a small portion at a time, Iceberg orders help avoid spooking the market and allow the trader to sell closer to the original price.
Hiding Trading Intentions
Markets are highly sensitive to order flow — the balance of buying and selling pressure.
If competitors, market makers, or algorithmic traders see a massive order, they might:
Front-run it (selling before it completes to profit from the expected price drop).
Reassess their own models about supply/demand imbalances.
Iceberg orders protect against this by masking true supply or demand.
Our Iceberg Detection Model
Using a proprietary iceberg order detection algorithm, OrderFlow IQ is capable of detecting/alerting iceberg orders when they occur.
The image above shows the Iceberg Detector in action.
When an iceberg order is identified, the size of the order in the quote currency, price of execution, and number of executions will be displayed.
It's important to set alerts for this feature, as iceberg orders aren't frequent and are easy to miss when away from the chart.
IQ Volume Profile (Chronicled Volume Profile)
OrderFlow IQ generates a Chronicled Volume Profile to give traders detailed insights into net delta by price level, but also historical net delta by price level.
The image above shows the feature in action. While the chronicled volume profile is seemingly a normal volume profile, the narrow-lines across the chronicle profile show historical min/max delta at each price level.
The image above exemplifies the feature.
The wide price blocks show the current net delta at each price area, while the small lines (with a circle at the end) show historical min/max delta at the price level.
This tool allows traders to see if buying/selling always dominated a price level, or if control of the price level changed hands between buyers/sellers throughout development of the profile.
Additionally, traders can hover over the small circles on the profile with their cursor to see the detailed delta statistics at each price area. The statistics will show the minimum delta at the price area, maximum delta, and the live change in delta.
Order Feed
OrderFlow IQ is capable of generating a live order feed with various metrics to assist real time orderflow traders in their analysis.
The image above exemplifies the feature.
Bid/Ask: The bid price and ask price of the current bar
Buys | Price: The size of a buy order and price of execution
Sells | Price: The size of a sell order and price of execution
▴ Vol: Cumulative buying volume (in quote currency) for the feed
▾ Vol: Cumulative selling volume (in quote currency) for the feed
Speed of tape: The average speed between each order fill
OrderFlow Bubble Tape
OrderFlow IQ also displays a traditional orderflow indicator, also known as OrderFlow Bubble Tape.
The image above shows the feature in action.
Orderflow Bubble Tape is a visual tool that shows recent market trades ("tape") as bubbles, where each bubble represents a trade.
The size of each bubble indicates the trade size (volume), and the color shows whether the trade was a buy (aggressive at the ask) or sell (aggressive at the bid).
Instead of showing trades as plain text (like a traditional tape), the bubble format makes it easier to spot bursts of aggressive buying or selling visually.
Clusters of large, fast bubbles in one color suggest momentum or imbalances in order flow, often signaling short-term price pressure.
Traders use Bubble Tape to quickly read supply/demand dynamics, identify hidden buyers/sellers (like iceberg orders), and anticipate short-term price moves.
Blue Bubble = Buy
Red Bubble = Sell
The larger the bubble, the larger the order. Traders can hover over each bubble with their cursor to see the exact size of the order.
Delta Class Lines
OrderFlow IQ shows Live Delta Class Lines grouped by order size buckets:
The blue line shows delta coming only from very large orders (100K–10B in size).
The red line shows delta coming from medium-large orders (50K–100K size).
The green line shows delta from small to medium orders (0–50K size).
Each line is the cumulative net delta for its class — meaning it is adding the buy and sell imbalances only from trades of that size class, live as trades occur.
For example, when a 30K-sized aggressive buy hits, it adds to the green line; if a 70K-sized sell hits, it subtracts from the red line.
The number next to each label is the current net delta value for that class, telling you whether buyers or sellers are dominating at that order size.
• Three Custom Dollar Brackets – Define “small,” “mid,” and “block” trade-size ranges (e.g., 0–50 K, 50 K–100 K, > 100 K).
• Live Streaming Lines – While a bar is forming, watch real-time totals for each bracket plotted as vertical columns or stair-step lines on the chart edge.
CVD
OrderFlow IQ also displays CVD as either candles or a line.
The image above shows the candles visualization for CVD. CVD can be calculated using tick data, 1-second bars, or 1-minute bars. The higher the granularity the more accurate the measurement.
More Features To Come
New features and calculations will be added to OrderFlow IQ based on community feedback, so feel free to share any requests you might have!
Summary
OrderFlow IQ brings a full suite of order-flow analytics into one Pine Script: footprints, delta analytics, dollar-bracket classes, adaptive profiles, bubble tapes, live feeds, CVD meters, and iceberg scans. Its unified Data Granularity switch and Preset System let you toggle entire dashboards with a click—scalpers, intraday traders, and long-term analysts alike can dial in the exact microstructure view they need without switching scripts. Publish once, share your preset layouts, and your TradingView community gains plug-and-play access to professional-grade order-flow tools—no extra installations or feeds required.
Script pago

Volatility Quality [Alpha Extract]The Alpha-Extract Volatility Quality (AVQ) Indicator provides traders with deep insights into market volatility by measuring the directional strength of price movements. This sophisticated momentum-based tool helps identify overbought and oversold conditions, offering actionable buy and sell signals based on volatility trends and standard deviation bands.
🔶 CALCULATION
The indicator processes volatility quality data through a series of analytical steps:
Bar Range Calculation: Measures true range (TR) to capture price volatility.
Directional Weighting: Applies directional bias (positive for bullish candles, negative for bearish) to the true range.
VQI Computation: Uses an exponential moving average (EMA) of weighted volatility to derive the Volatility Quality Index (VQI).
vqiRaw = ta.ema(weightedVol, vqiLen)
Smoothing: Applies an additional EMA to smooth the VQI for clearer signals.
Normalization: Optionally normalizes VQI to a -100/+100 scale based on historical highs and lows.
Standard Deviation Bands: Calculates three upper and lower bands using standard deviation multipliers for volatility thresholds.
vqiStdev = ta.stdev(vqiSmoothed, vqiLen)
upperBand1 = vqiSmoothed + (vqiStdev * stdevMultiplier1)
upperBand2 = vqiSmoothed + (vqiStdev * stdevMultiplier2)
upperBand3 = vqiSmoothed + (vqiStdev * stdevMultiplier3)
lowerBand1 = vqiSmoothed - (vqiStdev * stdevMultiplier1)
lowerBand2 = vqiSmoothed - (vqiStdev * stdevMultiplier2)
lowerBand3 = vqiSmoothed - (vqiStdev * stdevMultiplier3)
Signal Generation: Produces overbought/oversold signals when VQI reaches extreme levels (±200 in normalized mode).
Formula:
Bar Range = True Range (TR)
Weighted Volatility = Bar Range × (Close > Open ? 1 : Close < Open ? -1 : 0)
VQI Raw = EMA(Weighted Volatility, VQI Length)
VQI Smoothed = EMA(VQI Raw, Smoothing Length)
VQI Normalized = ((VQI Smoothed - Lowest VQI) / (Highest VQI - Lowest VQI) - 0.5) × 200
Upper Band N = VQI Smoothed + (StdDev(VQI Smoothed, VQI Length) × Multiplier N)
Lower Band N = VQI Smoothed - (StdDev(VQI Smoothed, VQI Length) × Multiplier N)
🔶 DETAILS
Visual Features:
VQI Plot: Displays VQI as a line or histogram (lime for positive, red for negative).
Standard Deviation Bands: Plots three upper and lower bands (teal for upper, grayscale for lower) to indicate volatility thresholds.
Reference Levels: Horizontal lines at 0 (neutral), +100, and -100 (in normalized mode) for context.
Zone Highlighting: Overbought (⋎ above bars) and oversold (⋏ below bars) signals for extreme VQI levels (±200 in normalized mode).
Candle Coloring: Optional candle overlay colored by VQI direction (lime for positive, red for negative).
Interpretation:
VQI ≥ 200 (Normalized): Overbought condition, strong sell signal.
VQI 100–200: High volatility, potential selling opportunity.
VQI 0–100: Neutral bullish momentum.
VQI 0 to -100: Neutral bearish momentum.
VQI -100 to -200: High volatility, strong bearish momentum.
VQI ≤ -200 (Normalized): Oversold condition, strong buy signal.
🔶 EXAMPLES
Overbought Signal Detection: When VQI exceeds 200 (normalized), the indicator flags potential market tops with a red ⋎ symbol.
Example: During strong uptrends, VQI reaching 200 has historically preceded corrections, allowing traders to secure profits.
Oversold Signal Detection: When VQI falls below -200 (normalized), a lime ⋏ symbol highlights potential buying opportunities.
Example: In bearish markets, VQI dropping below -200 has marked reversal points for profitable long entries.
Volatility Trend Tracking: The VQI plot and bands help traders visualize shifts in market momentum.
Example: A rising VQI crossing above zero with widening bands indicates strengthening bullish momentum, guiding traders to hold or enter long positions.
Dynamic Support/Resistance: Standard deviation bands act as dynamic volatility thresholds during price movements.
Example: Price reversals often occur near the third standard deviation bands, providing reliable entry/exit points during volatile periods.
🔶 SETTINGS
Customization Options:
VQI Length: Adjust the EMA period for VQI calculation (default: 14, range: 1–50).
Smoothing Length: Set the EMA period for smoothing (default: 5, range: 1–50).
Standard Deviation Multipliers: Customize multipliers for bands (defaults: 1.0, 2.0, 3.0).
Normalization: Toggle normalization to -100/+100 scale and adjust lookback period (default: 200, min: 50).
Display Style: Switch between line or histogram plot for VQI.
Candle Overlay: Enable/disable VQI-colored candles (lime for positive, red for negative).
The Alpha-Extract Volatility Quality Indicator empowers traders with a robust tool to navigate market volatility. By combining directional price range analysis with smoothed volatility metrics, it identifies overbought and oversold conditions, offering clear buy and sell signals. The customizable standard deviation bands and optional normalization provide precise context for market conditions, enabling traders to make informed decisions across various market cycles.

COT3 - Flip Strength Index - Invincible3This indicator uses the TradingView COT library to visualize institutional positioning and potential sentiment or trend shifts. It compares the long% vs short% of commercial and non-commercial traders for both Pair A and Pair B, helping traders identify trend strength, market overextension, and early reversal signals.
🔷 COT RSI
The COT RSI normalizes the net positioning difference between non-commercial and commercial traders over (N=13, 26, and 52)-week periods. It ranges from 0 to 100, highlighting when sentiment is at bullish or bearish extremes.
COT RSI (N)= ((NC - C)−min)/(max-min) x100
🟡 COT Index
The COT Index tracks where the current non-commercial net position lies within its 1-year and 3-year historical range. It reflects institutional accumulation or distribution phases.
Strength represents the magnitude of that positioning bias, visualized through normalized RSI-style metrics.
COT Index (N)= (NC net)/(max-min) x100
🔁 Flip Detection
Flip refers to the crossovers between long% and short%, indicating a change in directional bias among trader groups. When long positions exceed shorts (or vice versa), it signals a possible market flip in sentiment or trend.
For example, Pair B commercial flip is calculated as:
Long% = (Long/Open Interest)×100
Short% = (Short/Open Interest)×100
Flip = Long%−Short%
A bullish flip occurs when long% overtakes short%, and vice versa for a bearish flip. These flips often precede price trend changes or confirm sentiment breakouts.
Flip captures how far current positioning deviates from historical norms — highlighting periods of institutional overconfidence or exhaustion, often leading to significant market turns.
This combination offers a multi-layered edge for identifying when smart money is flipping direction, and whether that flip has strong conviction or is likely to fade.
..........................................................................................................................................................

CYCLE BY RiotWolftradingDescription of the "CYCLE" Indicator
The "CYCLE" indicator is a custom Pine Script v5 script for TradingView that visualizes cyclic patterns in price action, dividing the trading day into specific sessions and 90-minute quarters (Q1-Q4). It is designed to identify and display market phases (Accumulation, Manipulation, Distribution, and Continuation/Reversal) along with key support and resistance levels within those sessions. Additionally, it allows customization of boxes, lines, labels, and colors to suit user preferences.
Main Features
Cycle Phases:
Accumulation (1900-0100): Represents the phase where large operators accumulate positions.
Manipulation (0100-0700): Identifies potential manipulative moves to mislead retail traders.
Distribution (0700-1300): The phase where large operators distribute their positions.
Continuation/Reversal (1300-1900): Indicates whether the price continues the trend or reverses.
90-Minute Quarters (Q1-Q4):
Divides each 6-hour cycle (360 minutes) into four 90-minute quarters (Q1: 00:00-01:30, Q2: 01:30-03:00, Q3: 03:00-04:30, Q4: 04:30-06:00 UTC).
Each quarter is displayed with a colored box (Q1: light purple, Q2: light blue, Q3: light gray, Q4: light pink) and labels (defaulted to black).
Support and Resistance Visualization:
Draws boxes or lines (based on settings) showing the high and low levels of each session.
Optionally displays accumulated volume at the highs and lows within the boxes.
Daily Lines and Last 3 Boxes:
How to Use the Indicator
Step 1: Add the Indicator to TradingView
Open TradingView and select the chart where you want to apply the indicator (e.g., UMG9OOR on a 5-minute timeframe, as shown in the screenshot).
Go to the Pine Editor (at the bottom of the TradingView interface).
Copy and paste the provided code.
Click Compile and then Add to Chart.
Step 2: Configure the Indicator
Click on the indicator name on the chart ("CYCLE") and select Settings (or double-click the name).
Adjust the options based on your needs:
Cycle Phases: Enable/disable phases (Accumulation, Manipulation, Distribution, Continuation/Reversal) and adjust their time slots if needed.
90-Minute Quarters: Enable/disable quarters (Q1-Q4).
Step 3: Interpret the Indicator
Identify Cycle Phases:
Observe the red boxes indicating the phases (Accumulation, Manipulation, etc.).
The high and low levels within each phase are potential support/resistance zones.
If volume is enabled, pay attention to the accumulated volume at highs and lows, as it may indicate the strength of those levels.
Use the 90-Minute Quarters (Q1-Q4):
The colored boxes (Q1-Q4) divide the day into 90-minute segments.
Each quarter shows the price range (high and low) during that period.
Use these boxes to identify price patterns within each quarter, such as breakouts or consolidations.
The labels (Q1, Q2, etc.) help you track time and anticipate potential moves in the next quarter.
Analyze Support and Resistance:
The high and low levels of each phase/quarter act as support and resistance.
Daily lines (if enabled) show key levels from the previous day, useful for planning entries/exits.
The "last 3 boxes below price" (if enabled) highlight potential support levels the price might target.
Avoid Manipulation:
During the Manipulation phase (0100-0700), be cautious of sharp moves or false breakouts.
Use the high/low levels of this phase to identify potential traps (as explained in your first question about manipulation candles).
Step 4: Trading Strategy
Entries and Exits:
Support/Resistance: Use the high/low levels of phases and quarters to set entry or exit points.
For example, if the price bounces off a Q1 support level, consider a buy.
Breakouts: If the price breaks a high/low of a quarter (e.g., Q2), wait for confirmation to enter in the direction of the breakout.
Volume: If accumulated volume is high near a key level, that level may be more significant.
Risk Management:
Place stop-loss orders below lows (for buys) or above highs (for sells) identified by the indicator.
Avoid trading during the Manipulation phase unless you have a specific strategy to handle false breakouts.
Time Context:
Use the quarters (Q1-Q4) to plan your trades based on time. For example, if Q3 is typically volatile in your market, prepare for larger moves between 03:00-04:30 UTC.
Step 5: Adjustments and Testing
Test on Different Timeframes: The indicator is set for a 5-minute timeframe (as in the screenshot), but you can test it on other timeframes (e.g., 1-minute, 15-minute) by adjusting the time slots if needed.
Adjust Colors and Styles: If the default colors are not visible on your chart, change them for better clarity.
---
📌 1. **Accumulation: Strong Institutional Activity**
- During the **accumulation phase, we see **high volume: 82.773K, which suggests strong buying interest**, likely from institutional players.
- This sets the base for the following upward move in price.
---
📌 2. **Manipulation: False Breakout with Lower Volume**
- Later, there's a manipulation phase where price breaks above previous highs, but the volume (71.814K) is **lower than during accumulation**.
- This implies that buyers are not as aggressive as before—no real demandbehind the breakout.
- It’s likely a bull trap, where smart money is selling into the breakout to exit their positions.
---
### 📌 3. Distribution: Weakness and Lack of Demand
- The market enters a distribution phase, and volume drops even further (only 7.914K).
- Price struggles to go higher, and you start seeing rejections at the top.
- This shows that demand is drying up, and smart money is offloading positions**—not accumulating anymore.
---
### 💡 Why Take the Short Here?
- Volume is not increasing with new highs—showing weak demand**.
- The manipulation volume is weaker than the accumulation volume, confirming the breakout was likely false.
- Structure starts to break down (Q levels falling), which confirms weakness.
- This creates a high-probability short setup:
- **Entry:** after confirmation of distribution and structural breakdown.
- **Stop loss:** above the manipulation high.
- **Target:** down toward previous lows or value zones.
---
### ✅ Conclusion
Since the manipulation volume failed to exceed the accumulation volume, the breakout lacked real strength. Combined with decreasing volume in the distribution phase, this indicates fading demand and supply taking control—which justifies entering a short position.

Institutional Composite Moving Average (ICMA) [Volume Vigilante]Institutional Composite Moving Average (ICMA)
The Next Evolution of Moving Averages — Built for Real Traders.
ICMA blends the strength of four powerful averages (SMA, EMA, WMA, HMA) into a single ultra-responsive, ultra-smooth signal.
It reacts faster than traditional MAs while filtering out noise, giving you clean trend direction with minimal lag.
🔹 Key Features:
• Faster reaction than SMA, EMA, or WMA individually
• Smoother and more stable than raw HMA
• Naturally adapts across trend, momentum, and consolidation conditions
• Zero gimmicks. Zero repainting. Full institutional quality.
🔹 Designed For:
• Scalping
• Swing trading
• Signal engines
• Algorithmic systems
📎 How to Use:
• Overlay it on any chart
• Fine-tune the length per timeframe
• Combine with your entries/exits for maximum edge
Created by Volume Vigilante 🧬 — Delivering Real-World Trading Tools.
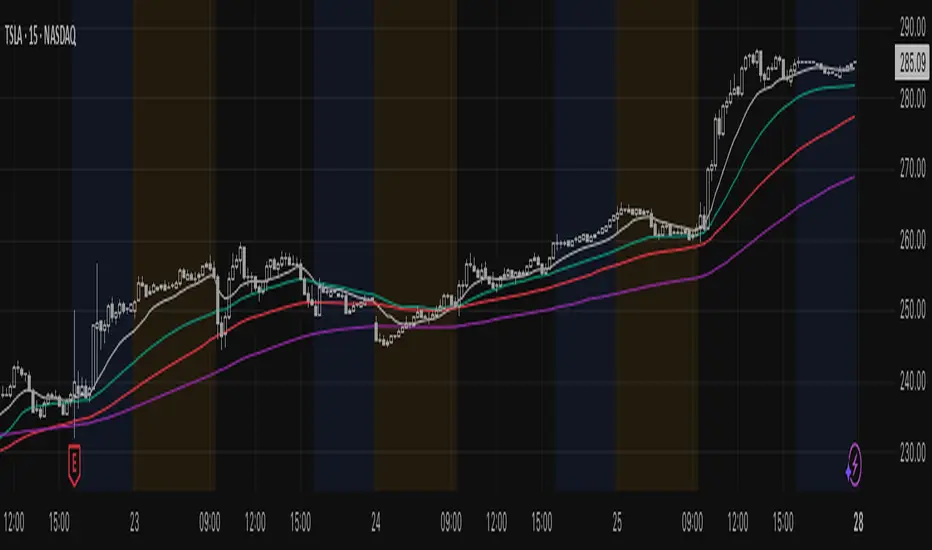
Institutional MACD (Z-Score Edition) [VolumeVigilante]📈 Institutional MACD (Z-Score Edition) — Professional-Grade Momentum Signal
This is not your average MACD .
The Institutional MACD (Z-Score Edition) is a statistically enhanced momentum tool, purpose-built for serious traders and breakout hunters . By applying Z-Score normalization to the classic MACD structure, this indicator uncovers statistically significant momentum shifts , enabling cleaner reads on price extremes, trend continuation, and potential reversals.
💡 Why It Matters
The classic MACD is powerful — but raw momentum values can be noisy and relative , especially on volatile assets like BTC/USD . By transforming the MACD line, signal line, and histogram into Z-scores , we anchor these signals in statistical context . This makes the Institutional MACD:
✔️ Timeframe-agnostic and asset-normalized
✔️ Ideal for spotting true breakouts , not false flags
✔️ A reliable tool for detecting momentum divergence and exhaustion
🧪 Key Features
✅ Full Z-Score normalization (MACD, Signal, Histogram)
✅ Highlighted ±Z threshold bands for overbought/oversold zones
✅ Customizable histogram coloring for visual momentum shifts
✅ Built-in alerts for zero-crosses and Z-threshold breaks
✅ Clean overlay with optional display toggles
🔁 Strategy Tip: Mean Reversion Signals with Statistical Confidence
This indicator isn't just for spotting breakouts — it also shines as a mean reversion tool , thanks to its Z-Score normalization .
When the Z-Score histogram crosses beyond ±2, it marks a statistically significant deviation from the mean — often signaling that momentum is overstretched and the asset may be due for a pullback or reversal .
📌 How to use it:
Z > +2 → Price action is in overbought territory. Watch for exhaustion or short setups.
Z < -2 → Momentum is deeply oversold. Look for reversal confirmation or long opportunities.
These zones often precede snap-back moves , especially in range-bound or corrective markets .
🎯 Combine Z-Score extremes with:
Candlestick confirmation
Support/resistance zones
Volume or price divergence
Other mean reversion tools (e.g., RSI, Bollinger Bands)
Unlike the raw MACD, this version delivers statistical thresholds , not guesswork — helping traders make decisions rooted in probability, not emotion.
📢 Trade Smart. Trade Vigilantly.
Published by VolumeVigilante

Smart Dynamic Levels [ATR-Based]Smart Dynamic Levels
Automated Support & Resistance Levels Based on Market Volatility
Overview:
This advanced indicator automatically plots dynamic support and resistance levels based on the Average True Range (ATR), creating meaningful price zones that adapt to changing market conditions. Unlike static round-number levels, these volatility-adjusted zones provide more relevant technical reference points.
Key Features:
Volatility-Responsive: Levels automatically adjust based on the asset's ATR
Smart Visualization:
Color gradient shows strength of each level (darker = stronger)
Bullish (green) levels below price, bearish (red) levels above
Customizable Settings:
Adjust ATR length (14-period default)
Modify level sensitivity with ATR multiplier (1.5x default)
Choose number of levels to display (5 above/below default)
Toggle labels and line extensions
How It Works:
Calculates the asset's true volatility using ATR
Rounds to significant price intervals based on current volatility
Plots equidistant levels above and below current price
Colors levels based on their position relative to price
Automatically updates as market conditions change
Recommended Use:
Day Trading: Identify intraday support/resistance zones
Swing Trading: Spot potential reversal areas
Breakout Trading: Watch for moves beyond key levels
Works on all markets: Stocks, Forex, Crypto, Futures
Settings Guide:
ATR Length: Higher values for smoother levels (14-20)
Multiplier: Increase for wider levels (1.5-3x)
Levels Count: More levels for higher timeframes (3-10)
Pro Tips:
Combine with trend analysis - levels are more significant when aligned with trend
Watch for price reactions at these levels for confirmation
Use wider levels (higher multiplier) for volatile assets
