TimezoneFormatIANAUTCLibrary "TimezoneFormatIANAUTC"
Provides either the full IANA timezone identifier or the corresponding UTC offset for TradingView’s built-in variables and functions.
tz(_tzname, _format)
Parameters:
_tzname (string) : "London", "New York", "Istanbul", "+1:00", "-03:00" etc.
_format (string) : "IANA" or "UTC"
Returns: "Europe/London", "America/New York", "UTC+1:00"
Example Code
import ARrowofTime/TimezoneFormatIANAUTC/1 as libtz
sesTZInput = input.string(defval = "Singapore", title = "Timezone")
example1 = libtz.tz("London", "IANA") // Return Europe/London
example2 = libtz.tz("London", "UTC") // Return UTC+1:00
example3 = libtz.tz("UTC+5", "IANA") // Return UTC+5:00
example4 = libtz.tz("UTC+4:30", "UTC") // Return UTC+4:30
example5 = libtz.tz(sesTZInput, "IANA") // Return Asia/Singapore
example6 = libtz.tz(sesTZInput, "UTC") // Return UTC+8:00
sesTime1 = time("","1300-1700", example1) // returns the UNIX time of the current bar in session time or na
sesTime2 = time("","1300-1700", example2) // returns the UNIX time of the current bar in session time or na
sesTime3 = time("","1300-1700", example3) // returns the UNIX time of the current bar in session time or na
sesTime4 = time("","1300-1700", example4) // returns the UNIX time of the current bar in session time or na
sesTime5 = time("","1300-1700", example5) // returns the UNIX time of the current bar in session time or na
sesTime6 = time("","1300-1700", example6) // returns the UNIX time of the current bar in session time or na
Parameter Format Guide
This section explains how to properly format the parameters for the tz(_tzname, _format) function.
_tzname (string) must be either;
A valid timezone name exactly as it appears in the chart’s lower-right corner (e.g. New York, London).
A valid UTC offset in ±H:MM or ±HH:MM format. Hours: 0–14 (zero-padded or not, e.g. +1:30, +01:30, -0:00). Minutes: Must be 00, 15, 30, or 45
examples;
"New York" → ✅ Valid chart label
"London" → ✅ Valid chart label
"Berlin" → ✅ Valid chart label
"America/New York" → ❌ Invalid chart label. (Use "New York" instead)
"+1:30" → ✅ Valid offset with single-digit hour
"+01:30" → ✅ Valid offset with zero-padded hour
"-05:00" → ✅ Valid negative offset
"-0:00" → ✅ Valid zero offset
"+1:1" → ❌ Invalid (minute must be 00, 15, 30, or 45)
"+2:50" → ❌ Invalid (minute must be 00, 15, 30, or 45)
"+15:00" → ❌ Invalid (hour must be 14 or below)
_tztype (string) must be either;
"IANA" → returns full IANA timezone identifier (e.g. "Europe/London"). When a time function call uses an IANA time zone identifier for its timezone argument, its calculations adjust automatically for historical and future changes to the specified region’s observed time, such as daylight saving time (DST) and updates to time zone boundaries, instead of using a fixed offset from UTC.
"UTC" → returns UTC offset string (e.g. "UTC+01:00")
Input_time

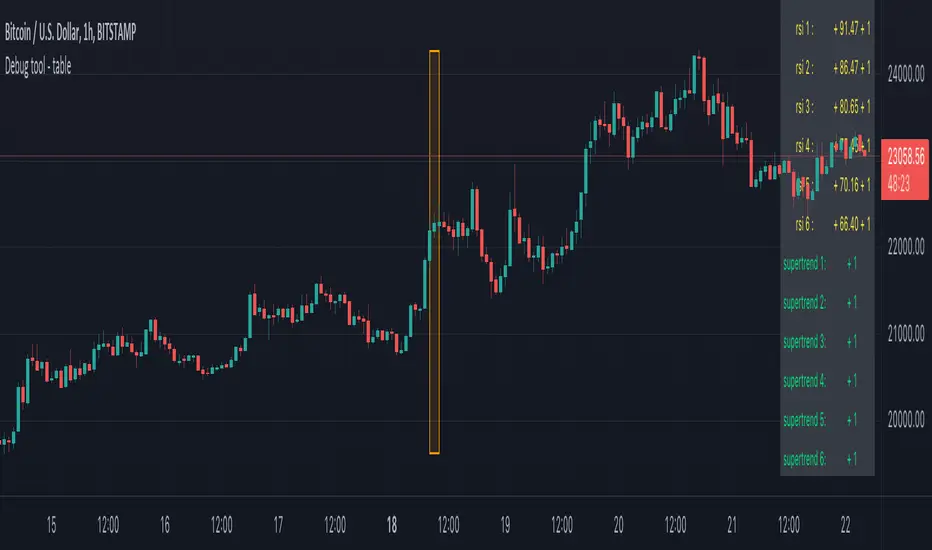
Debug tool - tableWhen having a script with lot's of values, it can be difficult to seek the values you need to debug
For example, here, multiple values aren't visible anymore (right side chart)
————————————————————————————————————————————————————————————————
This script show a way where you can show the values in a table on 1 particular bar, with 2 options:
1)
'middle' -> here the script uses chart.left_visible_bar_time and chart.right_visible_bar_time to calculate the middle
the values of that bar (in orange box) is shown, you can check the value by putting your mouse cursor on that bar:
Just zooming in/out, or scrolling through history will automatically show you the middle and the values of that bar.
Using the arrows on your keyboard will allow you to go 1 bar further/back each time.
(Give it some time to load though, also, sometimes you need to click anywhere on the chart before arrows start working)
2)
'time' -> settings -> Date -> the orange bar will be placed on the chosen bar, the values will be placed in the table as well.
————————————————————————————————————————————————————————————————
If the table interfere with the candles, you can alter the position without changing the placement of the orange bar -> settings -> position table
This script holds lots of values, just to show the difference between values placed on the chart, and values, placed in the table.
To make more clear how the script works, an 'example' (v_rsi1 / rsi1) is highlighted in the code itself
Cheers!