FVG Detector by SZEMEK>>> DESCRIPTION IN ENGLISH
An advanced indicator for the TradingView platform designed to detect and visualize Fair Value Gaps (FVG) and Inversion Fair Value Gaps (iFVG) on charts.
Main Features:
1. FVG Detection:
- The script identifies both bullish and bearish Fair Value Gaps.
- Users can choose which types of FVG to display (Bullish, Bearish, both, or none).
2. FVG Visualization:
- Gaps are represented as rectangular boxes on the chart.
- The color and transparency of the boxes are configurable separately for bullish and bearish FVG.
- The option to add a frame to FVG boxes with separate color settings.
- FVG labels are available with configurable colors and sizes.
3. Dynamic Tracking of FVG Fill:
- The script monitors the extent to which each gap has been filled by subsequent price movements.
- The fill level is visualized using gray overlay on the original FVG box.
- The percentage fill is updated on the label.
4. Automatic Removal of FVG:
- The ability to set a percentage threshold (100%, 75%, 50%, or no removal) after which FVG is removed from the chart.
5. iFVG Detection:
- The script also identifies Inversion Fair Value Gaps (iFVG), which can be displayed as separate boxes.
- iFVG are available in bullish and bearish versions.
- Users can choose which types of iFVG to display (Bullish, Bearish, both, or none).
- iFVG can also have labels and frames.
6. Limitation of Checked Candles:
- Users can specify the maximum number of candles back that the script will analyze for FVG and iFVG.
- Alerts: The indicator allows setting alerts for detected iFVG, both bullish and bearish.
Advanced Features:
- Accurate calculation of FVG fill percentage, considering both wicks and candle bodies.
- Dynamic updating of FVG boxes and their labels in real-time.
- Flexible memory management through the removal of outdated or filled FVG.
- The ability to customize the appearance of iFVG, including colors, labels, and frames.
This script serves as an advanced tool for technical analysis, enabling traders to identify potential support and resistance areas based on the concept of Fair Value Gaps and their inverted versions.
>>> DESCRIPTION IN ENGLISH
Zaawansowany wskaźnik dla platformy TradingView, który służy do wykrywania i wizualizacji luk wartości godziwej (Fair Value Gaps, FVG) oraz odwróconych luk wartości godziwej (Inversion Fair Value Gaps, iFVG) na wykresie.
Główne cechy
1. Wykrywanie FVG:
- Skrypt identyfikuje zarówno bycze (Bullish), jak i niedźwiedzie (Bearish) luki wartości godziwej.
- Użytkownik może wybrać, które typy FVG mają być wyświetlane (Bullish, Bearish, oba lub żadne).
2. Wizualizacja FVG:
- Luki są przedstawiane jako prostokątne boxy na wykresie.
- Kolor i przezroczystość boxów są konfigurowalne osobno dla FVG byczych i niedźwiedzich.
- Możliwość dodania ramki do boxów FVG z osobnymi ustawieniami kolorów.
- Etykiety FVG są dostępne z konfigurowalnymi kolorami i rozmiarami.
3. Dynamiczne śledzenie wypełnienia FVG:
- Skrypt monitoruje, w jakim stopniu każda luka została wypełniona przez późniejsze ruchy ceny.
- Stopień wypełnienia jest wizualizowany za pomocą szarego koloru nakładanego na oryginalny box FVG.
- Procent wypełnienia jest aktualizowany na etykiecie.
4. Automatyczne usuwanie FVG:
- Możliwość ustawienia progu procentowego (100%, 75%, 50% lub brak usuwania), po którego przekroczeniu FVG jest usuwany z wykresu.
5. Wykrywanie iFVG:
- Skrypt dodatkowo identyfikuje odwrócone luki wartości godziwej (iFVG), które mogą być wyświetlane jako osobne boxy.
- iFVG są dostępne w wersji byczej i niedźwiedziej.
- Użytkownik może wybrać, które typy iFVG mają być wyświetlane (Bullish, Bearish, oba lub żadne).
- iFVG również mogą mieć etykiety i ramki.
6. Ograniczenie sprawdzanych świec:
- Użytkownik może określić maksymalną liczbę świec wstecz, które skrypt będzie analizował w poszukiwaniu FVG i iFVG.
- Alerty: Wskaźnik umożliwia ustawienie alertów dla wykrytych luk iFVG, zarówno bullish, jak i bearish.
Zaawansowane funkcje
- Dokładne obliczanie procentu wypełnienia FVG, uwzględniające zarówno knoty, jak i ciała świec.
- Dynamiczne aktualizowanie boxów FVG i ich etykiet w czasie rzeczywistym.
- Elastyczne zarządzanie pamięcią poprzez usuwanie nieaktualnych lub wypełnionych FVG.
- Możliwość dostosowania wyglądu iFVG, w tym kolorów, etykiet i ramki.
Skrypt ten stanowi zaawansowane narzędzie do analizy technicznej, umożliwiające traderom identyfikację potencjalnych obszarów wsparcia i oporu bazujących na koncepcji luk wartości godziwej i ich odwróconych wersjach.
Ifvg

FVG Reversal Sentinel🔵 FVG Reversal Sentinel – Multi-Timeframe Fair Value Gap Indicator
The FVG Reversal Sentinel is a powerful TradingView indicator designed to help traders identify and track Fair Value Gaps (FVGs) across multiple timeframes, all within a single chart.
This tool allows you to select up to five separate timeframes, ensuring you never miss key market shifts, whether you are scalping, day trading, or swing trading. You can use this indicator in any asset (Cryptos, Futures, Indices, Forex Pairs, etc.).
🔵 - Key Features -
Multi-Timeframe FVG Tracking – Select and display up to five different timeframes on one chart, providing a comprehensive view of market structure.
Customizable Colors – Adjust bullish and bearish FVG colors to match your chart theme for a seamless trading experience.
Enhanced Market Context – Quickly identify key liquidity zones and refine your entries and exits with precision.
Hide the lower timeframes FVGs to get a clear view in a custom timeframe.
Show or hide mitigated FVGs to declutter the chart.
FVGs boxes are going to be displayed only when the candle bar closes
FVGs are going to be mitigated only when the body of the candle closes above or below the FVG area.
No repainting
Whether you're looking to fine-tune your entries or gain a broader market perspective, the FVG Reversal Sentinel indicator ensures you have the tools to stay ahead of price action and capitalize on market inefficiencies.
🔵 - Customization-
You can change the indicator settings as you see fit to achieve the best results for your use case.
TIMEFRAMES
This indicator provides the ability to select up to 5 timeframes. These timeframes are based on the trader's timeframes including any custom timeframes.
Select the desired timeframe from the options list.
Add the label text you would like to show for the selected timeframe.
Check or uncheck the box to display or hide the timeframe from your chart.
FVG SETTINGS
Length of boxes: allows you to select the length of the box that is going to be displayed for the FVGs.
Delete boxes after fill?: allows you to show or hide mitigated FVGs on your chart.
Hide FVGs lower than enabled timeframes?: allows you to show or hide lower timeframe FVGs on your chart. Example - You are in a 15 minutes timeframe chart, if you choose to hide lower timeframe FVGs you will not be able to see 5 minutes FVG defined in your Timeframes Settings, only 15 minutes or higher timeframe FVGs will be displayed on your chart.
BOX VISUALS
Bullish FVG box color: the color and opacity of the box for the bullish FVGs.
Bearish FVG box color: the color and opacity of the box for the bearish FVGs.
LABELS VISUALS
Bullish FVG labels color: the color for bullish labels.
Bearish FVG labels color: the color for bearish labels.
Labels size: the size of the text displayed in the labels.
Labels position: the position of the label inside the FVGs boxes (right, left or center).
BORDER VISUALS
Border width: the width of the border (the thickness).
Bullish FVG border color: the color and the opacity of the bullish box border.
Bearish FVG border color: the color and the opacity of the bearish box border.
🔵 - How to use the indicator -
Just add the indicator in your chart and click in the settings option to customize it.
Make sure you select the desired timeframes and set the colors and opacity for the FVGs boxes.
This indicator can be used in many trading strategies, such as:
SILVER BULLET
iFVG
iFVG RETEST
These strategies are based on the use of FVGs, this tool can help you analyze the market and make the right decision.
🔵 - How was the indicator designed? -
I have spent a lot of time testing other open source indicators from the community. All of these indicators do a great job, but they have a problem, they not only mitigate FVGs when a candle closes above or below the FVG, they also mitigate FVGs when the candle closes exactly to the tick (not above or below the FVG). This is a problem for many strategies that rely on FVGs mitigation.
What makes this indicator different is that it focuses on just mitigating imbalances at the right time for these strategies.
I have taken ideas and some pieces of code from many community indicator developers, such as:
@twingall
@tflab
@marktools
@nacho-fx
@pmk07
... and many other people, to whom I thank for their valuable work and have allowed me to create this tool by making modifications to their source code.
🔵 - Disclaimer -
This tool is intended solely for informational and educational purposes and should not be regarded as financial, investment, or trading advice. It's not designed to predict market movements or offer specific recommendations. Users should be aware that past performance is not indicative of future results and should not rely on any indicator for financial decisions.

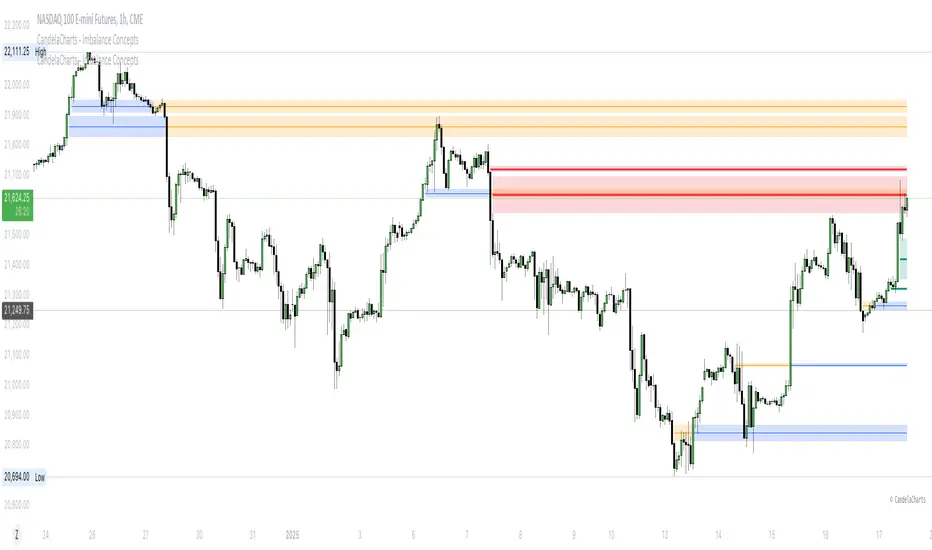
CandelaCharts - Imbalance Concepts 📝 Overview
Imbalance Concepts is an advanced toolkit rooted in ICT (Inner Circle Trader) principles, specifically designed to identify and highlight critical areas of support and resistance within financial markets. This toolkit focuses on detecting market imbalances that can indicate potential turning points or high-probability zones for price action.
The key components of the toolkit include:
Fair Value Gaps (FVG)
Inversion Fair Value Gaps (IFVG)
Balanced Price Range (BPR)
Volume Imbalances (VI)
Opening Gaps (OG)
The toolkit automatically detects these imbalances and visually marks them on charts, allowing traders to quickly identify key zones for analysis. This enables more informed decision-making, as these imbalances often signal the potential for major market shifts, reversals, or continuation patterns.
By integrating Imbalance Concepts, traders can focus on critical price areas that have a high likelihood of influencing future price action.
📦 Features
The Imbalance Concepts toolkit provides a robust set of features aimed at improving trading accuracy and decision-making. Key features include:
MTF
Mitigation
Consequent Encroachment
Threshold
Hide Overlap
Advanced Styling
⚙️ Settings
Show: Controls whether Imbalances are displayed on the chart.
Show Last: Sets the number of Imbalances you want to display.
Length: Determines the length of each Imbalance.
Mitigation: Highlights when an Imbalance has been touched, using a different color without marking it as invalid.
Timeframe: Specifies the timeframe used to detect Imbalances.
Threshold: Sets the minimum gap size required for Imbalance detection on the chart.
Show Mid-Line: Configures the midpoint line's width and style within the Imbalance. (Consequent Encroachment - CE)
Show Border: Defines the border width and line style of the Imbalance.
Hide Overlap: Removes overlapping Imbalances from view.
Extend: Extends the Imbalance length to the current candle.
Elongate: Fully extend the Imbalance length to the right side of the chart.
⚡️ Showcase
Fair Value Gaps (FVG)
Inversion Fair Value Gaps (IFVG)
Balanced Price Range (BPR)
Volume Imbalances (VI)
Opening Gaps (OG)
📒 Usage
The key components of trading imbalances include:
Step 1 – Identify Market Trend: Begin by determining the market trend for the asset, whether it is bullish or bearish.
Step 2 – Locate Premium and Discount Zones: In a bearish market, focus on identifying the premium Imbalance, while in a bullish market, look for the discount Imbalance.
Step 3 – Detect Liquidity Sweep: After identifying the trend, the next step is to spot a liquidity sweep, which often indicates a potential price reversal or continuation.
Step 4 – Detect Change In State of Delivery: Following the liquidity sweep, the next step is to recognize a CISD, which frequently serves as a confirmation of a potential price reversal.
Step 5 – Execute the Trade: In a bullish market, wait for the price to retrace and test the discount imbalance, aiming to balance the price movement before entering the trade.
NOTES:
You always short only on Premium, and long on Discount.
Fair Value Gaps (FVG)
Inversion Fair Value Gaps
Balanced Price Range
🚨 Alerts
The indicator provides the ability to set alerts for various significant market events related to its core features.
You can configure alerts for the following key events:
Fair Value Gaps Formation (+B/-B)
Inversion Fair Value Gaps Formation (+B/-B)
Balanced Price Range Formation (+B/-B)
Volume Imbalances Formation (+B/-B)
Opening Gaps Formation (+B/-B)
⚠️ Disclaimer
These tools are exclusively available on the TradingView platform.
Our charting tools are intended solely for informational and educational purposes and should not be regarded as financial, investment, or trading advice. They are not designed to predict market movements or offer specific recommendations. Users should be aware that past performance is not indicative of future results and should not rely on these tools for financial decisions. By using these charting tools, the purchaser agrees that the seller and creator hold no responsibility for any decisions made based on information provided by the tools. The purchaser assumes full responsibility and liability for any actions taken and their consequences, including potential financial losses or investment outcomes that may result from the use of these products.
By purchasing, the customer acknowledges and accepts that neither the seller nor the creator is liable for any undesired outcomes stemming from the development, sale, or use of these products. Additionally, the purchaser agrees to indemnify the seller from any liability. If invited through the Friends and Family Program, the purchaser understands that any provided discount code applies only to the initial purchase of Candela's subscription. The purchaser is responsible for canceling or requesting cancellation of their subscription if they choose not to continue at the full retail price. In the event the purchaser no longer wishes to use the products, they must unsubscribe from the membership service, if applicable.
We do not offer reimbursements, refunds, or chargebacks. Once these Terms are accepted at the time of purchase, no reimbursements, refunds, or chargebacks will be issued under any circumstances.
By continuing to use these charting tools, the user confirms their understanding and acceptance of these Terms as outlined in this disclaimer.
CandelaCharts - Inversion Fair Value Gap (IFVG) 📝 Overview
An ICT Inversion Fair Value Gap, often called an Inverse FVG, occurs when a Fair Value Gap (FVG) fails to maintain price support or resistance, resulting in a price breach beyond the FVG. This phenomenon highlights an initial shift in price momentum, signaling potential reversals or retracements.
A Bullish IFVG forms when the price breaks above a bearish fair value gap, signaling a potential shift to bullish momentum.
A Bearish IFVG forms when the price breaks below a bullish fair value gap, signaling a potential shift to bearish momentum.
The IFVG Indicator is a powerful tool designed to automatically detect Inversion Fair Value Gaps (IFVGs) on your charts. It highlights key zones where price breaches fair value gaps, signaling potential momentum shifts or trend reversals. Whether you're tracking bullish or bearish IFVGs, this indicator provides clear visual cues, helping you make informed trading decisions with precision and confidence. Perfect for traders seeking to anticipate market structure changes effortlessly.
📦 Features
MTF
Mitigation
Consequent Encroachment
Threshold
Hide Overlap
Advanced Styling
⚙️ Settings
Show: Controls whether FVGs are displayed on the chart.
Show Last: Sets the number of FVGs you want to display.
Length: Determines the length of each IFVG.
Mitigation: Highlights when an IFVG has been touched, using a different color without marking it as invalid.
Timeframe: Specifies the timeframe used to detect IFVGs.
Threshold: Sets the minimum gap size required for IFVG detection on the chart.
Show Mid-Line: Configures the midpoint line's width and style within the IFVG. (Consequent Encroachment - CE)
Show Border: Defines the border width and line style of the IFVG.
Hide Overlap: Removes overlapping IFVGs from view.
Extend: Extends the IFVG length to the current candle.
Elongate: Fully extends the IFVG length to the right side of the chart.
⚡️ Showcase
Simple
Mitigated
Bordered
Consequent Encroachment
Extended
🚨 Alerts
This script provides alert options for all signals.
Bearish Signal
A bearish signal is invalidated if the price re-enters a bearish inversion zone but fails to reverse downward.
Bullish Signal
A bullish signal is invalidated if the price re-enters a bullish inversion zone but fails to reverse upward.
⚠️ Disclaimer
Trading involves significant risk, and many participants may incur losses. The content on this site is not intended as financial advice and should not be interpreted as such. Decisions to buy, sell, hold, or trade securities, commodities, or other financial instruments carry inherent risks and are best made with guidance from qualified financial professionals. Past performance is not indicative of future results.

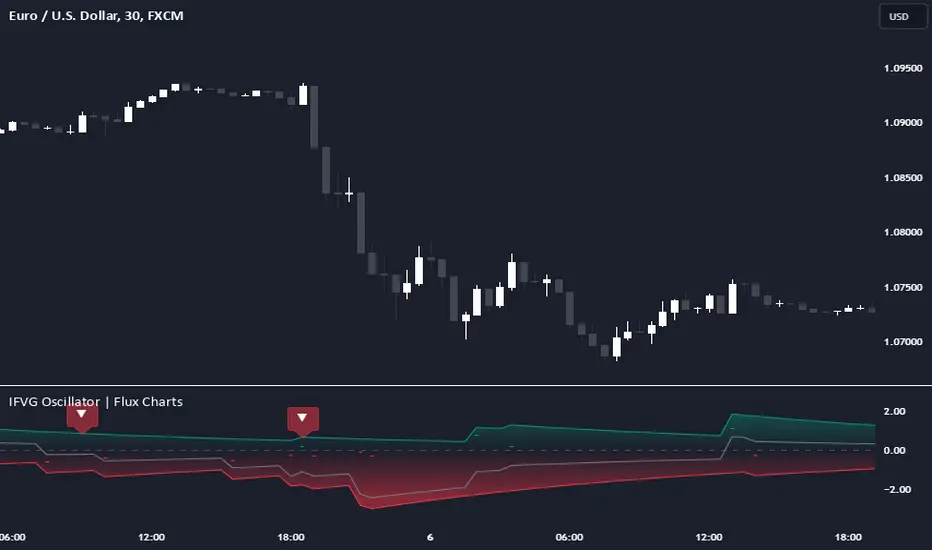
Inversion Fair Value Gap Oscillator | Flux Charts💎 GENERAL OVERVIEW
Introducing the new Inversion Fair Value Gap Oscillator (IFVG Oscillator) indicator! This unique indicator identifies and tracks Inversion Fair Value Gaps (IFVGs) in price action, presenting them in an oscillator format to reveal market momentum based on IFVG strength. It highlights bullish and bearish IFVGs while enabling traders to adjust detection sensitivity and apply volume and ATR-based filters for more precise setups. For more information about the process, check the "📌 HOW DOES IT WORK" section.
Features of the new IFVG Oscillator:
Fully Customizable FVG & IFVG Detection
An Oscillator Approach To IFVGs
Divergence Markers For Potential Reversals
Alerts For Divergence Labels
Customizable Styling
📌 HOW DOES IT WORK?
Fair Value Gaps are price gaps within bars that indicate inefficiencies, often filled as the market retraces. An Inversion Fair Value Gap is created in the opposite direction once a FVG gets invalidated. The IFVG Oscillator scans historical bars to identify these gaps, then filters them based on ATR or volume. Each IFVG is marked as bullish or bearish according to the opposite direction of the original FVG that got invalidated.
An oscillator is calculated using recent IFVGs with this formula :
1. The Oscillator starts as 0.
2. When a new IFVG Appears, it contributes (IFVG Width / ATR) to the oscillator of the corresponding type.
3. Each confirmed bar, the oscillator is recalculated as OSC = OSC * (1 - Decay Coefficient)
The oscillator aggregates and decays past IFVGs, allowing recent IFVG activity to dominate the signal. This approach emphasizes current market momentum, with oscillations moving bullish or bearish based on IFVG intensity. Divergences are marked where IFVG oscillations suggest potential reversals. Bullish Divergence conditions are as follows :
1. The current candlestick low must be the lowest of last 25 bars.
2. Net Oscillator (Shown in gray line by default) must be > 0.
3. The current Bullish IFVG Oscillator value should be no more than 0.1 below the highest value from the last 25 bars.
Traders can use divergence signals to get an idea of potential reversals, and use the Net IFVG Oscillator as a trend following marker.
🚩 UNIQUENESS
The Inversion Fair Value Gap Oscillator stands out by converting IFVG activity into an oscillator format, providing a momentum-based visualization of IFVGs that reveals market sentiment dynamically. Unlike traditional indicators that statically mark IFVG zones, the oscillator decays older IFVGs over time, showing only the most recent, relevant activity. This approach allows for real-time insight into market conditions and potential reversals based on oscillating IFVG strength, making it both intuitive and powerful for momentum trading.
Another unique feature is the combination of customizable ATR and volume filters, letting traders adapt the indicator to match their strategy and market type. You can also set-up alerts for bullish & bearish divergences.
⚙️ SETTINGS
1. General Configuration
Decay Coefficient -> The decay coefficient for oscillators. Increasing this setting will result in oscillators giving the weight to recent IFVGs, while decreasing it will distribute the weight equally to the past and recent IFVGs.
2. Fair Value Gaps
Zone Invalidation -> Select between Wick & Close price for FVG Zone Invalidation.
Zone Filtering -> With "Average Range" selected, algorithm will find FVG zones in comparison with average range of last bars in the chart. With the "Volume Threshold" option, you may select a Volume Threshold % to spot FVGs with a larger total volume than average.
FVG Detection -> With the "Same Type" option, all 3 bars that formed the FVG should be the same type. (Bullish / Bearish). If the "All" option is selected, bar types may vary between Bullish / Bearish.
Detection Sensitivity -> You may select between Low, Normal or High FVG detection sensitivity. This will essentially determine the size of the spotted FVGs, with lower sensitivies resulting in spotting bigger FVGs, and higher sensitivies resulting in spotting all sizes of FVGs.
3. Inversion Fair Value Gaps
Zone Invalidation -> Select between Wick & Close price for IFVG Zone Invalidation.
4. Style
Divergence Labels On -> You can switch divergence labels to show up on the chart or the oscillator plot.
Fair Value Gaps Advanced [smart-money-indicators]This indicator is a tool to support the "SMC" strategy.
This indicator does not provide entry or exit signals.
This indicator is a tool to mark key price areas.
This indicator is a tool to mark key time areas.
This indicator is particularly distinguished by its high customizability of tools,
setting it apart from the indicators currently available on the TradingView platform.
This Fair Value Gaps or Imbalance Indicator marks liquidity areas using boxes.
Fair Value Gaps are created in high-momentum conditions, leaving an area that, in theory and as supported by backtesting, tends to be revisited.
The following settings can be configured:
Show only one-sided Gaps
- Only Fair Value Gaps formed by three consecutive bullish or bearish candles are displayed.
Extend Fair Value Gap
-The box is extended to the current candle.
Draw Mid Line
- A 50% line of the Fair Value Gap is drawn.
Extend Mid Line
-The midline is extended to the current candle.
Remove filled Fair Value Gap
-Filled Fair Value Gaps are removed.
Enable inverse Fair Value Gap
- When a bullish Fair Value Gap is broken, it creates a bearish resistance area.
- When a bearish Fair Value Gap is broken, it creates a bullish support area.
-Display Last X active Buyside Fair Value Gaps
-Display Last X active Sellside Fair Value Gaps
-Display Last X active Buyside Inverse Fair Value Gaps
-Display Last X active Sellside Inverse Fair Value Gaps

HTF Inversion Fair Value Gap | Flux Charts💎 GENERAL OVERVIEW
Introducing our new Higher Timeframe Inversion Fair Value Gaps (IFVG) indicator! Inversion Fair Value Gaps occur when a Fair Value Gap becomes invalidated. They reverse the role of the original Fair Value Gap, making a bullish zone bearish and vice versa. This indicator finds the latest IFVG in a higher timeframe and renders it in the current chart with it's divergence. For more information about the process, read the "HOW DOES IT WORK" section of the description.
Features of the new Higher Timeframe IFVG Indicator :
Renders The Higher Timeframe IFVG
Invalidation Borders
Variety Of Zone Detection / Sensitivity / Filtering / Invalidation Settings
High Customizability
🚩 UNIQUENESS
This indicator lets you take a look at the bigger picture by rendering the latest IFVG in a higher timeframe. You can see the current IFVG divergence to see how is the price action acting around the IFVG. You also can customize the FVG Filtering method, FVG & IFVG Zone Invalidation, Detection Sensitivity etc. according to your needs to get the best performance from the indicator.
📌 HOW DOES IT WORK ?
A Fair Value Gap generally occur when there is an imbalance in the market. They can be detected by specific formations within the chart. An Inversion Fair Value Gap is when a FVG becomes invalidated, thus reversing the direction of the FVG.
This indicator then renders the IFVG in a higher timeframe in your chart like this :
The opaque dashed lines at the top and the bottom of the IFVG indicate the bars that formed the original FVG. The middle dashed line that is semi-transparent shows the candlestick that invalidated the original FVG, thus created the current IFVG. The vertical solid top & bottom wicks indicate the current divergence of the highest & lowest points to the current IFVG.
The IFVGs can act as strong support & resistance points, depending on their creation volume and invalidation volume. Traders can use them for confirmation signals to their positions.
⚙️ SETTINGS
1. General Configuration
Higher Timeframe -> The higher timeframe to detect latest IFVG from. Keep in mind that his setting must be higher than the current timeframe.
IFVG Zone Invalidation -> Select between Wick & Close price for IFVG Zone Invalidation.
2. Fair Value Gaps
FVG Zone Invalidation -> Select between Wick & Close price for FVG Zone Invalidation.
Zone Filtering -> With "Average Range" selected, algorithm will find FVG zones in comparison with average range of last bars in the chart. With the "Volume Threshold" option, you may select a Volume Threshold % to spot FVGs with a larger total volume than average.
FVG Detection -> With the "Same Type" option, all 3 bars that formed the FVG should be the same type. (Bullish / Bearish). If the "All" option is selected, bar types may vary between Bullish / Bearish.
Detection Sensitivity -> You may select between Low, Normal or High FVG detection sensitivity. This will essentially determine the size of the spotted FVGs, with lower sensitivities resulting in spotting bigger FVGs, and higher sensitivities resulting in spotting all sizes of FVGs.
3. Dasboard
You can enable / disable the mitigation dashboard and customize it here.
4. Customization
Offset -> The number of candlesticks the IFVG will be rendered to the right of the latest bar.
Width -> The width of the rendered IFVG in candlesticks.

ICT Balanced Price Range [TradingFinder] BPR | FVG + IFVG🔵 Introduction
The ICT Balanced Price Range (BPR) indicator is a valuable tool that helps traders identify key areas on price charts where a balance between buyers and sellers is established. These zones can serve as critical points for potential price reversals or continuations.
🟣 Bullish Balanced Price Range
A Bullish BPR forms when a buying pressure zone (Bullish FVG) overlaps with a Bullish Inversion FVG. This overlap indicates a high probability of price moving upwards, making it a crucial area for traders to consider.
🟣 Bearish Balanced Price Range
Similarly, a Bearish BPR is created when a selling pressure zone (Bearish FVG) overlaps with a Bearish Inversion FVG. This zone is often seen as a key area where the price is likely to move downward.
🔵 How to Use
🟣 Identifying the Balanced Price Range (BPR)
To identify the Balanced Price Range (BPR), you must first locate two Fair Value Gaps (FVGs) on the price chart. One FVG should be on the sell side, and the other on the buy side. When these two FVGs horizontally oppose each other, the area where they overlap is recognized as the Balanced Price Range (BPR).
This BPR zone is highly sensitive to price movements due to the combination of two FVGs, often leading to strong market reactions. As the price approaches this area, the likelihood of a significant market move increases, making it a prime target for professional traders.
🟣 Bullish Balanced Price Range (Bullish BPR)
To effectively trade using a Bullish BPR, begin by identifying a bullish market structure and searching for bullish Price Delivery Arrays (PD Arrays). Once the market structure shifts to bullish in a lower time frame, locate a Bullish FVG within the Discount Zone that overlaps with a Bearish FVG.
Mark this overlapping zone and wait for the price to test it before executing a buy trade. Alternatively, you can set a Buy Limit order with a stop loss below the recent swing low and target profits based on higher time frame liquidity draws.
🟣 Bearish Balanced Price Range (Bearish BPR)
For bearish trades, start by identifying a bearish market structure and look for bearish PD Arrays. After the market structure shifts to bearish in a lower time frame, identify a Bearish FVG within the Discount Zone that overlaps with a Bullish FVG. Mark this overlapping zone and execute a sell trade when the price tests it.
You can also use a Sell Limit order with a stop loss above the recent swing high and target profits according to higher time frame liquidity draws.
🔵 Settings
🟣 Global Settings
Show All Inversion FVG & IFVG : If disabled, only the most recent FVG & IFVG will be displayed.
FVG & IFVG Validity Period (Bar) : Determines the maximum duration (in number of candles) that the FVG and IFVG remain valid.
Switching Colors Theme Mode : Includes three modes: "Off", "Light", and "Dark". "Light" mode adjusts colors for light mode use, "Dark" mode adjusts colors for dark mode use, and "Off" disables color adjustments.
🟣 Display Settings
Show Bullish BPR : Toggles the display of demand-related boxes.
Show Bearish BPR : Toggles the display of supply-related boxes.
Mitigation Level BPR : Options include "Proximal", "Distal", or "50 % OB" modes, which you can choose based on your needs. The "50 % OB" line is the midpoint between distal and proximal.
Show Bullish IFVG : Toggles the display of demand-related boxes.
Show Bearish IFV G: Toggles the display of supply-related boxes.
Mitigation Level FVG and IFVG : Options include "Proximal", "Distal", or "50 % OB" modes, which you can choose based on your needs. The "50 % OB" line is the midpoint between distal and proximal.
🟣 Logic Settings
FVG Filter : This refines the number of identified FVG areas based on a specified algorithm to focus on higher quality signals and reduce noise.
Types of FVG filters :
Very Aggressive Filter : Adds a condition where, for an upward FVG, the last candle's highest price must exceed the middle candle's highest price, and for a downward FVG, the last candle's lowest price must be lower than the middle candle's lowest price. This minimally filters out FVGs.
Aggressive Filter : Builds on the Very Aggressive mode by ensuring the middle candle is not too small, filtering out more FVGs.
Defensive Filter : Adds criteria regarding the size and structure of the middle candle, requiring it to have a substantial body and specific polarity conditions, filtering out a significant number of FVGs.
Very Defensive Filte r: Further refines filtering by ensuring the first and third candles are not small-bodied doji candles, retaining only the highest quality signals.
🟣 Alert Settings
Alert Inversion FVG Mitigation : Enables alerts for Inversion FVG mitigation.
Message Frequency : Determines the frequency of alerts. Options include 'All' (every function call), 'Once Per Bar' (first call within the bar), and 'Once Per Bar Close' (final script execution of the real-time bar). Default is 'Once per Bar'.
Show Alert Time by Time Zone : Configures the time zone for alert messages. Default is 'UTC'.
Display More Info : Provides additional details in alert messages, including price range, date, hour, and minute. Set to 'Off' to exclude this information.
🔵 Conclusion
The ICT Balanced Price Range is a powerful and reliable tool for identifying key points on price charts. This strategy can be applied across various time frames and serves as a complementary tool alongside other indicators and technical analysis methods.
The most crucial aspect of utilizing this strategy effectively is correctly identifying FVGs and their overlapping areas, which comes with practice and experience.

Order Block Overlapping Drawing [TradingFinder]🔵 Introduction
Technical analysis is a fundamental tool in financial markets, helping traders identify key areas on price charts to make informed trading decisions. The ICT (Inner Circle Trader) style, developed by Michael Huddleston, is one of the most advanced methods in this field.
It enables traders to precisely identify and exploit critical zones such as Order Blocks, Breaker Blocks, Fair Value Gaps (FVGs), and Inversion Fair Value Gaps (IFVGs).
To streamline and simplify the use of these key areas, a library has been developed in Pine Script, the scripting language for the TradingView platform. This library allows you to automatically detect overlapping zones between Order Blocks and other similar areas, and visually display them on your chart.
This tool is particularly useful for creating indicators like Balanced Price Range (BPR) and ICT Unicorn Model.
🔵 How to Use
This section explains how to use the Pine Script library. This library assists you in easily identifying and analyzing overlapping areas between Order Blocks and other zones, such as Breaker Blocks and Fair Value Gaps.
To add "Order Block Overlapping Drawing", you must first add the following code to your script.
import TFlab/OrderBlockOverlappingDrawing/1
🟣 Inputs
The library includes the "OBOverlappingDrawing" function, which you can use to detect and display overlapping zones. This function identifies and draws overlapping zones based on the Order Block type, trigger conditions, previous and current prices, and other relevant parameters.
🟣 Parameters
OBOverlappingDrawing(OBType , TriggerConditionOrigin, distalPrice_Pre, proximalPrice_Pre , distalPrice_Curr, proximalPrice_Curr, Index_Curr , OBValidGlobal, OBValidDis, MitigationLvL, ShowAll, Show, ColorZone) =>
OBType (string)
TriggerConditionOrigin (bool)
distalPrice_Pre (float)
proximalPrice_Pre (float)
distalPrice_Curr (float)
proximalPrice_Curr (float)
Index_Curr (int)
OBValidGlobal (bool)
OBValidDis (int)
MitigationLvL (string)
ShowAll (bool)
Show (bool)
ColorZone (color)
In this example, various parameters are defined to detect overlapping zones and draw them on the chart. Based on these settings, the overlapping areas will be automatically drawn on the chart.
OBType : All order blocks are summarized into two types: "Supply" and "Demand." You should input your Current order block type in this parameter. Enter "Demand" for drawing demand zones and "Supply" for drawing supply zones.
TriggerConditionOrigin : Input the condition under which you want the Current order block to be drawn in this parameter.
distalPrice_Pre : Generally, if each zone is formed by two lines, the farthest line from the price is termed Pervious "Distal." This input receives the price of the "Distal" line.
proximalPrice_Pre : Generally, if each zone is formed by two lines, the nearest line to the price is termed Previous "Proximal" line.
distalPrice_Curr : Generally, if each zone is formed by two lines, the farthest line from the price is termed Current "Distal." This input receives the price of the "Distal" line.
proximalPrice_Curr : Generally, if each zone is formed by two lines, the nearest line to the price is termed Current "Proximal" line.
Index_Curr : This input receives the value of the "bar_index" at the beginning of the order block. You should store the "bar_index" value at the occurrence of the condition for the Current order block to be drawn and input it here.
OBValidGlobal : This parameter is a boolean in which you can enter the condition that you want to execute to stop drawing the block order. If you do not have a special condition, you should set it to True.
OBValidDis : Order blocks continue to be drawn until a new order block is drawn or the order block is "Mitigate." You can specify how many candles after their initiation order blocks should continue. If you want no limitation, enter the number 4998.
MitigationLvL : This parameter is a string. Its inputs are one of "Proximal", "Distal" or "50 % OB" modes, which you can enter according to your needs. The "50 % OB" line is the middle line between distal and proximal.
ShowAll : This is a boolean parameter, if it is "true" the entire order of blocks will be displayed, and if it is "false" only the last block order will be displayed.
Show : You may need to manage whether to display or hide order blocks. When this input is "On", order blocks are displayed, and when it's "Off", order blocks are not displayed.
ColorZone : You can input your preferred color for drawing order blocks.
🟣 Output
Mitigation Alerts : This library allows you to leverage Mitigation Alerts to detect specific conditions that could lead to trend reversals. These alerts help you react promptly in your trades, ensuring better management of market shifts.
🔵 Conclusion
The Pine Script library provided is a powerful tool for technical analysis, especially in the ICT style. It enables you to detect overlapping zones between Order Blocks and other significant areas like Breaker Blocks and Fair Value Gaps, improving your trading strategies. By utilizing this tool, you can perform more precise analysis and manage risks effectively in your trades.

Inversion Fair Value Gaps [TradingFinder] IFVG ICT Signal| Alert🔵 Introduction
🟣 Inversion Fair Value Gap (IFVG)
An ICT Inversion Fair Value Gap, or reverse FVG, occurs when a fair value gap fails to hold its price, resulting in the price moving beyond and breaking the gap. This situation marks the initial change in price momentum.
Generally, prices respect fair value gaps and continue in their trend direction. However, when a fair value gap is breached, it transforms into an inversion fair value gap, signaling a potential short-term reversal or a subsequent change in direction.
🔵 How to Use
🟣 Identifying an Inversion Fair Value Gap
To spot an IFVG, you must first identify a fair value gap.
Inversion fair value gaps can be categorized into two types :
🟣 Bullish Inversion Fair Value Gap
A bullish IFVG occurs when a bearish fair value gap is invalidated by the price closing above it.
Steps to identify it :
Identify a bearish fair value gap.
When the price closes above this gap, it becomes a bullish inversion fair value gap.
This gap acts as a support level, pushing the price upwards and indicating a shift in momentum from sellers to buyers.
🟣 Bearish Inversion Fair Value Gap
A bearish IFVG happens when a bullish fair value gap fails, with the price closing below it.
Steps to identify it :
Identify a bullish fair value gap.
When the price closes below this gap, it becomes a bearish inversion fair value gap.
This gap acts as a resistance level, pushing the price downwards and indicating a shift in momentum from buyers to sellers.
🔵 Settings
🟣 Global Settings
Show All Inversion FVG: If disabled, only the most recent FVG will be displayed.
IFVG Validity Period (Bar): Determines the maximum duration (in number of candles) that the FVG and IFVG remain valid.Switching Colors Theme Mode: Includes three modes: "Off", "Light", and "Dark". "Light" mode adjusts colors for light mode use, "Dark" mode adjusts colors for dark mode use, and "Off" disables color adjustments.
🟣 Logic Settings
FVG Filter : This refines the number of identified FVG areas based on a specified algorithm to focus on higher quality signals and reduce noise.
Types of FVG filters :
Very Aggressive Filter : Adds a condition where, for an upward FVG, the last candle's highest price must exceed the middle candle's highest price, and for a downward FVG, the last candle's lowest price must be lower than the middle candle's lowest price. This minimally filters out FVGs.
Aggressive Filte r: Builds on the Very Aggressive mode by ensuring the middle candle is not too small, filtering out more FVGs.
Defensive Filter : Adds criteria regarding the size and structure of the middle candle, requiring it to have a substantial body and specific polarity conditions, filtering out a significant number of FVGs.
Very Defensive Filter : Further refines filtering by ensuring the first and third candles are not small-bodied doji candles, retaining only the highest quality signals.
Mitigation Level FVG and IFVG : Options include "Proximal", "Distal", or "50 % OB" modes, which you can choose based on your needs. The "50 % OB" line is the midpoint between distal and proximal.
🟣 Display Settings
Show Bullish IFVG : Toggles the display of demand-related boxes.
Show Bearish IFVG : Toggles the display of supply-related boxes.
🟣 Alert Settings
Alert Inversion FVG Mitigation : Enables alerts for Inversion FVG mitigation.
Message Frequency : Determines the frequency of alerts. Options include 'All' (every function call), 'Once Per Bar' (first call within the bar), and 'Once Per Bar Close' (final script execution of the real-time bar). Default is 'Once per Bar'.
Show Alert Time by Time Zone : Configures the time zone for alert messages. Default is 'UTC'.
Display More Info : Provides additional details in alert messages, including price range, date, hour, and minute. Set to 'Off' to exclude this information.

FVG & IFVG ICT [TradingFinder] Inversion Fair Value Gap Signal🔵 Introduction
🟣 Fair Value Gap (FVG)
To spot a Fair Value Gap (FVG) on a chart, you need to perform a detailed candle-by-candle analysis.
Here’s the process :
Focus on Candles with Large Bodies : Identify a candle with a substantial body and examine it alongside the preceding candle.
Check Surrounding Candles : The candles immediately before and after the central candle should have long shadows.
Ensure No Overlap : The bodies of the candles before and after the central candle should not overlap with the body of the central candle.
Determine the FVG Range : The gap between the shadows of the first and third candles forms the FVG range.
🟣 ICT Inversion Fair Value Gap (IFVG)
An ICT Inversion Fair Value Gap, also known as a reverse FVG, is a failed fair value gap where the price does not respect the gap. An IFVG forms when a fair value gap fails to hold the price and the price moves beyond it, breaking the fair value gap.
This marks the initial shift in price momentum. Typically, when the price moves in one direction, it respects the fair value gaps and continues its trend.
However, if a fair value gap is violated, it acts as an inversion fair value gap, indicating the first change in price momentum, potentially leading to a short-term reversal or a subsequent change in direction.
🟣 Bullish Inversion Fair Value Gap (Bullish IFVG)
🟣 Bearish Inversion Fair Value Gap (Bearish IFVG)
🔵 How to Use
🟣 Identify an Inversion Fair Value Gap
To identify an IFVG, you first need to recognize a fair value gap. Just as fair value gaps come in two types, inversion fair value gaps also fall into two categories:
🟣 Bullish Inversion Fair Value Gap
A bullish IFVG is essentially a bearish fair value gap that is invalidated by the price closing above it.
Here’s how to identify it :
Identify a bearish fair value gap.
When the price closes above this bearish fair value gap, it transforms into a bullish inversion fair value gap.
This gap acts as support for the price and drives it upwards, indicating a reduction in sellers' strength and an initial shift in momentum towards buyers.
🟣 Bearish Inversion Fair Value Gap
A bearish IFVG is primarily a bullish fair value gap that fails to hold the price, with the price closing below it.
Here’s how to identify it :
Identify a bullish fair value gap.
When the price closes below this gap, it becomes a bearish inversion fair value gap.
This gap acts as resistance for the price, pushing it downwards. A bearish inversion fair value gap signifies a decrease in buyers' momentum and an increase in sellers' strength.
🔵 Setting
🟣 Global Setting
Show All FVG : If it is turned off, only the last FVG will be displayed.
S how All Inversion FVG : If it is turned off, only the last FVG will be displayed.
FVG and IFVG Validity Period (Bar) : You can specify the maximum time the FVG and the IFVG remains valid based on the number of candles from the origin.
Switching Colors Theme Mode : Three modes "Off", "Light" and "Dark" are included in this parameter. "Light" mode is for color adjustment for use in "Light Mode".
"Dark" mode is for color adjustment for use in "Dark Mode" and "Off" mode turns off the color adjustment function and the input color to the function is the same as the output color.
🟣 Logic Setting
FVG Filter
When utilizing FVG filtering, the number of identified FVG areas undergoes refinement based on a specified algorithm. This process helps to focus on higher quality signals and eliminate noise.
Here are the types of FVG filters available :
Very Aggressive Filter : Introduces an additional condition to the initial criteria. For an upward FVG, the highest price of the last candle must exceed the highest price of the middle candle. Similarly, for a downward FVG, the lowest price of the last candle should be lower than the lowest price of the middle candle. This mode minimally filters out FVGs.
Aggressive Filter : Builds upon the Very Aggressive mode by considering the size of the middle candle. It ensures the middle candle is not too small, thereby eliminating more FVGs compared to the Very Aggressive mode.
Defensive Filter : In addition to the conditions of the Very Aggressive mode, the Defensive mode incorporates criteria regarding the size and structure of the middle candle. It requires the middle candle to have a substantial body, with specific polarity conditions for the second and third candles relative to the first candle's direction. This mode filters out a significant number of FVGs, focusing on higher-quality signals.
Very Defensive Filter : Further refines filtering by adding conditions that the first and third candles should not be small-bodied doji candles. This stringent mode eliminates the majority of FVGs, retaining only the highest quality signals.
Mitigation Level FVG and IFVG : Its inputs are one of "Proximal", "Distal" or "50 % OB" modes, which you can enter according to your needs. The "50 % OB" line is the middle line between distal and proximal.
🟣 Display Setting
Show Bullish FVG : Enables the display of demand-related boxes, which can be toggled on or off.
Show Bearish FVG : Enables the display of supply-related boxes along the path, which can also be toggled on or off.
Show Bullish IFVG : Enables the display of demand-related boxes, which can be toggled on or off.
Show Bearish IFVG : Enables the display of supply-related boxes along the path, which can also be toggled on or off.
🟣 Alert Setting
Alert FVG Mitigation : If you want to receive the alert about FVG's mitigation after setting the alerts, leave this tick on. Otherwise, turn it off.
Alert Inversion FVG Mitigation : If you want to receive the alert about Inversion FVG's mitigation after setting the alerts, leave this tick on. Otherwise, turn it off.
Message Frequency : This parameter, represented as a string, determines the frequency of announcements. Options include: 'All' (triggers the alert every time the function is called), 'Once Per Bar' (triggers the alert only on the first call within the bar), and 'Once Per Bar Close' (activates the alert only during the final script execution of the real-time bar upon closure). The default setting is 'Once per Bar'.
Show Alert time by Time Zone : The date, hour, and minute displayed in alert messages can be configured to reflect any chosen time zone. For instance, if you prefer London time, you should input 'UTC+1'. By default, this input is configured to the 'UTC' time zone.
Display More Info : The 'Display More Info' option provides details regarding the price range of the order blocks (Zone Price), along with the date, hour, and minute. If you prefer not to include this information in the alert message, you should set it to 'Off'.

Inversion Fair Value Gap Screener | Flux Charts💎 GENERAL OVERVIEW
Introducing our new Inverse Fair Value Gap Screener! This screener can provide information about the latest Inverse Fair Value Gaps in up to 5 tickers. You can also customize the algorithm that finds the Inverse Fair Value Gaps and the styling of the screener.
Features of the new Inverse Fair Value Gap (IFVG) Screener :
Find Latest Inverse Fair Value Gaps Across 5 Tickers
Shows Their Information Of :
Latest Status
Number Of Retests
Consumption Percent
Volume
Customizable Algorithm / Styling
📌 HOW DOES IT WORK ?
A Fair Value Gap generally occur when there is an imbalance in the market. They can be detected by specific formations within the chart. An Inverse Fair Value Gap is when a FVG becomes invalidated, thus reversing the direction of the FVG.
IFVGs get consumed when a Close / Wick enters the IFVG zone. Check this example:
This screener then finds Fair Value Gaps across 5 different tickers, and shows the latest information about them.
Status ->
Far -> The current price is far away from the IFVG.
Approaching ⬆️/⬇️ -> The current price is approaching the IFVG, and the direction it's approaching from.
Inside -> The price is currently inside the IFVG.
Retests -> Retest means the price tried to invalidate the IFVG, but failed to do so. Here you can see how many times the price retested the IFVG.
Consumed -> IFVGs get consumed when a Close / Wick enters the IFVG zone. For example, if the price hits the middle of the IFVG zone, the zone is considered 50% consumed.
Volume -> Volume of a IFVG is essentially the volume of the bar that broke the original FVG that formed it.
🚩UNIQUENESS
This screener can detect latest Inverse Fair Value Gaps and give information about them for up to 5 tickers. This saves the user time by showing them all in a dashboard at the same time. The screener also uniquely shows information about the number of retests and the consumed percent of the IFVG, as well as it's volume. We believe that this extra information will help you spot reliable IFVGs easier.
⚙️SETTINGS
1. Tickers
You can set up to 5 tickers for the screener to scan Fair Value Gaps here. You can also enable / disable them and set their individual timeframes.
2. General Configuration
FVG Zone Invalidation -> Select between Wick & Close price for FVG Zone Invalidation.
IFVG Zone Invalidation -> Select between Wick & Close price for IFVG Zone Invalidation. This setting also switches the type for IFVG consumption.
Zone Filtering -> With "Average Range" selected, algorithm will find FVG zones in comparison with average range of last bars in the chart. With the "Volume Threshold" option, you may select a Volume Threshold % to spot FVGs with a larger total volume than average.
FVG Detection -> With the "Same Type" option, all 3 bars that formed the FVG should be the same type. (Bullish / Bearish). If the "All" option is selected, bar types may vary between Bullish / Bearish.
Detection Sensitivity -> You may select between Low, Normal or High FVG detection sensitivity. This will essentially determine the size of the spotted FVGs, with lower sensitivities resulting in spotting bigger FVGs, and higher sensitivities resulting in spotting all sizes of FVGs.

Fibonacci Inversion Fair Value Gaps | Flux Charts💎 GENERAL OVERVIEW
Introducing our new Fibonacci Inversion Fair Value Gaps (IFVG) indicator! Inverse Fair Value Gaps occur when a Fair Value Gap becomes invalidated. They reverse the role of the original Fair Value Gap, making a bullish zone bearish and vice versa. This indicator plots the Fibonacci retracement levels of the IFVG, which often act like support & resistance levels.
Features of the new Fibonacci IFVGs Indicator :
Renders Bullish / Bearish IFVG Zones
Renders Fibonacci Retracement Levels Of IFVGs
Combination Of Overlapping FVG Zones
Variety Of Zone Detection / Sensitivity / Filtering / Invalidation Settings
High Customizability
🚩UNIQUENESS
This indicator stands out with its ability to render up to 3 Fibonacci retracement levels of IFVGs. Fibonacci retracement levels are widely used within trading, and we wanted to implement them for IFVG zones. You can also customize the FVG Filtering method, FVG & IFVG Zone Invalidation, Detection Sensitivity etc. according to your needs to get the best performance from the indicator.
📌 HOW DOES IT WORK ?
A Fair Value Gap generally occur when there is an imbalance in the market. They can be detected by specific formations within the chart. An Inverse Fair Value Gap is when a FVG becomes invalidated, thus reversing the direction of the FVG.
This indicator renders 0.618, 0.5 and 0.382 (can be changed from the settings) Fibonacci retracement levels of the IFVGs, which often act as support and resistances. Check this example :
⚙️SETTINGS
1. General Configuration
FVG Zone Invalidation -> Select between Wick & Close price for FVG Zone Invalidation.
IFVG Zone Invalidation -> Select between Wick & Close price for IFVG Zone Invalidation. This setting also switches the type for IFVG consumption.
Zone Filtering -> With "Average Range" selected, algorithm will find FVG zones in comparison with average range of last bars in the chart. With the "Volume Threshold" option, you may select a Volume Threshold % to spot FVGs with a larger total volume than average.
FVG Detection -> With the "Same Type" option, all 3 bars that formed the FVG should be the same type. (Bullish / Bearish). If the "All" option is selected, bar types may vary between Bullish / Bearish.
Detection Sensitivity -> You may select between Low, Normal or High FVG detection sensitivity. This will essentially determine the size of the spotted FVGs, with lower sensitivies resulting in spotting bigger FVGs, and higher sensitivies resulting in spotting all sizes of FVGs.
Show Historic Zones -> If this option is on, the indicator will render invalidated IFVG zones as well as current IFVG zones. For a cleaner look at current IFVG zones which are not invalidated yet, you can turn this option off.
2. Fibonacci Retracement Levels
You can enable / disable up to 3 different Fibonnaci Retracement levels at this group of settings. You can also switch their line styles between solid, dashed and dotted as well as changing their colors.

Inversion Fair Value Gap Consumption | Flux Charts💎 GENERAL OVERVIEW
Introducing our new Inversion Fair Value Gap Consumption (IFVG) indicator! Inversion Fair Value Gaps occur when a Fair Value Gap becomes invalidated. They reverse the role of the original Fair Value Gap, making a bullish zone bearish and vice versa. IFVGs get "consumed" when market orders fill the gap occurred. With this indicator, you can now see the percentage of the IFVG's consumed part. For more information about the process, read the "HOW DOES IT WORK" section of the description.
Features of the new Consumption IFVG Indicator :
Render Bullish / Bearish IFVG Zones
See The Consumed Part Of The IFVG Zones
Combination Of Overlapping FVG Zones
Variety Of Zone Detection / Sensitivity / Filtering / Invalidation Settings
High Customizability
🚩UNIQUENESS
This indicator stands out with its ability to render the consumed part of IFVGs. You can see how much of the IFVG's gap is filled, with it's percentage. Also the ability to combine overlapping FVG zones will result in cleaner charts for traders. You can customize the FVG Filtering method, FVG & IFVG Zone Invalidation, Detection Sensitivity etc. according to your needs to get the best performance from the indicator.
📌 HOW DOES IT WORK ?
A Fair Value Gap generally occur when there is an imbalance in the market. They can be detected by specific formations within the chart. An Inversion Fair Value Gap is when a FVG becomes invalidated, thus reversing the direction of the FVG.
IFVGs get consumed when a Close / Wick enters the IFVG zone. Check this example:
⚙️SETTINGS
1. General Configuration
FVG Zone Invalidation -> Select between Wick & Close price for FVG Zone Invalidation.
IFVG Zone Invalidation -> Select between Wick & Close price for IFVG Zone Invalidation. This setting also switches the type for IFVG consumption.
Zone Filtering -> With "Average Range" selected, algorithm will find FVG zones in comparison with average range of last bars in the chart. With the "Volume Threshold" option, you may select a Volume Threshold % to spot FVGs with a larger total volume than average.
FVG Detection -> With the "Same Type" option, all 3 bars that formed the FVG should be the same type. (Bullish / Bearish). If the "All" option is selected, bar types may vary between Bullish / Bearish.
Detection Sensitivity -> You may select between Low, Normal or High FVG detection sensitivity. This will essentially determine the size of the spotted FVGs, with lower sensitivies resulting in spotting bigger FVGs, and higher sensitivies resulting in spotting all sizes of FVGs.
Show Historic Zones -> If this option is on, the indicator will render invalidated IFVG zones as well as current IFVG zones. For a cleaner look at current IFVG zones which are not invalidated yet, you can turn this option off.

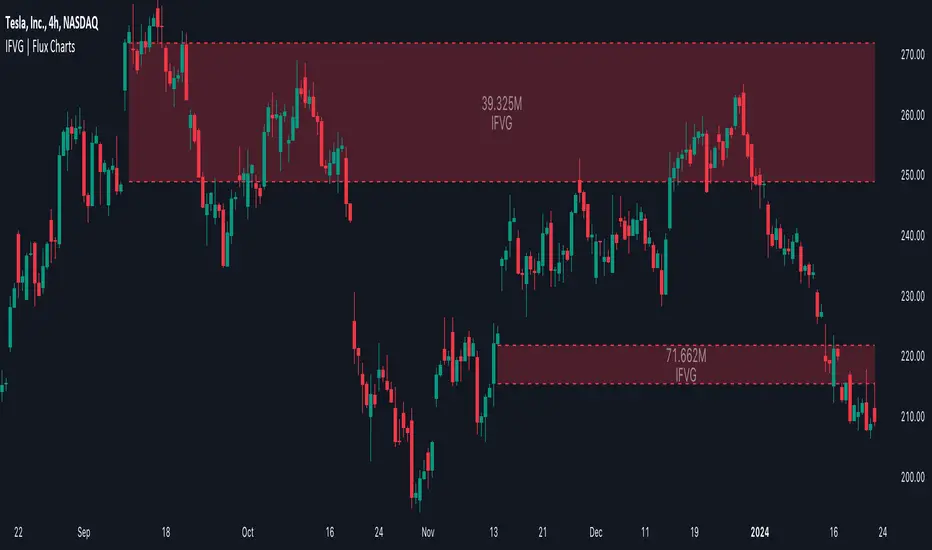
Inversion Fair Value Gaps (IFVG) [LuxAlgo]The Inversion Fair Value Gaps (IFVG) indicator is based on the inversion FVG concept by ICT and provides support and resistance zones based on mitigated Fair Value Gaps (FVGs).
🔶 USAGE
Once mitigation of an FVG occurs, we detect the zone as an "Inverted FVG". This would now be looked upon for potential support or resistance.
Mitigation occurs when the price closes above or below the FVG area in the opposite direction of its bias.
Inverted Bullish FVGs Turn into Potential Zones of Resistance.
Inverted Bearish FVGs Turn into Potential Zones of Support.
After the FVG has been mitigated, returning an inversion FVG, a signal is displayed each time the price retests an IFVG zone and breaks below or above (depending on the direction of the FVG).
Keep in mind how IFVGs are calculated and displayed. Once price mitigates an IFVG, all associated graphical elements such as areas, lines, and signals will be deleted.
This indicator is not meant to be just a 'signal indicator'. Backtesting historical signals is incorrect as it does not consider the mitigation of IFVGs, which is a standard method for trading IFVGs & various concepts by ICT.
The signals displayed are meant for real-time analysis of current bars for discretionary analysis. Current confirmed retests of unmitigated IFVGs are still displayed to show which IFVGS have had significant reactions.
🔶 SETTINGS
Show Last: Specifies the number of most recent FVG Inversions to display in Bullish/Bearish pairs, starting at the current and looking back. Max 100 Pairs.
Signal Preference: Allows the user to choose to send signals based on the (Wicks) or (Close) Prices. This can be changed based on user preference.
ATR Multiplier: Filters FVGs based on ATR Width, The script will only detect Inversions that are greater than the ATR * ATR Width.
🔶 ALERTS
This script includes alert options for all signals.
🔹 Bearish Signal
A bearish signal occurs when the price returns to a bearish inversion zone and rejects to the downside.
🔹 Bullish Signal
A bullish signal occurs when the price returns to a bullish inversion zone and bounces out of the top.

Inversion Fair Value Gaps | Flux Charts💎 GENERAL OVERVIEW
Introducing our new Inversion Fair Value Gaps (IFVG) indicator! Inversion Fair Value Gaps occur when a Fair Value Gap becomes invalidated. They reverse the role of the original Fair Value Gap, making a bullish zone bearish and vice versa. With this indicator, you can now see the volume of the bar that invalidated the FVG, which is also the bar that IFVG occurred. For more information about the process, read the " HOW DOES IT WORK " section of the description.
Features of the IFVG Indicator :
Render Bullish / Bearish IFVG Zones
See The Occurrence Volume Of The IFVG Zones
Combination Of Overlapping FVG Zones
Variety Of Zone Detection / Sensitivity / Filtering / Invalidation Settings
High Customizability
🚩UNIQUENESS
This indicator stands out with its ability to render the occurrence volume of IFVGs. Also the ability to combine overlapping FVG zones will result in cleaner charts for traders. You can customize the FVG Filtering method, FVG & IFVG Zone Invalidation, Detection Sensitivity etc. according to your strategy to get the best performance from the indicator.
📌 HOW DOES IT WORK ?
A Fair Value Gap generally occur when there is an imbalance in the market. They can be detected by specific formations within the chart. An Inversion Fair Value Gap is when a FVG becomes invalidated, thus reversing the direction of the FVG.
⚙️SETTINGS
1. General Configuration
FVG Zone Invalidation -> Select between Wick & Close price for FVG Zone Invalidation.
IFVG Zone Invalidation -> Select between Wick & Close price for IFVG Zone Invalidation.
Zone Filtering -> With "Average Range" selected, algorithm will find FVG zones in comparison with average range of last bars in the chart. With the "Volume Threshold" option, you may select a Volume Threshold % to spot FVGs with a larger total volume than average.
FVG Detection -> With the "Same Type" option, all 3 bars that formed the FVG should be the same type. (Bullish / Bearish). If the "All" option is selected, bar types may vary between Bullish / Bearish.
Detection Sensitivity -> You may select between Low, Normal or High FVG detection sensitivity. This will essentially determine the size of the spotted FVGs, with lower sensitivies resulting in spotting bigger FVGs, and higher sensitivies resulting in spotting all sizes of FVGs.
Show Historic Zones -> If this option is on, the indicator will render invalidated IFVG zones as well as current IFVG zones. For a cleaner look at current IFVG zones which are not invalidated yet, you can turn this option off.
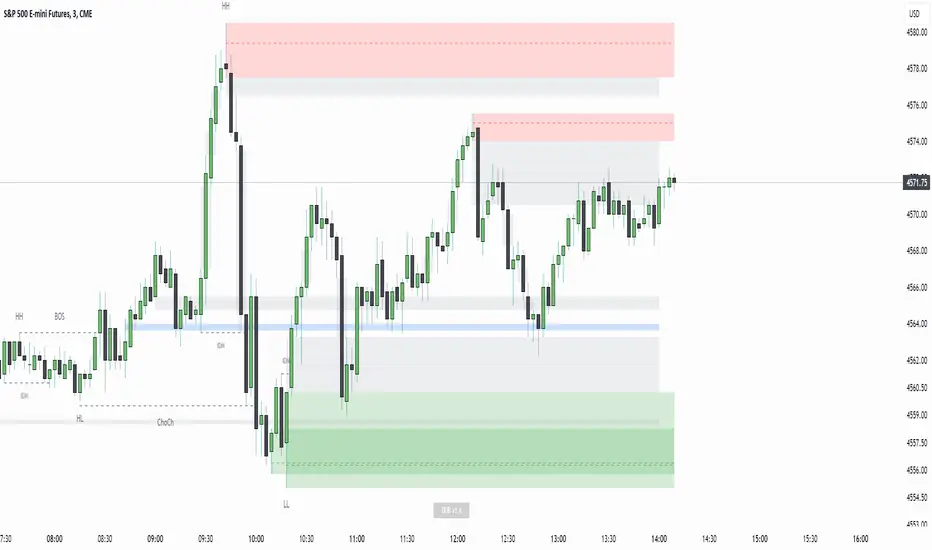
Displacement Order Blocks ~ DOB [Liquidity_Pro]Displacement Order Blocks (DOB)
This indicator shows order blocks with displacement (FVG required) and leans heavily on ICT’s generous and insightful teachings to define midlines for FVG, IFVG, and order blocks. The market structure definitions follow TradingHub’s (TH) rules filtering out inside bars.
It offers alerts for price in order block, liquidity sweep, break of structure (BOS), change of character (CHoCH), and inducement (IDM).
The TH model was chosen because it's programmatic allowing clear structure definitions that allow us to mark inducements (S/O to @albatherium for publishing the first TH market structure indicator).
TH’s Single Candle Order Block (SCOB) rules have also been helpful in refining order block definition, for example in the Transfer case. ICT fans will see when back testing this, that it moves the focus closer to the FVG.
In developing this indicator, we've tried to offer great aesthetic flexibility, to keep the chart uncluttered and to avoid exceeding Trading View’s limitations on boxes and lines. It's also configured to work reasonably well on both light and dark background charts:
We hope this indicator can serve as a teaching tool for ICT’s price action insights and SMC market structure concepts. For this, we've included optional labels for various order block types:
I = inside bar. The bars that follow the order block have been ignored – you will see the number of ignored bars shown after a hyphen. The idea is that inside bars fall in the shadow of a more important candle and can’t be relied on for defining a trade.
S = standard case. The order block candle takes liquidity from the previous candle and is followed immediately after by an FVG on the next candle. This differs technically from the ICT “last down-close/last up-close” order block concept. In practice, this choice has very little impact on ICT trading, because the ICT trader is entering on the FVG anyway.
T = transfer case. This is an order block that has been transferred from the candle that takes liquidity to the candle just prior to the FVG. When you back test this, you will see it is a high probability choice.
TZ = tweezer. This is an option you can turn off that fills a hole in TH teachings. It bypasses the requirement for an order block to take liquidity from the previous candle in the case of equal h/ls. The result is that you will find 2 candle order blocks with equal highs and lows (also known as tweezer tops/bottoms) show on your chart. You will note that every tweezer is a wick on a higher timeframe.
W = wick. this is a big wick candle that we call an order block without requiring an FVG. The presumption is that the displacement is contained within the wick itself on a lower timeframe.
* Asterisk denotes an extreme order block.
Finally, we trade with this indicator (using it together with our Daye Quarterly Theory ~ DQT free indicator, taking trades when price reaches an extreme FVG or order block during a Q2 manipulation).
We will continue developing it along with other indicators we have not yet published. So please boost if you like this and follow us for updates. Also please let us know what new features you would like to see.
Inverse FVG with Rejections [TFO]This indicator is made to look for Inverse Fair Value Gaps (IFVGs) and show rejections from relevant areas. Fair Value Gaps (FVGs) are created when there is an energetic move that leaves a gap between the preceding and following candle's wicks. When that area is violated, we may consider that area as an Inverse FVG, treating it along the lines of a "support turned resistance" type setup with proper context.
Once a Fair Value Gap (FVG) is found with sufficient user-defined displacement, it is saved until price fully closes through that area, at which point it becomes an IFVG, which is also saved until price once again closes through that area.
Users can select a specific time period from which to look for and save FVGs, such as during the New York trading session in the following example.
Lastly, users can enable rejections that look for swing lows in bullish FVGs/IFVGs and swing highs in bearish FVGs/IFVGs. The following picture shows an instance of rejections from both regular and inverse FVGs, meaning the pivots were formed in a mutually shared area between a FVG and IFVG.

ICT Imbalances (fadi)ICT Imbalances focuses on highlighting the imbalances described by ICT Se imbalances usually act as a price magnet where price tend to revisit to mitigate the imbalance and can act as support and resistance.
It is important to understand that, while they do act as price magnet, they are not all places for entries. What they do provide, is a price understanding and possible areas of reversal based on the bigger picture and trading strategy.
There are four types of imbalances covered by this indicator:
Fair Value Gap (FVG)
Fair value is when, at any given price, both buy and sell sides are offered. For every up move, there is a down move. Fair value Gap is an imbalance where price moved too quickly before offering both buy side and sell side at a given price.
Implied Fair Value Gap (IFVG)
Implied Fair Value Gap is when the first and third candle have overlapping large wicks. The IFVG is the area between the half point of first and third candles.
Volume Imbalance (V.I.)
Volume imbalance is when the price creates a gap between the close of one candle and the open of the following candle with overlapping wicks.
Gap
An area where price gaps up or down leaving a void where price did not trade in. This is most common on higher timeframes and when one day ends and the next day begins.
Settings
ICT Imbalances provides the following options
- Show or hide specific imbalance to keep the chart clean
- Background color of the box highlighting the imbalance
- Box width in the form of how many candles the box extends to
- Show or Hide the Half Mark of the box, only applies to FVG and IFVG
- Show or hide a Legend that explains which colors represents which imbalance
ICT Implied Fair Value Gap (IFVG) [LuxAlgo]An Implied Fair Value Gap (IFVG) is a three candles imbalance formation conceptualized by ICT that is based on detecting a larger candle body & then measuring the average between the two adjacent candle shadows.
This indicator automatically detects this imbalance formation on your charts and can be extended by a user set number of bars.
The IFVG average can also be extended until a new respective IFVG is detected, serving as a support/resistance line.
Alerts for the detection of bullish/bearish IFVG's are also included in this script.
🔶 SETTINGS
Shadow Threshold %: Threshold percentage used to filter out IFVG's with low adjacent candles shadows.
IFVG Extension: Number of bars used to extend highlighted IFVG's areas.
Extend Averages: Extend IFVG's averages up to a new detected respective IFVG.
🔶 USAGE
Users of this indicator can primarily find it useful for trading imbalances just as they would for trading regular Fair Value Gaps or other imbalances, which aims to highlight a disparity between supply & demand.
For trading a bullish IFVG, users can find this imbalance as an area where price is likely to fill or act as an area of support.
In the same way, a user could trade bearish IFVGs by seeing it as a potential area to be filled or act as resistance within a downtrend.
Users can also extend the IFVG averages and use them as longer-term support/resistances levels. This can highlight the ability of detected IFVG to provide longer term significant support and resistance levels.
🔶 DETAILS
Various methods have been proposed for the detection of regular FVG's, and as such it would not be uncommon to see various methods for the implied version.
We propose the following identification rules for the algorithmic detection of IFVG's:
🔹 Bullish
Central candle body is larger than the body of the adjacent candles.
Current price low is higher than high price two bars ago.
Current candle lower shadow makes up more than p percent of its total candle range.
Candle upper shadow two bars ago makes up more than p percent of its total candle range.
The average of the current candle lower shadow is greater than the average of the candle upper shadow two bars ago.
where p is the user set threshold.
🔹 Bearish
Central candle body is larger than the body of the adjacent candles.
Current price high is higher than low price two bars ago.
Current candle upper shadow makes up more than p percent of its total candle range.
Candle lower shadow two bars ago makes up more than p percent of its total candle range.
The average of the candle lower shadow 2 bars ago is greater than the average of the current candle higher shadow.
where p is the user set threshold.
🔶 SUPPLEMENTARY MATERIAL
You can see our previously posted script that detects various imbalances as well as regular Fair Value Gaps which have very similar usability to Implied Fair Value Gaps here:

ICT - GAPs and Volume Imbalance
GAPs
Gaps are areas on chart where the price have moved sharply up or down, with no trading in between. Gaps often fill, but they don't have to.
Volume Imbalance
Volume imbalance - determined using 2 candles
Bullish Volume Imbalance - area between the close of 1st candle and the open of 2nd candle
Bearish Volume Imbalance - area between the close of 1st candle and the open of 2nd candle
How to use the indicator:-
When you find imbalance in volume or a GAP in the chart, you may expect price to rebalance it before continuation.
Importantly, GAPs/Imbalances do not always fill. Traders should never assume that a gap/imbalance will fill without understanding the reasons for the gap and monitoring trading activity around the gap.
Pair it with your current bias for better results.
