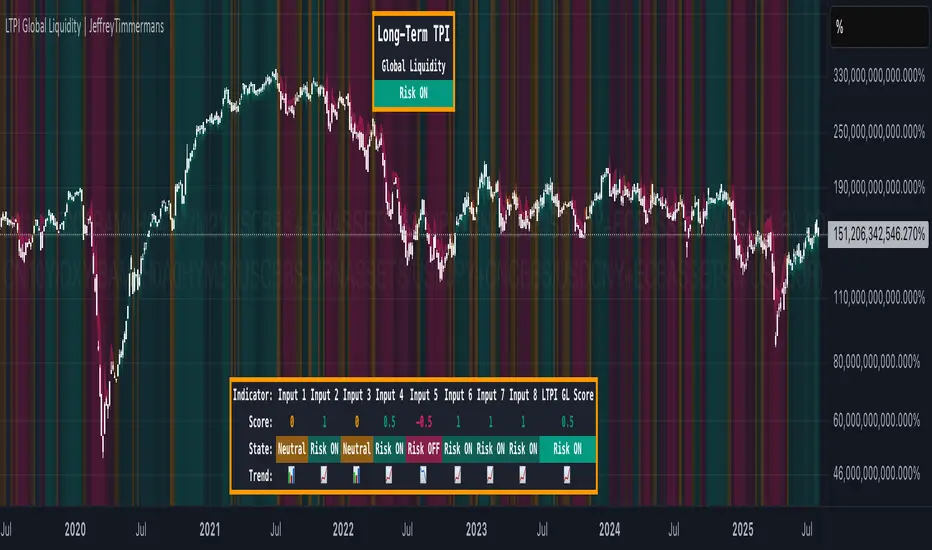
LTPI Global Liquidity | JeffreyTimmermansLong-Term Probability Indicator (LTPI)
The "Long-Term Probability Indicator (LTPI)" on a generic liquidity ticker is a custom-built analytical tool designed to evaluate market conditions over a long-term horizon, with a strong focus on global liquidity trends. By combining six carefully selected input signals into a single probability score, this indicator helps traders and analysts identify prevailing long-term market states: Bullish, Bearish, or Neutral.
Where short-term systems/timeframes react quickly to price fluctuations, LTPI smooths out noise and focuses on the bigger picture, allowing for informed strategic decision-making rather than short-term speculation.
Key Features
Multi-Input Aggregation:
Uses six independent inputs, each based on long-term liquidity and macro-related data, to generate a composite market probability score.
Long-Term Focus:
Prioritizes medium-to-long-term trends, ignoring smaller fluctuations that often mislead traders in volatile markets.
Simplified Market States:
Classifies the global market into three primary states:
Bullish: Favorable liquidity and conditions for long-term risk-taking.
Bearish: Tightening liquidity and conditions that require caution.
Neutral: Transitional phases or uncertain conditions.
Background Coloring:
Visual cues on the chart help identify which regime is active at a glance.
Global Liquidity Perspective:
Designed for use on a generic liquidity ticker, based on M2 money supply, to track macroeconomic liquidity flows and risk appetite.
Dashboard Display:
A compact on-screen table summarizes all six inputs, their states, and the resulting LTPI score.
Dynamic Alerts:
Real-time alerts signal when the LTPI shifts from one regime to another.
Inputs & Settings
LTPI Inputs:
Input Sources (6): Each input is a carefully chosen trend following indicator.
Weighting: Each input contributes equally to the final score.
Score Calculation:
Bullish = +1
Bearish = -1
Neutral = 0
Color Settings:
Strong Bullish: Bright Green
Weak Bullish: Light Green
Neutral: Gray/Orange
Weak Bearish: Light Red
Strong Bearish: Bright Red
(Colors can be customized.)
Calculation Process
Collect Data:
Six long-term inputs are evaluated at each bar.
Scoring:
Each input’s state contributes +1 (bullish), -1 (bearish), or around 0 (neutral).
Aggregate Probability:
The LTPI Score is calculated as the sum of all six scores divided by 6, resulting in a value between -1 and +1.
Market Classification:
Score > 0.1: Bullish regime
Score < -0.1: Bearish regime
-0.1 ≤ Score ≤ 0.1: Neutral
Background Coloring:
Background colors are applied to highlight the current regime.
How to Use LTPI
Strategic Positioning:
Bullish: Favor holding or adding to long-term positions.
Bearish: Reduce risk, protect capital.
Neutral: Wait for confirmation before making significant moves.
Confirmation Tool:
LTPI works best when combined with shorter-term indicators like MTPI or trend-following tools to confirm alignment across multiple timeframes.
Dynamic Alerts:
Bullish Regime Entry: When the LTPI Score crosses above 0.1.
Bearish Regime Entry: When the LTPI Score crosses below -0.1.
Neutral Zone: When the score moves back between -0.1 and 0.1.
These alerts help identify significant macro-driven shifts in market conditions.
Conclusion
The Long-Term Probability Indicator (LTPI) is an advanced, liquidity-focused tool for identifying macro-driven market phases. By consolidating six inputs into a single probability score and presenting the results visually, LTPI helps long-term investors and analysts stay aligned with global liquidity trends and avoid being distracted by short-term volatility.
Globalliquidity
My-Indicator - Global Liquidity & Money Supply M2 + Time OffsetThis script is designed to visualize a global liquidity and money supply index by combining data from various regions and, optionally, central bank activity. Visualizing this data on a chart allows you to see how central banks are intervening in the financial system and how the total amount of money in the economy is changing. Let’s take a look at how it works:
Central Bank Liquidity
Shows the actions of central banks (e.g. FED, ECB) providing short-term cash to commercial banks. If you see spikes or a steady increase in these indicators, it may suggest that liquidity is being increased through intervention, which often stimulates the market.
Money Supply
M2 money supply is a monetary aggregate that includes M1 (cash and current deposits) plus savings deposits, small term deposits, and other financial instruments that, while not as liquid as M1, can be quickly converted into cash. As a result, M2 provides a broader picture of the available money in the economy, which is useful for analyzing market conditions and potential economic trends.
How does it help investors?
It allows you to quickly see when central banks are injecting additional liquidity, which could signal higher prices.
It allows you to see trends in the money supply, which informs potential changes in inflation and the economic cycle.
Combining both sets of data provides a more complete picture – both in the short and long term – which makes it easier to predict upcoming price movements.
This allows investors to better respond to changes in central bank policy and broader monetary trends, increasing their chances of making better investment decisions.
Data Collection
The script retrieves money supply data for key markets such as the USA (USM2), Europe (EUM2), China (CNM2), and Japan (JPM2). It also offers additional money supply series for other markets—like Canada (CAM2), Great Britain (GBM2), Russia (RUM2), Brazil (BRM2), Mexico (MXM2), and New Zealand (NZM2)—with extra options (e.g., Australia, India, Korea, Indonesia, Malaysia, Sweden) disabled by default. Moreover, you can enable data for central bank liquidity (such as FED, RRP, TGA, ECB, PBC, BOJ, and other central banks), which are also disabled by default.
Index Calculation
The indicator calculates the index by adding together all the enabled money supply series (and the central bank data if activated) and then scales the sum by dividing it by 1,000,000,000,000 (one trillion). This scaling makes the resulting values more manageable and easier to read on the chart.
Time Offset Feature
A key feature of the script is the time offset. With the input parameter "Time Offset (days)", the user can shift the plotted index line by a specific number of days. The script converts the given offset in days into a number of bars based on the current chart's timeframe. This allows you to adjust for the delay between liquidity changes and their effect on asset prices.
Overall, the indicator plots a line on your chart representing the global liquidity and money supply index, allowing you to visually monitor trends and better understand how liquidity and central bank actions may influence market movements.
What makes this script different from others?
Every supported market—both major regions (USA, Eurozone, China, Japan, etc.) and additional ones—is available. You can toggle each series on or off, so you can view only Money Supply data, only Central Bank Liquidity, or any custom combination.
Separated Data Groups. Inputs are organized into clear groups (“Money Supply”, “Other Money Supply”, “Central Bank Liquidity”), making it easy to focus on just the data you need without clutter.
True Day‑Based Offset. This script converts your chosen “Time Offset (days)” into actual days regardless of timeframe. Whether you’re on a 5‑minute or daily chart, the index is always shifted by exactly the number of days you specify.

M2 Global Liquidity Index [Extended + Offset]M2 Global Liquidity Index
This indicator visualizes global M2 money supply, weighted in USD, based on major economic regions.
Features:
Standard Mode: Includes M2 data from the USA, China, Eurozone, Japan, and the UK.
Extended Mode: Adds Switzerland, Canada, India, Russia, Brazil, South Korea, Mexico, and South Africa.
Offset Function: Adjustable time lag (78 or 108 days) to analyze the delayed impact of liquidity on financial markets.
Use Case:
Designed to help identify global liquidity cycles and assess potential turning points in financial markets. Rising global liquidity generally supports risk assets like equities and crypto, while declining liquidity can put downward pressure on these markets.
Technical Details:
Non-USD M2 values are converted using real-time FX rates.
All values are displayed in trillions of USD (Tn).
Note:
Not all countries release M2 data in real-time or at the same frequency. Minor delays and discrepancies may occur.
Example:

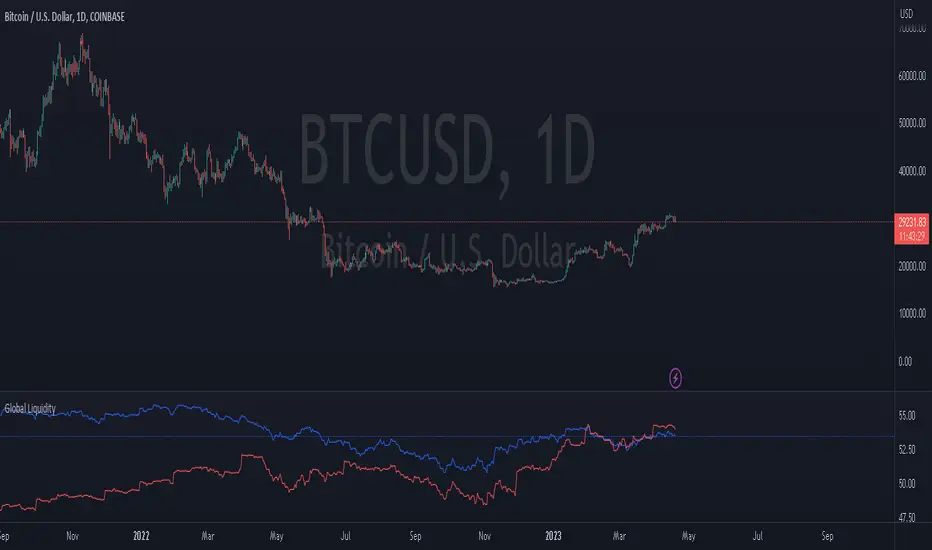
Global LiquidityThe "Global Liquidity" script is an indicator that calculates and displays the global liquidity value using a formula that takes into account the money supply of several major economies. The script utilizes data from various sources, such as the Federal Reserve Economic Data (FRED), Economics, and FX_IDC.
The indicator plots the global liquidity value as a candlestick chart and breaks it down into two categories: the Euro-Atlantic region (West) and the rest of the world (East). The values are denominated both in inflation-adjusted dollars and in trillions of dollars. The script also calculates the spread between the Euro-Atlantic region and the rest of the world.
Traders and investors can use this indicator to gauge the overall liquidity of the global economy and to identify potential investment opportunities or risks. By breaking down the liquidity value into different regions, traders can also gain insights into regional economic trends and dynamics.
Note that this script is subject to the terms of the Mozilla Public License 2.0 and was created by rodopacapital.