Asset Liquidity Meter by Funded RelayAsset Liquidity Meter by Funded Relay
This indicator estimates the liquidity of any asset by calculating the volume traded per unit of price movement (volume / (high - low)).
Higher values generally indicate better liquidity (more volume in a smaller price range → easier to enter/exit positions with less slippage).
Lower values suggest thinner liquidity (higher risk of price impact and volatility).
The indicator displays:
• Histogram: raw liquidity per bar (green = above SMA, red = below SMA)
• SMA line: smoothed liquidity trend
• Real-time info table in the top-right corner
• Built-in alert conditions
How to Use – Step by Step
1. Adding the Indicator
- Open any chart on TradingView
- Click the "Indicators" button at the top
- Search for "Asset Liquidity Meter v6" (or find it in Community Scripts / My Scripts)
- Click to add it to the chart
- It will appear in a separate pane below the price chart
2. Customizing Settings
Double-click the indicator name in the pane (or right-click → Settings):
• SMA Length (default: 14)
- Controls the smoothing period of the liquidity trend line
- Smaller values (5–10) → more responsive, good for intraday/scalping
- Larger values (20–50) → smoother trend, better for swing/position trading
• Epsilon (default: 0.00000001)
- Tiny value that prevents division-by-zero errors on flat bars (high = low)
- Almost never needs to be changed
• Colors
- High Liquidity Color: histogram bars when liquidity > SMA
- Low Liquidity Color: histogram bars when liquidity < SMA
- SMA Line Color: color of the smoothed trend line
• Show Alert Conditions in Menu
- Keep enabled (true) to see the built-in alert options when creating alerts
3. Reading & Interpreting the Indicator
• Histogram Bars (Raw Liquidity)
- Height = amount of volume per unit of price range
- Tall bars = high liquidity (market is "thick")
- Short bars = low liquidity (market is "thin")
- Green = current liquidity is stronger than the average (SMA)
- Red = current liquidity is weaker than the average
• Blue SMA Line
- Shows the average liquidity over the selected period
- Rising line → liquidity improving (more participants, easier trading)
- Falling line → liquidity decreasing (thinner market, caution advised)
• Info Table (top-right corner)
- Displays current raw liquidity, SMA value, and status ("High Liquidity" / "Low Liquidity")
- Updates in real-time on the last bar
• Zero Line (dotted gray)
- Visual reference — everything above zero is positive liquidity
4. Practical Trading Applications
• High Liquidity Zones (green bars + rising SMA)
- Favorable conditions for entering or scaling into positions
- Lower expected slippage
- Better for large orders
• Low Liquidity Zones (red bars + falling SMA)
- Higher risk of slippage and exaggerated price moves
- Consider smaller position sizes or waiting for better conditions
- Common during session opens/closes, holidays, or low-volume periods
• Crossovers
- Liquidity crossing above SMA → potential increase in market participation
- Liquidity crossing below SMA → potential drying up of interest
5. Setting Up Alerts
1. Right-click on the chart → "Add Alert"
2. In "Condition", select "Asset Liquidity Meter v6"
3. Choose one of the available alert conditions:
- Liquidity ↑ Crosses Above SMA
- Liquidity ↓ Crosses Below SMA
- Very High Liquidity (2× SMA)
- Very Low Liquidity (<30% SMA)
4. Set frequency (Once Per Bar Close is usually best)
5. Configure notification (email, popup, sound, webhook, etc.)
6. Create the alert
6. Tips for Best Results
• Works on all markets: stocks, forex, crypto, futures, indices
• Best on timeframes with meaningful volume data (5 min and higher usually give clearest signals)
• Compare liquidity across different assets or timeframes using multiple charts
• Combine with support/resistance, volume profile or order flow tools for confirmation
• Not a standalone signal — use in context with your overall strategy
Limitations & Notes
• This is an estimation based on OHLCV data — it does not show real order book depth
• Results vary significantly between centralized exchanges, brokers and instruments
• Zero-volume bars will show zero liquidity (expected behavior)
Enjoy safer and more informed trading!
Questions or suggestions? Feel free to comment below.
Fxsignals

Zaree - FX Index RSI IndicatorDescription:
The "Zaree - FX Index RSI Indicator" (FIRI) is a technical analysis tool designed to provide insights into the relative strength of two selected currency indices using the Relative Strength Index (RSI). It allows traders to compare the RSI values of a primary currency index and a secondary currency index, helping them identify potential overbought and oversold conditions in the currency market.
Details of the Indicator:
The indicator calculates the RSI for both the primary and secondary currency indices based on the user's selections.
Traders can choose from a variety of currency indices to use as the primary and secondary indices for comparison.
The indicator offers settings for customizing the calculation of the RSI, including selecting the type of moving average (SMA, EMA, WMA, SMMA) and adjusting the length of the RSI and moving average.
Upper and lower RSI bands are displayed on the chart to highlight potential overbought and oversold conditions.
The RSI values and their corresponding moving average values are plotted on the chart, allowing traders to visually analyze the relative strength of the indices.
How to Use the Indicator:
Select the primary and secondary currency indices you want to compare from the provided dropdown menus. These indices will serve as the basis for RSI calculation.
Choose the type of moving average (SMA, EMA, WMA, SMMA) to use for RSI calculation and set the desired length for the moving average.
Decide whether you want to visualize the RSI and moving average values for the primary and secondary indices on the chart.
Observe the RSI values and moving averages plotted on the chart. The indicator's upper and lower bands can help you identify potential overbought (above the upper band) and oversold (below the lower band) conditions.
Pay attention to the intersections between the RSI values and the moving average lines. These intersections can provide insights into potential trend changes or reversals in the currency market.
Example of Usage:
Let's say you're a swing trader focusing on currency pairs involving the US Dollar (USD) and Euro (EUR). You want to compare the relative strength of the USD Index (USDINX) and the EUR Index (EURINX) to identify potential trading opportunities. Here's how you can use the FIRI indicator:
Select "USDINX" as the primary index and "EURINX" as the secondary index.
Choose "SMA" as the moving average type and set the RSI length to 14.
Enable the visualization of RSI values for both the primary and secondary indices.
Observe the chart to identify instances where the RSI values of the indices cross above the upper band (potential overbought) or below the lower band (potential oversold).
Look for intersections between the RSI values and the moving average lines. A bullish signal may occur when the RSI crosses above the moving average, indicating potential upward momentum, while a bearish signal may occur when the RSI crosses below the moving average, indicating potential downward momentum.
Remember that the FIRI indicator is a tool to assist you in your analysis. It's important to consider other technical and fundamental factors before making trading decisions.
Feel free to adjust the settings of the indicator based on your trading preferences and strategy. Keep in mind that no indicator is foolproof, and it's recommended to use the FIRI indicator in conjunction with other analysis techniques for a comprehensive trading approach.

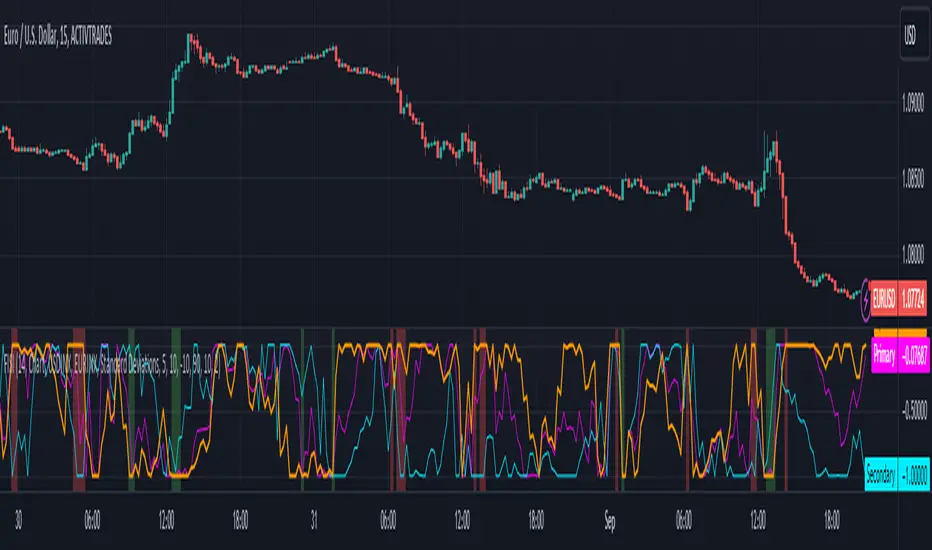
Zaree - FX Index Spread IndicatorDescription:
The "Zaree - FX Index Spread Indicator" (FISI) is a powerful technical analysis tool designed to provide insights into the spread between two selected currency indices. By calculating and visualizing the percentage difference between the values of a primary and a secondary currency index, traders can gain valuable information about potential market dynamics and trends.
Details of the Indicator:
The indicator calculates the spread percentage between a primary and a secondary currency index, allowing traders to understand the relative strength of the two indices.
Traders can choose from a list of currency indices to use as the primary and secondary indices for comparison.
The indicator offers multiple methods for setting thresholds to identify potential trading opportunities, including standard deviations, percentile ranks, historical highs and lows, and fixed thresholds.
Users can customize the length of the calculation period and choose whether to display the primary index, secondary index, and the spread percentage on the chart.
Shaded areas on the chart indicate regions where the spread percentage is above or below predefined thresholds, helping traders identify potential trading signals.
How to Use the Indicator:
Select the primary and secondary currency indices you want to compare from the provided dropdown menus. These indices will be used to calculate the spread percentage.
Choose the method for setting thresholds by selecting one of the options: "Standard Deviations," "Percentile Ranks," "Historical Highs and Lows," or "Fixed Thresholds."
Depending on the selected method, configure the relevant threshold parameters, such as historical threshold percentage, upper and lower fixed thresholds, upper and lower percentile thresholds, or the standard deviation multiplier.
Choose whether to visualize the primary index, secondary index, and spread percentage on the chart by enabling the respective options.
Observe the chart to identify potential trading signals based on the interactions between the spread percentage and the predefined thresholds.
Example of Usage:
Suppose you're interested in trading currency pairs involving the US Dollar (USD) and Euro (EUR), and you want to monitor the spread between the USD Index (USDINX) and the EUR Index (EURINX). Here's how you can use the FISI indicator:
Select "USDINX" as the primary index and "EURINX" as the secondary index.
Choose the method for setting thresholds based on your strategy. For instance, you can select "Standard Deviations" and adjust the standard deviation multiplier.
Enable the visualization of the primary index, secondary index, and spread percentage on the chart.
Observe the shaded areas on the chart. If the spread percentage crosses above the upper threshold, it may indicate a potential market overextension. Conversely, if the spread percentage crosses below the lower threshold, it could suggest an oversold market condition.
Look for instances where the spread percentage approaches or crosses the predefined thresholds. Consider these instances as potential entry or exit points for your trades.
Remember that the FISI indicator is a tool to assist you in your analysis. It's recommended to combine its insights with other technical and fundamental factors before making trading decisions. Adjust the indicator settings and thresholds based on your trading strategy and preferences.
As with any trading tool, practice and observation are key. Over time, you can refine your trading strategy by analyzing historical data and observing how the indicator performs in different market conditions.
Feel free to experiment with different settings and methods to find the configuration that aligns best with your trading style and goals.