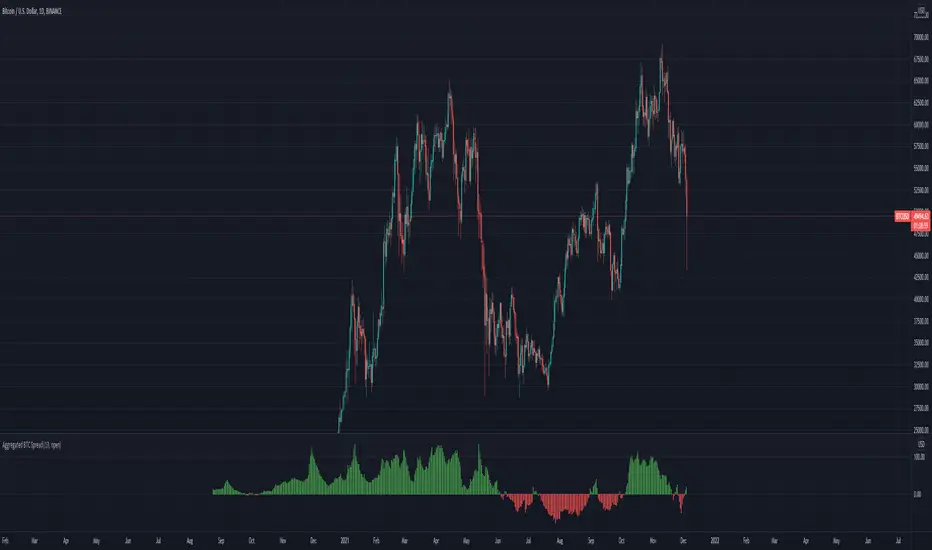
Aggregated BTC SpreadThis script is used to aggregate the bitcoin spread on futures contracts on different platforms.
It works by averaging the for every selected exchange, and apply an EMA of .
It is supporting
Binance (USD / USDT)
Okex
FTX
Huobi
Deribit
Ascendex
CME (BTC1!)
Futures
Stochastic DotsThese Stochastic Dots can help show potential turning points and cycles in the market.
- The smaller dots are based off of a faster moving stochastic
- The bigger dots are based off of a longer moving stochastic
- Dots below the candle/bar are bullish
- Dots above the candle/bar are bearish
This indicator is not meant to be traded by itself. Use other forms of confluency and confirmation with it.
If you're interested in more customized indicators to suit your needs, feel free to message me.
Confluence CandlesThis indicator looks for confluence among three indicators (RSI, Stochastic, and MACD), a strategy popularized by Markus Heitkoetter in his book, “The PowerX Strategy: How to Trade Stocks and Options in Only 15 Minutes a Day”, and expands it to look for agreement on up to four symbols.
Each indicator is configurable in the settings, as well as the ability to choose which of the indicators are used.
Default Logic
Green Candles
RSI > 50
Stochastic > 50
MACD Histogram > 0
Red Candles
RSI < 50
Stochastic < 50
MACD Histogram < 0
When multiple symbols are selected, the above needs to be true for all selected symbols.
Example Use Cases
- Setting the indicator to the Nasdaq 100 (QQQ or NQ1!) while trading a stock that is part of that index such as AAPL or TSLA
- Setting the indicator to multiple indexes that tend to move together in order to trade one of them since they tend to make stronger moves when moving together (ex. SPY & QQQ, or ES1! & NQ1!)
- Setting the indicator to Bitcoin while trading a smaller crypto pair that moves as a sympathy play.
Tip
If you have trouble finding the full name for a specific instrument from an exchange such as BTCUSD from Coinbase, you can bring up TradingView’s “Symbol Search” pop-up modal, enter your search term, use the down arrow key on your keyboard to move the focus to the symbol you want, and you will see the full name in the search field such as “COINBASE:BTCUSD”.

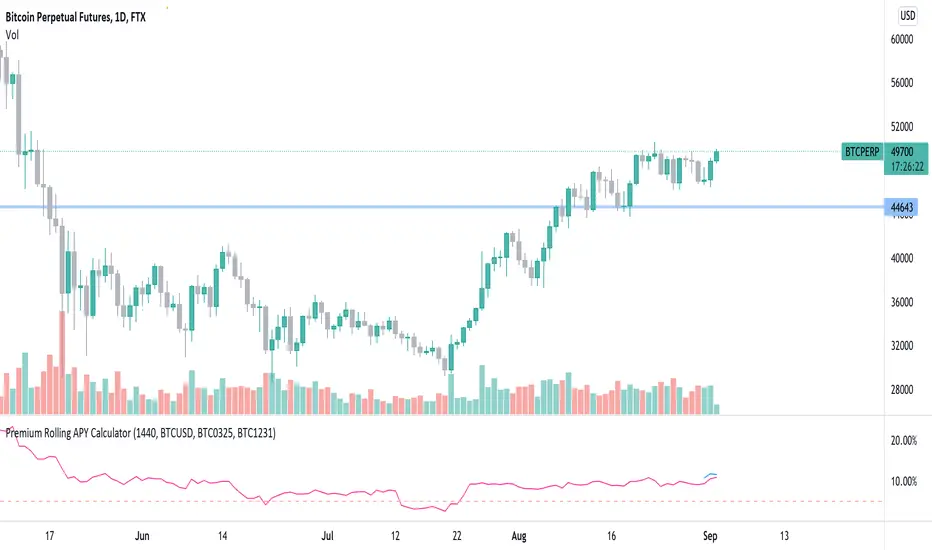
Premium Rolling APY CalculatorThis script can see the rolling APY of future premiums calculated based on the remain days to expire date.
By default you can see the rolling APY for FTX BTC0924, and APY for BTC1231. You can also change the symbol from chart settings to whatever you need and still calculate in the same way.
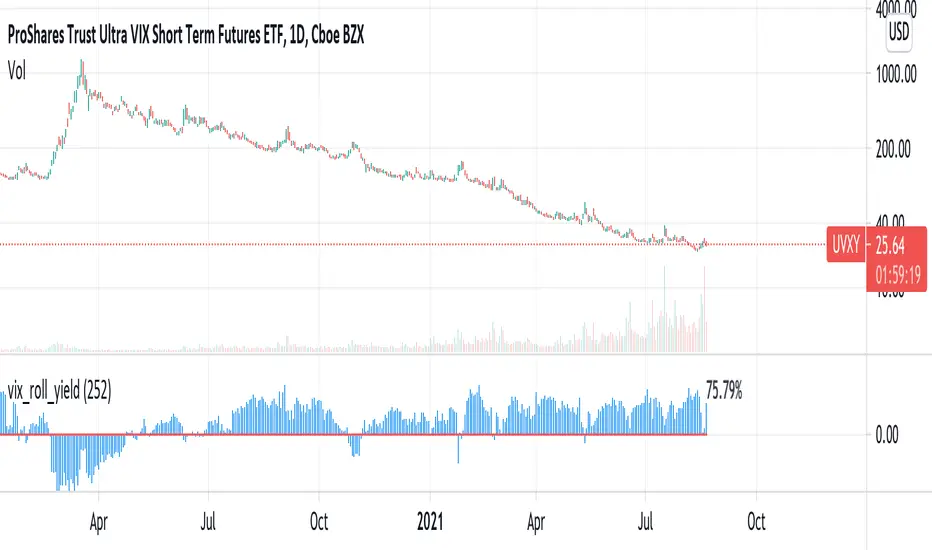
vix_roll_yieldShows the roll yield of the VX futures, which is the ratio of a continuously weighted average of the front two months to the VIX. The VX (VIX futures) contract expires on the third Tuesday of each month. On the next trading day, the front month will have full weighting, and the second month will have no weight. On the expiration day, the back month will have full weighting and the front month will have no weight. In between, the weight gradually shifts.
This weighted average is similar to the SPVIXSTR index that UVXY and several other funds track. When the average is below the VIX, the indicator is negative, and the front month contract will tend to gain value relatively more rapidly than the back month as it converges upward to the VIX spot price. Because funds whose NAV is tied up in VX contracts continuously roll from the (typically cheaper) front month to the back, in situations where the front month is more expensive than usual--or even more expensive than the back month--these products may have a "tailwind". In this case, they are selling expensive front month contracts to purchase cheap back month contracts.
Ordinarily, VIX funds have a "headwind." The roll yield is positive, the front month is cheap, and the back month is expensive. Day by day the funds sell cheap front month contracts and buy expensive back month contracts, which, in turn and over time, become the front month and converge with the VIX, losing value rapidly. This is a brief explanation about the decay of these products.
RaBot V1.0.0Rabot is an indicator for new users as well as experienced users.
This indicator tries to predict both buy and sell signals. You can configure it for both scalping and swing trading.
It has two modes, one more "conservative", where the number of entries will be less than the other "greedy" mode.
Based on the famous and complex indicator "Koncorde" that combines both trend and volume knowing the manipulation of strong and weak hands, patterns, and crossing of emas customized by us; for example: a buy signal in conservative mode will only open if the trend is bullish and vice versa.
The user can configure the way they like by opening many positions or few but more secure based on their trading style.
The indicator also has the option to configure which chart we want to obtain the trend from, this is to avoid perhaps opening shorts in a very bullish trend line for example.
Rabot is a fairly complex indicator, which can be used for automatic use of inputs and outputs, as well as manual.
You also have the option of NOT opening a position if there is one currently open, and the option for the next signal to be the opposite of the last one.
5TPs, 1SL, and Breakeven after take profit achieved.
Finally version 1.0.0 is now available! :)
This version does not have backtesting (we have another that yes)
We are continuously working, testing and updating bugs and improvements.
Do not hesitate to get in touch for a feedback, it will be welcome and we will take it into account.

RaBot V1.0.0 - BacktestingRabot is an indicator for new users as well as experienced users.
This indicator tries to predict both buy and sell signals. You can configure it for both scalping and swing trading.
It has two modes, one more "conservative", where the number of entries will be less than the other "greedy" mode.
Based on the famous and complex indicator "Koncorde" that combines both trend and volume knowing the manipulation of strong and weak hands, patterns, and crossing of emas customized by us; for example: a buy signal in conservative mode will only open if the trend is bullish and vice versa.
The user can configure the way they like by opening many positions or few but more secure based on their trading style.
The indicator also has the option to configure which chart we want to obtain the trend from, this is to avoid perhaps opening shorts in a very bullish trend line for example.
Rabot is a fairly complex indicator, which can be used for automatic use of inputs and outputs, as well as manual.
You also have the option of NOT opening a position if there is one currently open, and the option for the next signal to be the opposite of the last one.
5TPs, 1SL, and Breakeven after take profit achieved.
Finally version 1.0.0 is now available! :)
This version contains backtesting with 5000 backbars to see if it is being profitable or not.
We are continuously working, testing and updating bugs and improvements.
Do not hesitate to get in touch for a feedback, it will be welcome and we will take it into account.

Trend Momentum with Buyers / Sellers PowerHi there!
With this indicator, you can hunt big trends before they start.
This indicator is combined with RSI and Momentum indicators
It can show you the power of trend and which side it wants to go
It can help you to open a position at the first point of a new trend or at the safe and proven point of the trend, also it can help you to close your position before the trend change its direction (it's not recommended to use it to close your positon, but sometimes it can help you to find the ending point of big pumps)
Rules:
* Baseline is ZERO ( 0 ) line
* When gray line crossover red line, it shows us a powerful uptrend
* When the gray line crossunder the red line it shows us a powerful upward trend
Signals:
* Only use Buy signals(Long) when they are above or crossing-up baseline
* Only use Sell signals(Short) when they are under or crossing-down baseline
* If they both (red and gray lines) are too high and they suddenly starting to come back to baseline, it shows we have a range trend, the trend is weak or a reversal trend is coming!!
!! WARNING: DO NOT USE THIS INDICATOR ALONE !!
Suggestions :
-Use 1H, 4H, daily, or Weekly timeframes
-Use ADX and DI or three WMA's
-Use divergence
-You can use it for scalping but you need to change the inputs (not recommended)
If you have any idea about making new indicators(what information do you want from the chart?), comment please, then I can research and make it for all of us! =)

MYX Malaysia Bursa Futures Derivatives Auto DetectThis indicator intended for Malaysia Market only for auto detect Futures Market Derivatives refer to Bursa Malaysia
Indikator ini adalah untuk pasaran Malaysia sahaja untuk automatik mengenalpasti Derivatif Pasaran Hadapan rujuk kepada Bursa Malaysia
Indicator features :
1. Able to detect futures market.
2. List similar symbol or counter including total.
3. Font size small for mobile app and font size normal for desktop.
4. Show date updated by Bursa Malaysia.
Kemampuan indikator :
1. Boleh mengenal pasti pasaran hadapan.
2. Senarai simbol atau kaunter yang terlibat termasuk jumlah.
3. Saiz font kecil untuk mobile app dan saiz size normal untuk desktop.
4. Memaparkan tarikh kemaskini oleh Bursa Malaysia.
FAQ
1. Credits / Kredit
LucF & PineCoders
2. Code Usage / Penggunaan Kod
Free to use for personal usage.
Bebas untuk kegunaan peribadi.
3. Why table overlap with chart ? To avoid this, click indicator > Visual Order > Send to Front.
Kenapa table bertindih dengan carta ? Untuk mengatasi ini, klik indikator > Visual Order > Send to Front.
4. Some symbols not display such as Commodities Derivatives (OCPO and OPOL) and Equity Derivatives (OKLI).
These symbol are offcially displayed at Bursa Malaysia but not available in Trading View under prefix MYX.
And also Futures Market are not available in Trading View.
Beberapa simbol tidak dapat dipaparkan Derivatif Komoditi (OCPO and OPOL) and Derivatif Equiti (OKLI).
Simbol berikut dipaparkan secara rasmi di Bursa Malaysia tetapi tiada di Trading View di bawah prefix MYX.
Dan Pasaran Hadapan juga tiada di Stock Screener.
All Setting enabled.
Semua seting diaktifkan.
Example of recommended usage.
Contoh penggunaan yang disarankan.
Example of other derivatives. Similar derivatives can be shown.
Contoh derivatif lain. Derivatif yang sama boleh dipaparkan

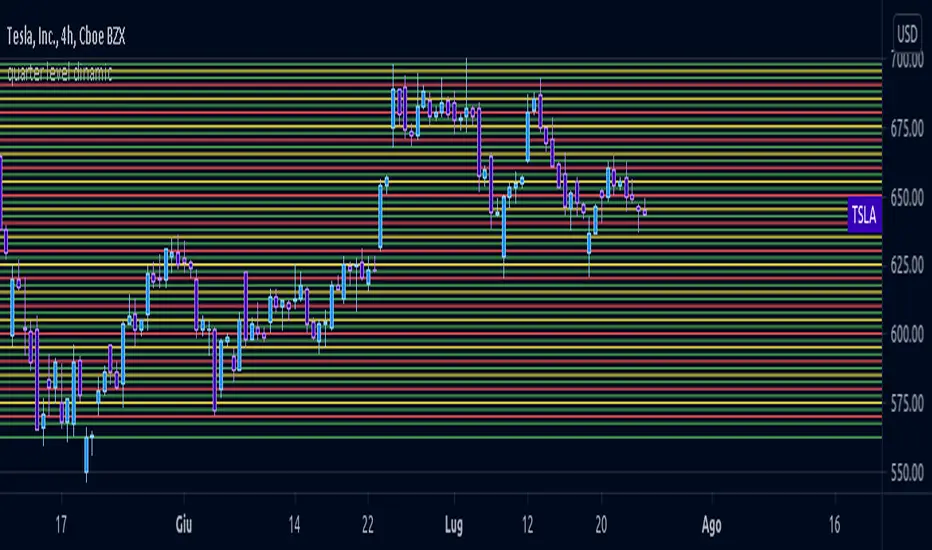
quarter level dinamicLimited quarter level script but more flexible in compared to my FX script, same logic behind
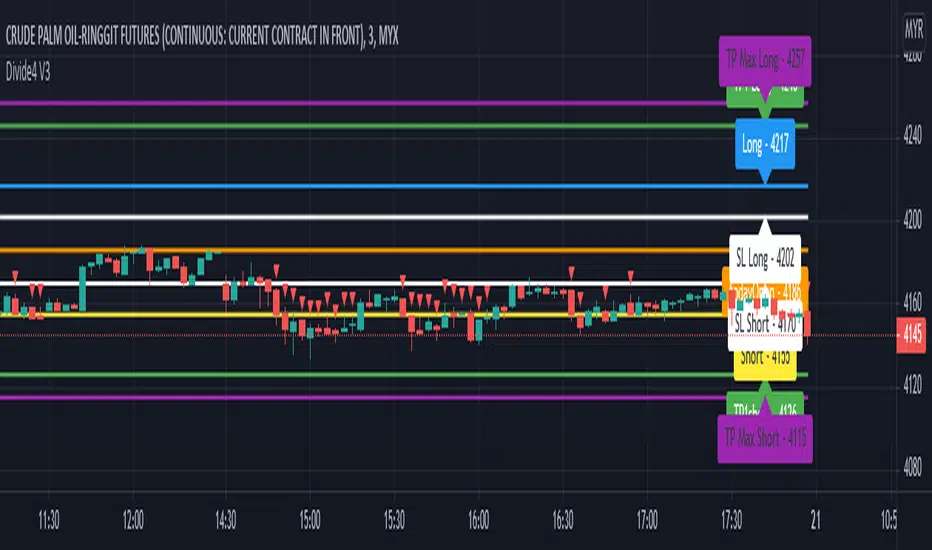
Divide4 V3This script is specially developed for the reference of Crude Palm Oil Futures (CPO) market traders.
Before using this script, traders need to know a few important things, namely:
1. Use of this script is limited to the Crude Palm Oil Futures (CPO) market only;
2. The appropriate time-frame for the purpose of using this script is a small time-frame, i.e. 1 minute to 5 minutes;
Procedures for using indicators.
1. Once the market opens, change the time-frame to 1 minute;
2. The line on the trading day will only be known after the first candle is completed, i.e. at 10.31 am;
3. Then, you can key in order if you want;
4. Let the 1 minute time-frame remain until 11 a.m. Then, you can change a larger time-frame such as 3 minutes or 5 minutes if desired.
Entry.
1. The recommended Max Entry is once Long and once Short only on the same day;
2. If the first Entry reaches Profit Target, it is not recommended to make an Entry for the second time;
3. If the first Entry is about Stop Loss, the second Entry is recommended as opposed to the first Entry.
For example, if the first Entry is Long, but does not reach Profit Target, otherwise it is about Stop Loss, then the recommended second Entry is Short, even though the price is about Entry for Long.
Long.
1. Traders can only make a purchase when the market price hits the blue line;
2. If traders hold a long position, traders can make a sale to close the long position when the price hits the green or purple line closest to the blue line;
3. On the other hand, if the price goes down again after a buy is made, traders need to make a sale to close the buy position when the price goes down to hit the white line closest to the blue line.
Short.
1. Traders can only make a sale when the market price hits the yellow line;
2. If traders hold a short position, traders can make a purchase to close the short position when the price hits the green or purple line closest to the yellow line;
3. On the other hand, if the price rises again after the sale is made, then traders need to make a purchase to close the selling position when the rising price hits the white line closest to the yellow line.
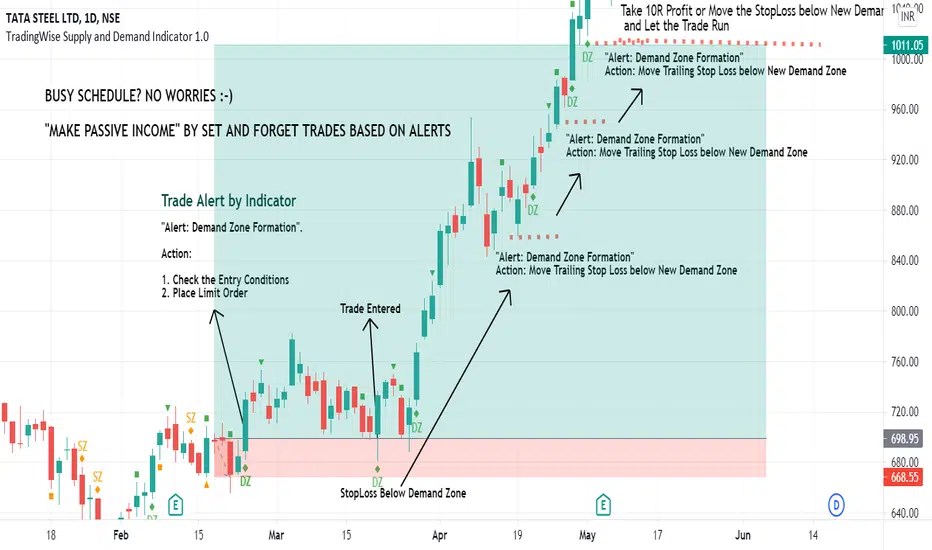
TradingWise Supply and Demand Indicator 1.0TradingWise Supply and Demand Indicator 1.0 is based on the Price Action candlestick patterns to identify the Supply and Demand zones in the charts (Areas of liquidity). It works on all Timeframes and Asset Classes. This Script helps the traders to identify the demand and supply zones with identifications on the candle stick patterns indicating the origin of the Strong move. Also it generates Alerts automatically once the supply or demand area is formed thus by reducing the hours spent on the charts and reducing the missed trade Opportunities as well. This Indicator is extremely helpful for those on Full time Jobs/ Busy Schedule.
Buy/Sell Alerts by Indicator:
Green Diamond + DZ Sign ---> Indicates the Demand Zone Formation. Place Buy Trade upon Entry Criteria Met
Orange Diamond + SZ Sign ---> Indicates the Supply Zone Formation. Place Sell Trade upon Entry Criteria Met
Binance Futures BasisCONCEPT
The futures basis for multiple coins based on the Binance coin margin quarterly futures contracts.
If you need a run down of what the futures basis is, check out this short educational post (click on the chart):
In short: the futures basis is the premium at which futures contracts are trading compared to the spot market.
FEATURES
Futures basis for the following coins:
BTC
ETH
LTC
BNB
ADA
DOT
BCH
LINK
There's also an average futures basis which is an average premium of all the coins I just listed.
As you can see there's also a zero line which you can turn on in the settings.
This is quite useful for when the futures start trading in or close to backwardation.
It's possible to show all the premiums at the same time.
This makes it easy to look for outliers.
You can choose the candle source too.
By default it's set on "close" which probably makes the most sense.
All data will be based on candle closes.
However if you're looking at higher timeframes sometimes crucial info is lost when you keep it on "close".
As you can see in this BTC futures basis example with "close" as a candle source you don't seen anything peculiar even though there were two violent liquidation cascades that temporarily had a huge impact on the futures basis.
If you then select "ohlc4" for example which uses an average value of each candle you can clearly see the impact that those drops had.
Basically when you're looking at most recent data I prefer candle close, but when looking at higher timeframes for historic data the ohlc4 option is more useful.
At the time of publishing this indicator it's using the September quarterly futures contracts (which is the closest expiration).
I'll update this every time the expiration happens.
However, in the settings you'll find the code for these futures contracts.
If you want to take a look at the next expiration for example, which is December right now, you can just fill in the Binance code of those contracts and it'll re-calculate everything and print the futures basis for the December futures.
This way you can also update the indicator yourself each time contracts expire (to make sure the indicator keeps working just in case I were to disappear or something).
The code for the current (September) contracts is U2021.
The code for the next expiration (December) is Z2021.
This will become out dated of course.
TRADING
You can find more info on how it's useful for trading in the educational post I linked.
Some short notes...
This premium works very similar to the perpetuals basis or funding.
Simply put a high premium could be a sign that the market is overbought and a very low premium could be a sign that the market is oversold.
Backwardation (below 0) is very rare and usually only happens after a violent crash. Historically those are good buying opportunities.
Divergences also often work really well.
If you want access send me a private message so we can discuss it.
Cheers.

Aggregated Futures BasisCONCEPT
An indicator that shows you the futures basis, which is the premium that classic futures contracts are trading at compared to the spot market.
By default its settings are for bitcoin quarterly contracts (closest expiration date), although there's a lot of customizing possible.
You could also use this indicator for other coins but then you'll have to change the inputs.
I'll manually update the contracts when they get close to expiration, but you could do this yourself as well (just in case I disappear for some reason and don't update it anymore).
For more info on what the futures basis is exactly check out this short educational post (click chart):
FEATURES
As previously mentioned, the default settings are for bitcoin.
The index used is the Bitmex BXBT index. It's a dynamic and volume weighted spot index which is perfect to get an average price of the spot market.
If you want to look at the ethereum futures basis for example then I suggest using the BETH Bitmex index, same concept as the BXBT chart but for ETH.
The futures used are quarterly contracts of the most prominent exchanges in crypto.
There's also an option to add an average plot (or only show the average: use the selection box) which calculates the average premium of all the futures contracts selected (you can also choose to exclude certain contracts).
The standard settings show you the premium in percentage terms, but there's also an options to show the annualized premium.
If I don't update the indicator when the contracts expire you'll have to fill in the tickers of the next quarterlies and you'll also have to change the expiration date to make sure this annualized premium still works.
There's a "zero line" you can add which is useful for when the futures get close to backwardation.
And you can set up bullish and bearish signals of your choosing. By default it shows a bull signal when the premium goes below zero and a bear signal when the premium goes above 10 (if you put it on annualized you'll want to change this threshold).
TRADING
The futures basis can be very useful to gauge market sentiment.
It can give you a better idea of how aggressive market participants are by looking at how much the futures are going up or down relatively to spot.
Divergences also often have an impact.
If you want access to this indicator send me a private message so we can discuss it.
Cheers.

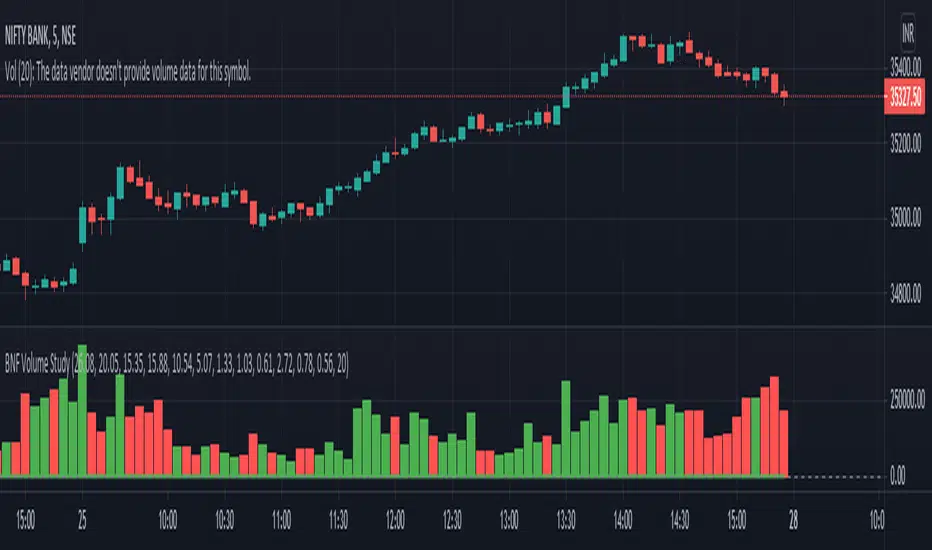
Trade Vertex - Bank Nifty Volume IndicatorNSE:BANKNIFTY
We all know that the value of an Bank Nifty is derived from top banking sector underlying stocks.
The value of Bank Nifty is calculated from free float market capitalization.
Using the same formula, I made an indicator on the bases of weighted volume of each stock.
This indicator will help you to plot Volume on Bank Nifty.
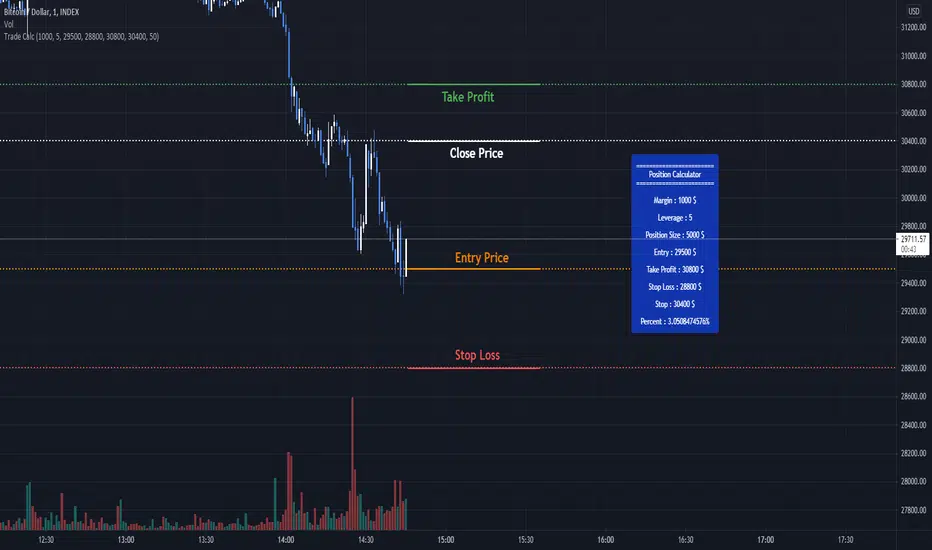
Trade Calculator by RealmixA clean Trade Calculator for any Asset, which calculates everything you need to know.
This script is a modified version of the Position Calculator by Mysteriown. Link:
I try to make it a bit better for Futures Trading.
Target Price for KuCoin FuturesWhen trading on KuCoin, it can be difficult to determine what you're exit price should be.
This script solves this issue by giving you an exit price based on a given entry price, a base margin, and a target profit %.
USE CASES:
No Entry Price:
If you have no position in KuCoin, then this use case could be more helpful. With no entry price inputted, two lines will be drawn above and below the current closing price.
The blue line represents your exit price for if you were to enter into a long at the current close.
The orange line represents your exit price if you were to enter into a short at the current close.
With Entry Price:
If you're already in a position in KuCoin, then this case might be more helpful.
The green line represents your exit price for a long from your entry price
The red line represents your exit price for a short from your entry price
The yellow line represents your entry price itself.

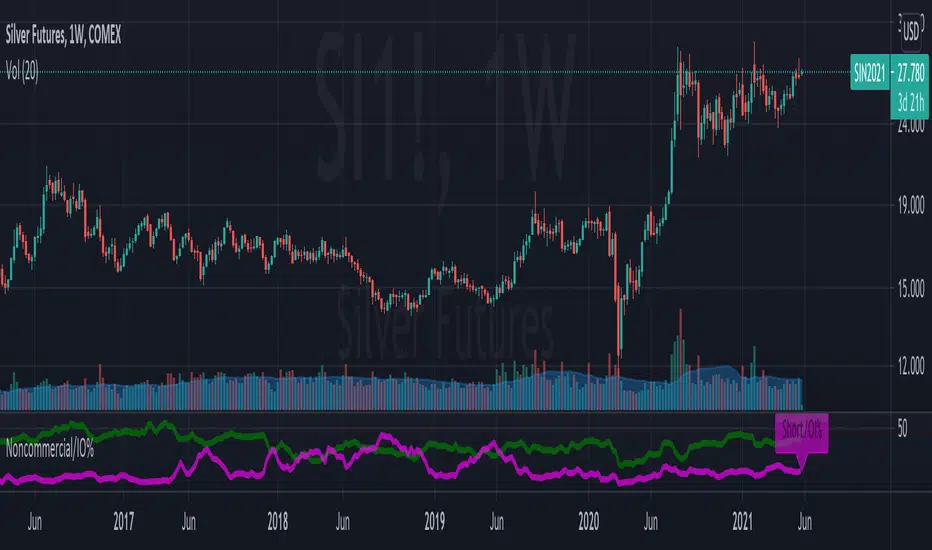
Noncommercial long futures position to overall Open InterestThis is an indicator that gets data from Quandl and presents weekly CFTC futures data (www.cftc.gov). In this indicator, the noncommercial long/short positions are calculated as a percentage of overall Open Interest. This indicates the bullish/bearish sentiment of the market.
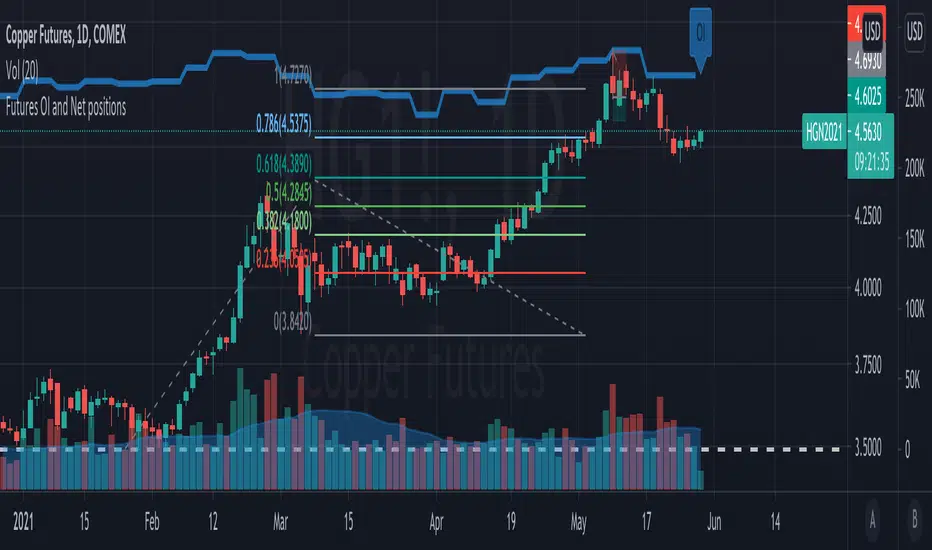
Futures OI and Net positionsThis is an indicator that gets data from Quandl and presents weekly CFTC futures data (www.cftc.gov). In this indicator, Open Interest (OI) and net noncommercial positions are presented. Net_noncommercial positions are calculated as noncommercial_long - noncommercial_short.
(D7R) FTX Ethereum FuturesEthereum FTX Contract Futures Price with 3 different value display modes. (Percentage, Delta, Absolute).
This information can be used to understand when futures are trading at relative strong/weak premium or discount against each other.
This information can either be used for cash-n-carry arbitrage, inter-exchange arbitrage, hedging or directional price speculation.
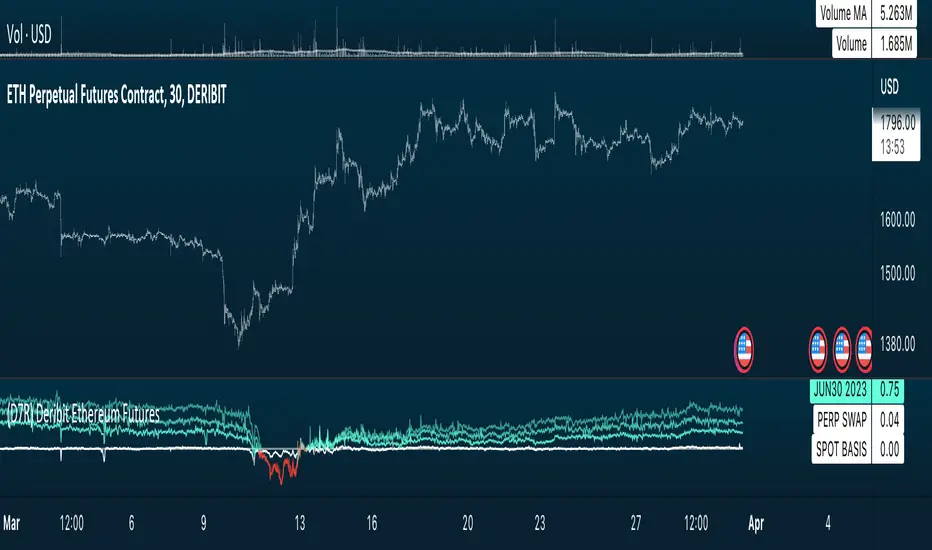
(D7R) Deribit Ethereum FuturesEthereum Deribit Contract Futures Price with 3 different value display modes. (Percentage, Delta, Absolute).
This information can be used to understand when futures are trading at relative strong/weak premium or discount against each other.
This information can either be used for cash-n-carry arbitrage, inter-exchange arbitrage, hedging or directional price speculation.

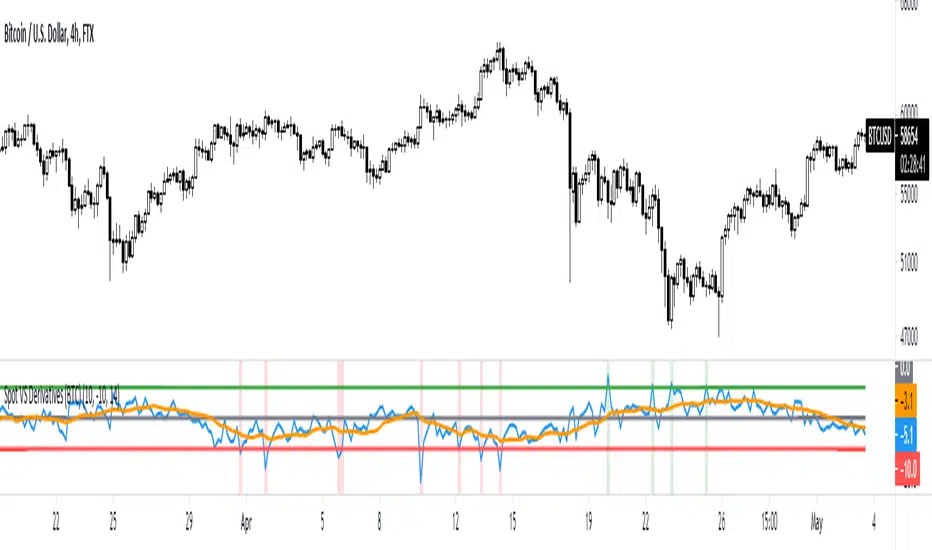
Spot VS Derivatives (BTC)This indicator shows you the difference between the price on the spot exchanges and the derivatives exchanges. When the ratio spikes upward, it is a good buying opportunity, and when it spikes downward, it is a good moment to sell. The best timeframe for this indicator is 4h. The calculation includes top 10 spot and derivatives exchanges by volume .
FTX Futures Premium %Charts the Futures Premium % for FTX futures markets
Change the asset name from BTC to ETH in settings to switch assets, and will work with all assets with long-dated futures markets on FTX as they are added
