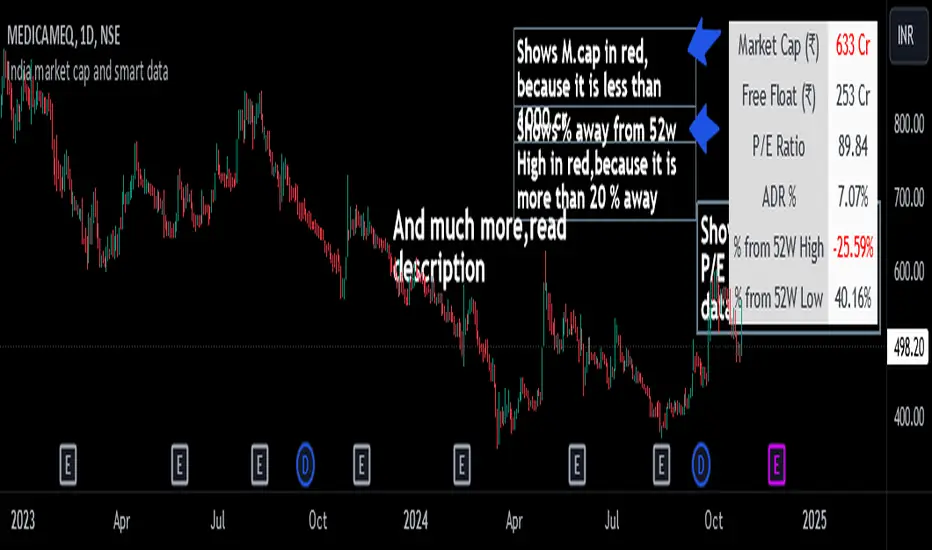
India market cap and smart dataThis indicator displays important financial and technical data, such as Market Cap, P/E Ratio, ADR %, etc.
It is specially designed for swing traders.
Key Features and Highlights
- Market Cap Alert: If the Market Cap of a stock is below 1000 crore , it is displayed in red to indicate a potential liquidity issue.
- P/E Ratio for Loss-Making Companies : For companies with net losses, the P/E ratio is shown as 0 and displayed in red , alerting you to the unprofitable status of the company.
- ADR Alert: When the ADR is below 4% , it is highlighted in red . Swing traders typically look for stocks with high ADR.
- 52-Week High Proximity: If a stock is more than 20% below its 52-week high , this data is shown in red .
- 52-Week Low Performance: If a stock is up by more than 70% from its 52-week low , the data is displayed in green , indicating strong performance.
Additional Features
- Toggle data points on or off as desired.
- Supports both dark and light modes.
- Position the table wherever preferred on the chart.
- Customize the ADR % calculation based on the desired number of days (default is 20 days).
Note: The calculation for the percentage away from the 52-week high is based on the closing price of the 52-week high candle, not the high price.
Indicador Pine Script®