Forex

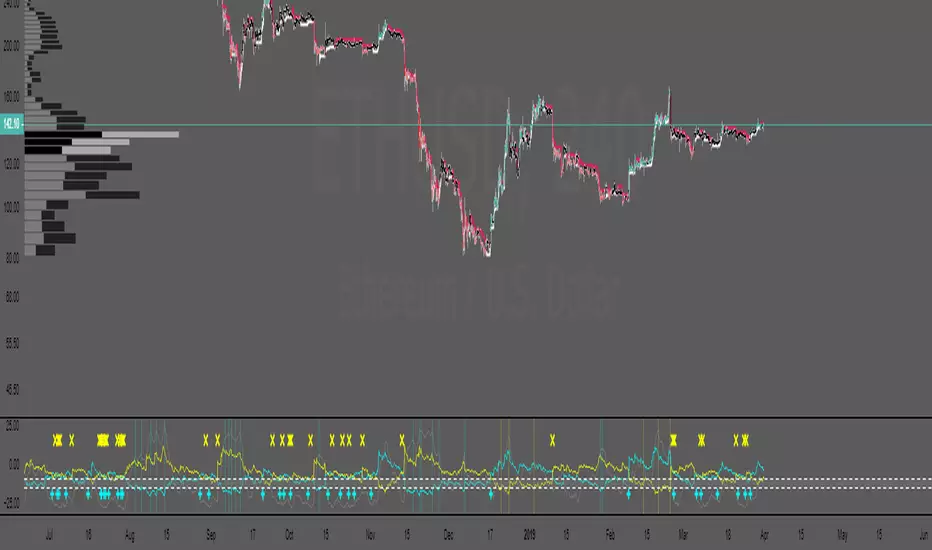
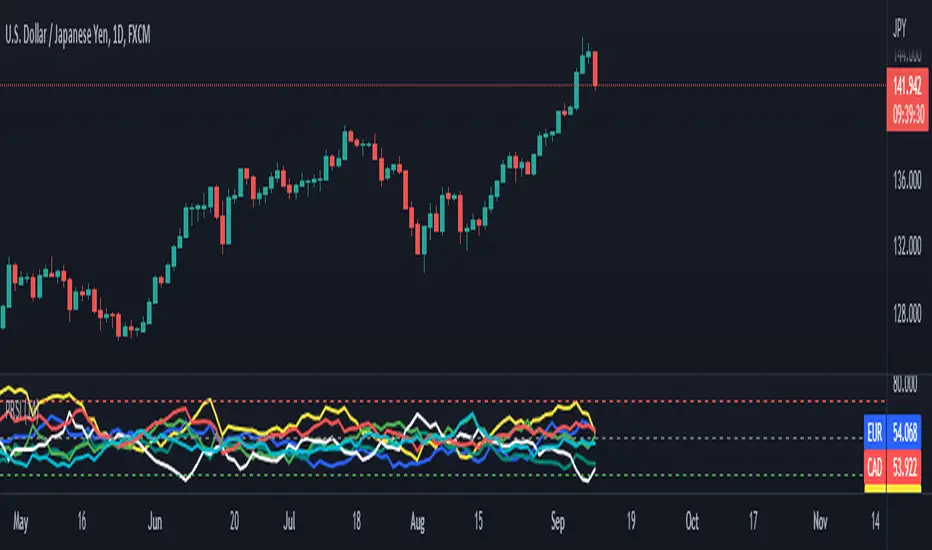
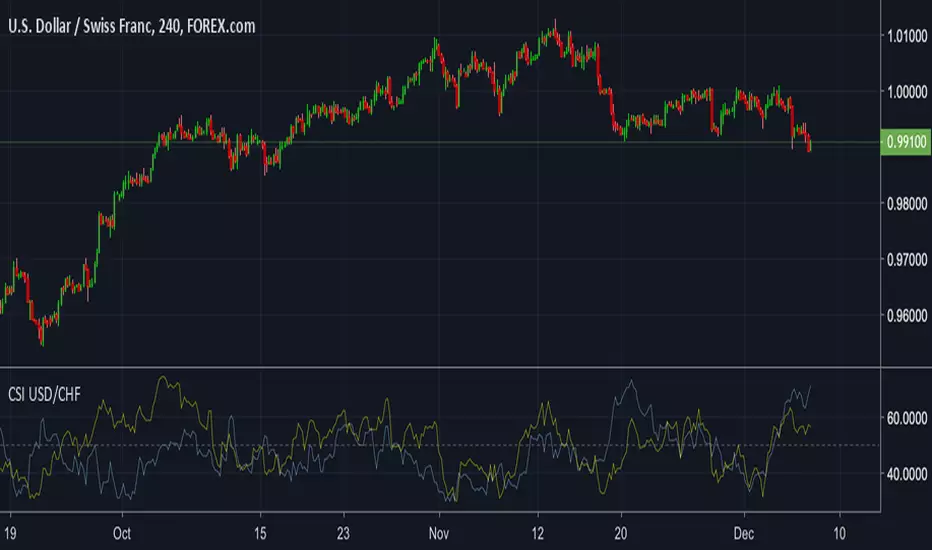
pooya AVG RSIThis is an RSI range for the most popular index in FOREX:
EUR
USD
GBP
JPY
AUD
CAD
CHF
NZD
comment your opinion
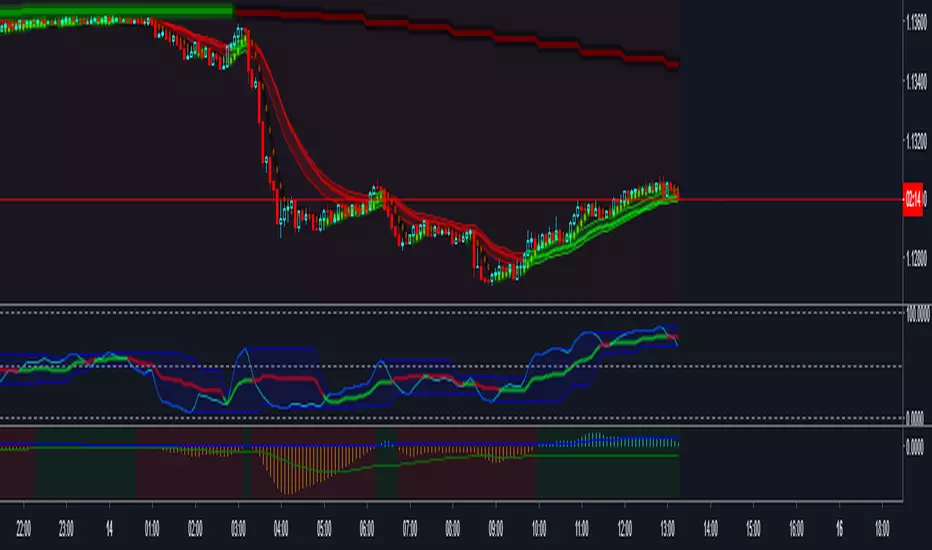
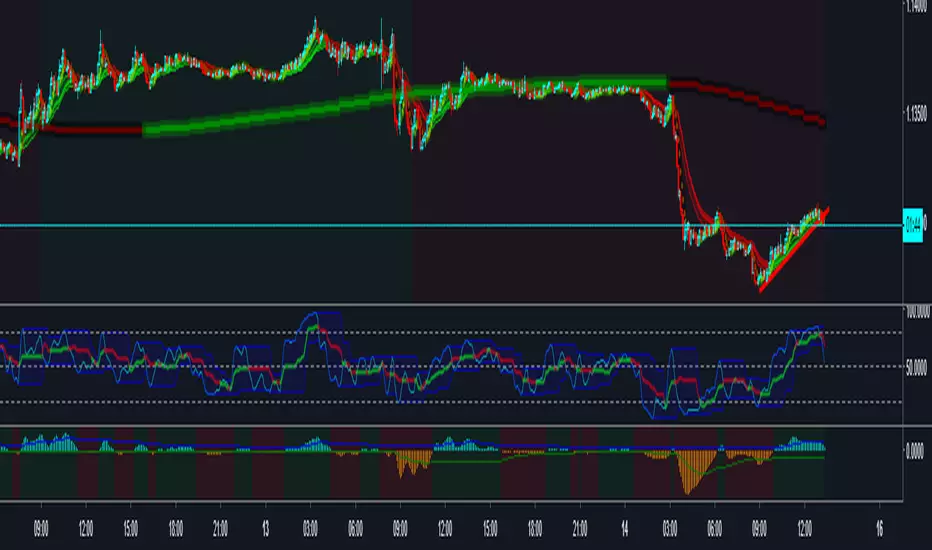
Prometheus Scalping vs. Swinging by ZekisIt's been a while since i did not post a script, so here it is...
I found some simple indicators,put them together and saw some nice results.
There is an indicator for scalping, swinging and for exit.
With the right setup it can be very useful, so you can play with it to find what you need
It works in any timeframe in any market, just change values (default ones are good for 1H or more), all you need is volatility... (this is what you need in any market!)
Also you can enable or disable background and bar colors
Enjoy!
@Zekis

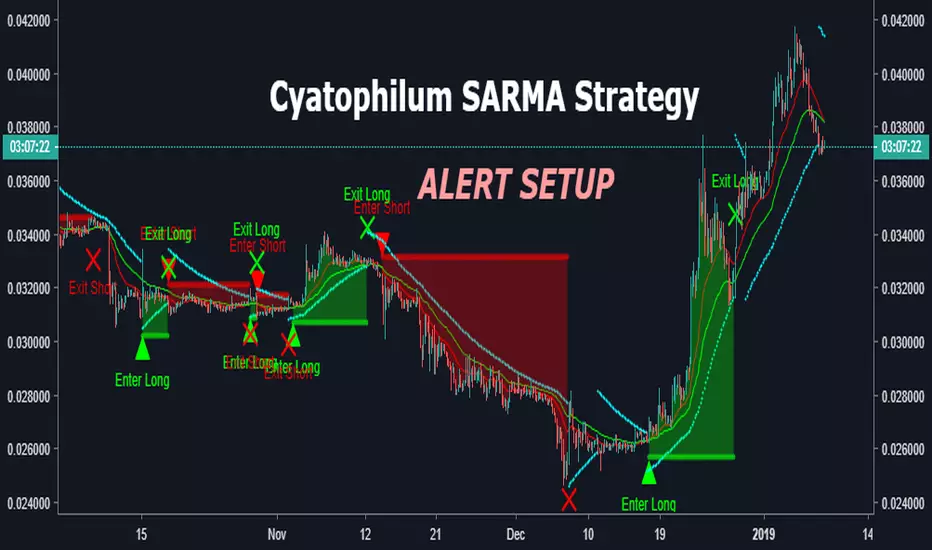
Cyatophilum SAR-MA Strategy [ALERT SETUP]An Automated Strategy based on Parabolic SAR and EMAs, also called the SARMA Strategy. Works on any timeframe and market.
Read More
This indicator will trigger long/short signals entries and exits. Excellent for manual or bot trading!
It has a stop loss system that you can activate to reduce risk.
Note: If a stop loss is reached, an exit alert is triggered.
This is the Alert Setup version. That means it is used to create automatic email or SMS alerts.
It has a Backtest version that you can use to find the best configuration. I will also be there to help you on my Discord channel .
Sample Use cases
Get the indicator today!
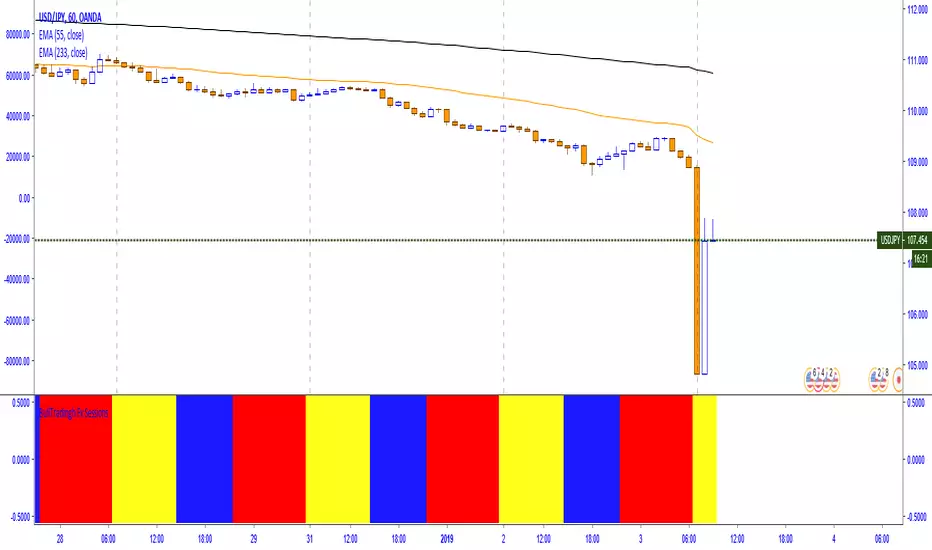
Colored Volume Bars All Markets: Combining Volume SourcesUsing volume in Forex is potentially misleading as we are only provided the broker volume or futures exchange volume for the currency or commodity in a decentralised market. This code combines the volumes from FXCM, Onanda and futures for the instrument being studied. The combination of the volumes could improve the reliability of the volume being considered. Using this approach other volume indicators can also be improved.

CRYPTONYY TRADING MACHINEThia script will automatically gives you long and short signals.
WORKS ON ALL EXCHANGE.
SUITABLE FOR BITMEX TRADING.
FOR ALTCOINS TRADING GO FOR 30MIN OR ABOVE 30MIN TIMEFRAME.
AUTOMATIC STOP LOSS TRIGGER.
MORE NEW UPDATES COMING!!!

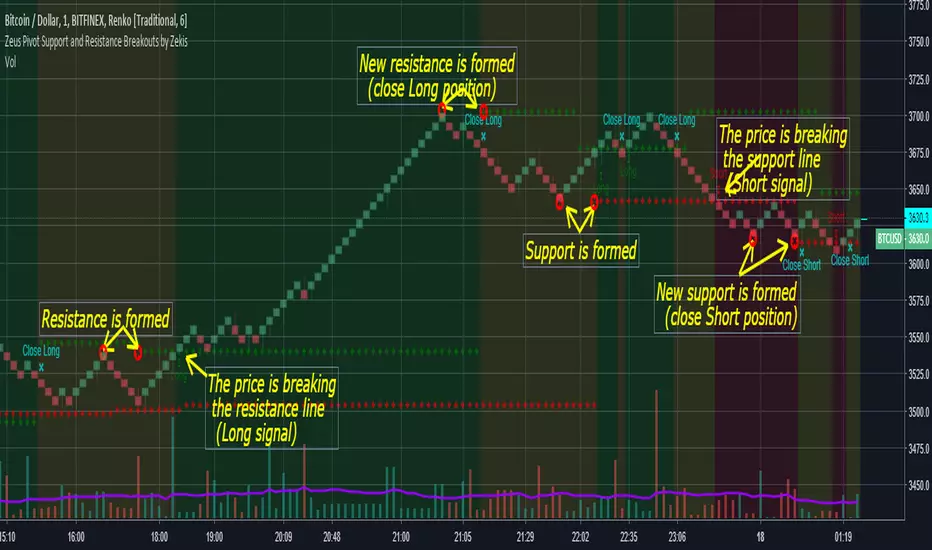
Zeus Pivot Points Support and Resistance Breakouts by ZekisZeus Pivot Support and Resistance Breakouts by Zekis
Is an indicator with big results, it forms new support /resistance according to the last higher high or lower low (it prints new ones only if it breaks through the last one)
Rules:
- enter Long or Short when the support or resistance is craked
- exit when new support or resistance is starts to form
Alerts for entries and exits
A moving average is added to filter signals (leave it at 1 for price close signals)
Bar colors can be added to see longs, shorts or no position
Background colors for longs, shorts or no position
Enjoy!
@Zekis
SeerFirst, we cheat, then, we go broke. Maybe.
Seer is a private technical indicator based on volatility, trend analysis, volume, flow and reversion. It is incredibly accurate across every asset class, including: futures, indexes, individual equities, commodities, forex and crypto. It can be used on every timeframe, from the 1m for fast, high strike rate scalps, to the daily or weekly for longer-term positions. Due to it's insane strike rate it will not be made public (examples below). If you are a billion-dollar hedge fund I may consider selling the indicator, otherwise the expected value from selling it is less than the edge I would give up by sharing it. If you have a counter-offer feel free to send me a message.

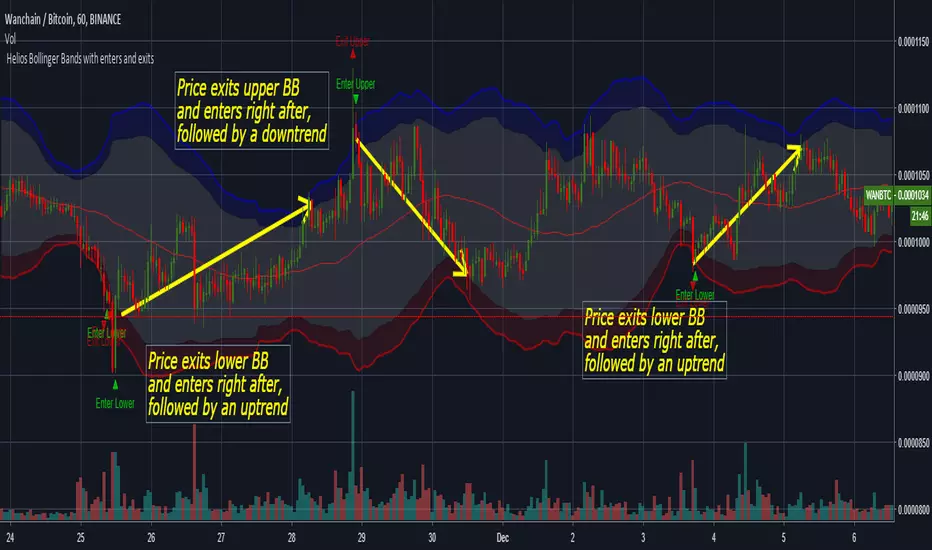
Helios Bollinger Bands with enters and exits by ZekisClassic Bollinger Bands with enters and exits from the channel
The purpose of Bollinger Bands is to provide a relative definition of high and low prices of a market. By definition, prices are high at the upper band and low at the lower band. This definition can aid in rigorous pattern recognition and is useful in comparing price action to the action of indicators to arrive at systematic trading decisions
The use of Bollinger Bands varies widely among traders. Some traders buy when price touches the lower Bollinger Band and exit when price touches the moving average in the center of the bands. Other traders buy when price breaks above the upper Bollinger Band or sell when price falls below the lower Bollinger Band . Moreover, the use of Bollinger Bands is not confined to stock traders; options traders, most notably implied volatility traders, often sell options when Bollinger Bands are historically far apart or buy options when the Bollinger Bands are historically close together, in both instances, expecting volatility to revert towards the average historical volatility level for the stock.
When the bands lie close together, a period of low volatility is indicated. Conversely, as the bands expand, an increase in price action/market volatility is indicated. When the bands have only a slight slope and track approximately parallel for an extended time, the price will generally be found to oscillate between the bands as though in a channel.
Traders are often inclined to use Bollinger Bands with other indicators to confirm price action. In particular, the use of oscillator-like Bollinger Bands will often be coupled with a non-oscillator indicator-like chart patterns or a trendline . If these indicators confirm the recommendation of the Bollinger Bands , the trader will have greater conviction that the bands are predicting correct price action in relation to market volatility .
en.wikipedia.org
Enjoy!
@Zekis
trend lines (lirshah)triangle pattern created for our subscribers for better indication of chart patterns.
i hope enjoy that.

Sheavy XXX
USE INDICATOR WITH YOUR OWN RISK
ANY OR ALL LOSSES/WINS WILL NOT BE HELD RESPONSIBLE BY THE CREATOR OF THIS SCRIPT.
SHEAVY will give white for LONG entries and DEEP red for SHORT
--------------------------------------------------------------------------------
WHITE SHEAVY signal + DEEP RED candles = MED-HIGH risk LONG entry
WHITE SHEAVY signal + BRIGHT RED candles = MED risk LONG entry
WHITE SHEAVY signal + WHITE candles = LOW risk LONG entry
DEEP RED SHEAVY + DARK GREEN = HIGH risk short
DEEP RED SHEAVY + BRIGHT GREEN = MED RISK SHORT
DEEP RED SHEAVY + DEEP RED = LOW risk short
----------------------------------------------------------------------------------
RSI Candles V5 : RSI period (14)
LIME GREEN = very over bought +85
DARK GREEN = overbought +65
DARK RED = oversold -40
BRIGHT RED = very oversold -15
New parameters in order to enter trade based on PA and volume
cross over technique may be applied after the long / short call using the Gaussin MA
if Long call and gaussin goes over PA you may exit until gaussin is under PA
vice versa


RSI KILLER John Ehlers
Smoothing indicators usually means making a tradeoff between the amount of smoothing you desire and the amount of lag you can stand. It turns out that the RSI can be smoothed and enhanced with minimum lag penalty


NAVI'S PERFECT TSIThe NAVI'S PERFECT TSI Indicator is the same as the True Strength Index (TSI) developed by
NAVI, except the SMI includes a signal line. The SMI uses double moving averages
of price minus previous price over 2 time frames. The signal line, which is an EMA of the
SMI, is plotted to help trigger trading signals. Adjustable guides are also given to fine
tune these signals. The user may change the input (close), method (EMA), period lengths
and guide values.
You can use in the xPrice any series: Open, High, Low, Close, HL2, HLC3, OHLC4 and ect...

ZR1DMI/ADX
blue is Bull momentum
yellow is Bear momentum
gray line is trending line
dotted is TREND LINE
idea:
look for two lines to be above the dotted TREND LINE
bullish = Bull momentum + Trending Line
bearish = Bear Momentum + Trending Line
when all three are converged or when Tending Line is below dotted its CHOP
Blue flashes when BULL momentum is growing
Yellow flashes when BEAR momentum is growing
NOTE: FOR PA TO MOVE WE DONT ALWAYS NEED 2 LINES ABOVE 1 BELOW
a secondary trade idea is simply on cross over .
when Trending line + one of the momentum lines crosses over the 3rd line (secondary momentum) this can also be seem as trend confirmation.
with that said the strongest and safest set ups are still when 2 is above the TRENDING LINE and 1 below