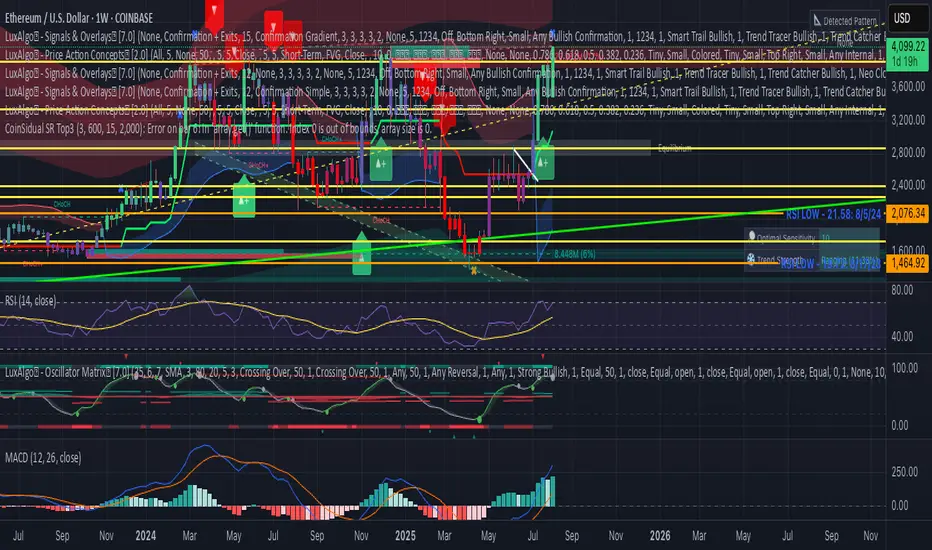
CoinSidual SR Top3What it does
Plots up to 3 Resistance (red) and 3 Support (green) zones using confirmed swing highs/lows. Nearby levels are clustered by tolerance (bps) to avoid duplicates. Lines extend left/right and auto-update.
Inputs
• Swing Length – pivot lookback/forward
• Lookback Bars – analysis window size
• Cluster Tolerance (bps) – merge distance
• Line Extend Bars – label/line span
• Show R/S Labels – toggle labels
Notes
Works on any symbol/timeframe. No alerts. For educational use only.
Indicador Pine Script®