Fibonacci Trend Reversal StrategyIntroduction
This publication introduces the " Fibonacci Retracement Trend Reversal Strategy, " tailored for traders aiming to leverage shifts in market momentum through advanced trend analysis and risk management techniques. This strategy is designed to pinpoint potential reversal points, optimizing trading opportunities.
Overview
The strategy leverages Fibonacci retracement levels derived from @IMBA_TRADER's lance Algo to identify potential trend reversals. It's further enhanced by a method called " Trend Strength Over Time " (TSOT) (by @federalTacos5392b), which utilizes percentile rankings of price action to measure trend strength. This also has implemented Dynamic SL finder by utilizing @veryfid's ATR Stoploss Finder which works pretty well
Indicators:
Fibonacci Retracement Levels : Identifies critical reversal zones at 23.6%, 50%, and 78.6% levels.
TSOT (Trend Strength Over Time) : Employs percentile rankings across various timeframes to gauge the strength and direction of trends, aiding in the confirmation of Fibonacci-based signals.
ATR (Average True Range) : Implements dynamic stop-loss settings for both long and short positions, enhancing trade security.
Strategy Settings :
- Sensitivity: Set default at 18, adjustable for more frequent or sparse signals based on market volatility.
- ATR Stop Loss Finder: Multiplier set at 3.5, applying the ATR value to determine stop losses dynamically.
- ATR Length: Default set to 14 with RMA smoothing.
- TSOT Settings: Hard-coded to identify percentile ranks, with no user-adjustable inputs due to its intrinsic calculation method.
Trade Direction Options : Configurable to support long, short, or both directions, adaptable to the trader's market assessment.
Entry Conditions :
- Long Entry: Triggered when the price surpasses the mid Fibonacci level (50%) with a bullish TSOT signal.
- Short Entry: Activated when the price falls below the mid Fibonacci level with a bearish TSOT indication.
Exit Conditions :
- Employs ATR-based dynamic stop losses, calibrated according to current market volatility, ensuring effective risk management.
Strategy Execution :
- Risk Management: Features adjustable risk-reward settings and enables partial take profits by default to systematically secure gains.
- Position Reversal: Includes an option to reverse positions based on new TSOT signals, improving the strategy's responsiveness to evolving market conditions.
The strategy is optimized for the BYBIT:WIFUSDT.P market on a scalping (5-minute) timeframe, using the default settings outlined above.
I spent a lot of time creating the dynamic exit strategies for partially taking profits and reversing positions so please make use of those and feel free to adjust the settings, tool tips are also provided.
For Developers: this is published as open-sourced code so that developers can learn something especially on dynamic exits and partial take profits!
Good Luck!
Disclaimer
This strategy is shared for educational purposes and must be thoroughly tested under diverse market conditions. Past performance does not guarantee future results. Traders are advised to integrate this strategy with other analytical tools and tailor it to specific market scenarios. I was only sharing what I've crafted while strategizing over a Solana Meme Coin.
Forecasting

CVD Divergence Strategy.1.mmThis is the matching Strategy version of Indicator of the same name.
As a member of the K1m6a Lions discussion community we often use versions of the Cumulative Volume Delta indicator
as one of our primary tools along with RSI, RSI Divergences, Open interest, Volume Profile, TPO and Fibonacci levels.
We also discuss visual interpretations of CVD Divergences across multiple time frames much like RSI divergences.
RSI Divergences can be identified as possible Bullish reversal areas when the RSI is making higher low points while
the price is making lower low points.
RSI Divergences can be identified as possible Bearish reversal areas when the RSI is making lower high points while
the price is making higher high points.
CVD Divergences can also be identified the same way on any timeframe as possible reversal signals. As with RSI, these Divergences
often occur as a trend's momentum is giving way to lower volume and areas when profits are being taken signaling a possible reversal
of the current trending price movement.
Hidden Divergences are identified as calculations that may be signaling a continuation of the current trend.
Having not found any public domain versions of a CVD Divergence indicator I have combined some public code to create this
indicator and matching strategy. The calculations for the Cumulative Volume Delta keep a running total for the differences between
the positive changes in volume in relation to the negative changes in volume. A relative upward spike in CVD is created when
there is a large increase in buying vs a low amount of selling. A relative downward spike in CVD is created when
there is a large increase in selling vs a low amount of buying.
In the settings menu, the is a drop down to be used to view the results in alternate timeframes while the chart remains on current timeframe. The Lookback settings can be adjusted so that the divs show on a more local, spontaneous level if set at 1,1,60,1. For a deeper, wider view of the divs, they can be set higher like 7,7,60,7. Adjust them all to suit your view of the divs.
To create this indicator/strategy I used a portion of the code from "Cumulative Volume Delta" by @ contrerae which calculates
the CVD from aggregate volume of many top exchanges and plots the continuous changes on a non-overlay indicator.
For the identification and plotting of the Divergences, I used similar code from the Tradingview Technical "RSI Divergence Indicator"
This indicator should not be used as a stand-alone but as an additional tool to help identify Bullish and Bearish Divergences and
also Bullish and Bearish Hidden Divergences which, as opposed to regular divergences, may indicate a continuation.

Multi-TF AI SuperTrend with ADX - Strategy [PresentTrading]
## █ Introduction and How it is Different
The trading strategy in question is an enhanced version of the SuperTrend indicator, combined with AI elements and an ADX filter. It's a multi-timeframe strategy that incorporates two SuperTrends from different timeframes and utilizes a k-nearest neighbors (KNN) algorithm for trend prediction. It's different from traditional SuperTrend indicators because of its AI-based predictive capabilities and the addition of the ADX filter for trend strength.
BTC 8hr Performance
ETH 8hr Performance
## █ Strategy, How it Works: Detailed Explanation (Revised)
### Multi-Timeframe Approach
The strategy leverages the power of multiple timeframes by incorporating two SuperTrend indicators, each calculated on a different timeframe. This multi-timeframe approach provides a holistic view of the market's trend. For example, a 8-hour timeframe might capture the medium-term trend, while a daily timeframe could capture the longer-term trend. When both SuperTrends align, the strategy confirms a more robust trend.
### K-Nearest Neighbors (KNN)
The KNN algorithm is used to classify the direction of the trend based on historical SuperTrend values. It uses weighted voting of the 'k' nearest data points. For each point, it looks at its 'k' closest neighbors and takes a weighted average of their labels to predict the current label. The KNN algorithm is applied separately to each timeframe's SuperTrend data.
### SuperTrend Indicators
Two SuperTrend indicators are used, each from a different timeframe. They are calculated using different moving averages and ATR lengths as per user settings. The SuperTrend values are then smoothed to make them suitable for KNN-based prediction.
### ADX and DMI Filters
The ADX filter is used to eliminate weak trends. Only when the ADX is above 20 and the directional movement index (DMI) confirms the trend direction, does the strategy signal a buy or sell.
### Combining Elements
A trade signal is generated only when both SuperTrends and the ADX filter confirm the trend direction. This multi-timeframe, multi-indicator approach reduces false positives and increases the robustness of the strategy.
By considering multiple timeframes and using machine learning for trend classification, the strategy aims to provide more accurate and reliable trade signals.
BTC 8hr Performance (Zoom-in)
## █ Trade Direction
The strategy allows users to specify the trade direction as 'Long', 'Short', or 'Both'. This is useful for traders who have a specific market bias. For instance, in a bullish market, one might choose to only take 'Long' trades.
## █ Usage
Parameters: Adjust the number of neighbors, data points, and moving averages according to the asset and market conditions.
Trade Direction: Choose your preferred trading direction based on your market outlook.
ADX Filter: Optionally, enable the ADX filter to avoid trading in a sideways market.
Risk Management: Use the trailing stop-loss feature to manage risks.
## █ Default Settings
Neighbors (K): 3
Data points for KNN: 12
SuperTrend Length: 10 and 5 for the two different SuperTrends
ATR Multiplier: 3.0 for both
ADX Length: 21
ADX Time Frame: 240
Default trading direction: Both
By customizing these settings, traders can tailor the strategy to fit various trading styles and assets.

Machine Learning: SuperTrend Strategy TP/SL [YinYangAlgorithms]The SuperTrend is a very useful Indicator to display when trends have shifted based on the Average True Range (ATR). Its underlying ideology is to calculate the ATR using a fixed length and then multiply it by a factor to calculate the SuperTrend +/-. When the close crosses the SuperTrend it changes direction.
This Strategy features the Traditional SuperTrend Calculations with Machine Learning (ML) and Take Profit / Stop Loss applied to it. Using ML on the SuperTrend allows for the ability to sort data from previous SuperTrend calculations. We can filter the data so only previous SuperTrends that follow the same direction and are within the distance bounds of our k-Nearest Neighbour (KNN) will be added and then averaged. This average can either be achieved using a Mean or with an Exponential calculation which puts added weight on the initial source. Take Profits and Stop Losses are then added to the ML SuperTrend so it may capitalize on Momentum changes meanwhile remaining in the Trend during consolidation.
By applying Machine Learning logic and adding a Take Profit and Stop Loss to the Traditional SuperTrend, we may enhance its underlying calculations with potential to withhold the trend better. The main purpose of this Strategy is to minimize losses and false trend changes while maximizing gains. This may be achieved by quick reversals of trends where strategic small losses are taken before a large trend occurs with hopes of potentially occurring large gain. Due to this logic, the Win/Loss ratio of this Strategy may be quite poor as it may take many small marginal losses where there is consolidation. However, it may also take large gains and capitalize on strong momentum movements.
Tutorial:
In this example above, we can get an idea of what the default settings may achieve when there is momentum. It focuses on attempting to hit the Trailing Take Profit which moves in accord with the SuperTrend just with a multiplier added. When momentum occurs it helps push the SuperTrend within it, which on its own may act as a smaller Trailing Take Profit of its own accord.
We’ve highlighted some key points from the last example to better emphasize how it works. As you can see, the White Circle is where profit was taken from the ML SuperTrend simply from it attempting to switch to a Bullish (Buy) Trend. However, that was rejected almost immediately and we went back to our Bearish (Sell) Trend that ended up resulting in our Take Profit being hit (Yellow Circle). This Strategy aims to not only capitalize on the small profits from SuperTrend to SuperTrend but to also capitalize when the Momentum is so strong that the price moves X% away from the SuperTrend and is able to hit the Take Profit location. This Take Profit addition to this Strategy is crucial as momentum may change state shortly after such drastic price movements; and if we were to simply wait for it to come back to the SuperTrend, we may lose out on lots of potential profit.
If you refer to the Yellow Circle in this example, you’ll notice what was talked about in the Summary/Overview above. During periods of consolidation when there is little momentum and price movement and we don’t have any Stop Loss activated, you may see ‘Signal Flashing’. Signal Flashing is when there are Buy and Sell signals that keep switching back and forth. During this time you may be taking small losses. This is a normal part of this Strategy. When a signal has finally been confirmed by Momentum, is when this Strategy shines and may produce the profit you desire.
You may be wondering, what causes these jagged like patterns in the SuperTrend? It's due to the ML logic, and it may be a little confusing, but essentially what is happening is the Fast Moving SuperTrend and the Slow Moving SuperTrend are creating KNN Min and Max distances that are extreme due to (usually) parabolic movement. This causes fewer values to be added to and averaged within the ML and causes less smooth and more exponential drastic movements. This is completely normal, and one of the perks of using k-Nearest Neighbor for ML calculations. If you don’t know, the Min and Max Distance allowed is derived from the most recent(0 index of data array) to KNN Length. So only SuperTrend values that exhibit distances within these Min/Max will be allowed into the average.
Since the KNN ML logic can cause these exponential movements in the SuperTrend, they likewise affect its Take Profit. The Take Profit may benefit from this movement like displayed in the example above which helped it claim profit before then exhibiting upwards movement.
By default our Stop Loss Multiplier is kept quite low at 0.0000025. Keeping it low may help to reduce some Signal Flashing while not taking extra losses more so than not using it at all. However, if we increase it even more to say 0.005 like is shown in the example above. It can really help the trend keep momentum. Please note, although previous results don’t imply future results, at 0.0000025 Stop Loss we are currently exhibiting 69.27% profit while at 0.005 Stop Loss we are exhibiting 33.54% profit. This just goes to show that although there may be less Signal Flashing, it may not result in more profit.
We will conclude our Tutorial here. Hopefully this has given you some insight as to how Machine Learning, combined with Trailing Take Profit and Stop Loss may have positive effects on the SuperTrend when turned into a Strategy.
Settings:
SuperTrend:
ATR Length: ATR Length used to create the Original Supertrend.
Factor: Multiplier used to create the Original Supertrend.
Stop Loss Multiplier: 0 = Don't use Stop Loss. Stop loss can be useful for helping to prevent false signals but also may result in more loss when hit and less profit when switching trends.
Take Profit Multiplier: Take Profits can be useful within the Supertrend Strategy to stop the price reverting all the way to the Stop Loss once it's been profitable.
Machine Learning:
Only Factor Same Trend Direction: Very useful for ensuring that data used in KNN is not manipulated by different SuperTrend Directional data. Please note, it doesn't affect KNN Exponential.
Rationalized Source Type: Should we Rationalize only a specific source, All or None?
Machine Learning Type: Are we using a Simple ML Average, KNN Mean Average, KNN Exponential Average or None?
Machine Learning Smoothing Type: How should we smooth our Fast and Slow ML Datas to be used in our KNN Distance calculation? SMA, EMA or VWMA?
KNN Distance Type: We need to check if distance is within the KNN Min/Max distance, which distance checks are we using.
Machine Learning Length: How far back is our Machine Learning going to keep data for.
k-Nearest Neighbour (KNN) Length: How many k-Nearest Neighbours will we account for?
Fast ML Data Length: What is our Fast ML Length?? This is used with our Slow Length to create our KNN Distance.
Slow ML Data Length: What is our Slow ML Length?? This is used with our Fast Length to create our KNN Distance.
If you have any questions, comments, ideas or concerns please don't hesitate to contact us.
HAPPY TRADING!

Double AI Super Trend Trading - Strategy [PresentTrading]█ Introduction and How It is Different
The Double AI Super Trend Trading Strategy is a cutting-edge approach that leverages the power of not one, but two AI algorithms, in tandem with the SuperTrend technical indicator. The strategy aims to provide traders with enhanced precision in market entry and exit points. It is designed to adapt to market conditions dynamically, offering the flexibility to trade in both bullish and bearish markets.
*The KNN part is mainly referred from @Zeiierman.
BTCUSD 8hr performance
ETHUSD 8hr performance
█ Strategy, How It Works: Detailed Explanation
1. SuperTrend Calculation
The SuperTrend is a popular indicator that captures market trends through a combination of the Volume-Weighted Moving Average (VWMA) and the Average True Range (ATR). This strategy utilizes two sets of SuperTrend calculations with varying lengths and factors to capture both short-term and long-term market trends.
2. KNN Algorithm
The strategy employs k-Nearest Neighbors (KNN) algorithms, which are supervised machine learning models. Two sets of KNN algorithms are used, each focused on different lengths of historical data and number of neighbors. The KNN algorithms classify the current SuperTrend data point as bullish or bearish based on the weighted sum of the labels of the k closest historical data points.
3. Signal Generation
Based on the KNN classifications and the SuperTrend indicator, the strategy generates signals for the start of a new trend and the continuation of an existing trend.
4. Trading Logic
The strategy uses these signals to enter long or short positions. It also incorporates dynamic trailing stops for exit conditions.
Local picture
█ Trade Direction
The strategy allows traders to specify their trading direction: long, short, or both. This enables the strategy to be versatile and adapt to various market conditions.
█ Usage
ToolTips: Comprehensive tooltips are provided for each parameter to guide the user through the customization process.
Inputs: Traders can customize numerous parameters including the number of neighbors in KNN, ATR multiplier, and types of moving averages.
Plotting: The strategy also provides visual cues on the chart to indicate bullish or bearish trends.
Order Execution: Based on the generated signals, the strategy will execute buy or sell orders automatically.
█ Default Settings
The default settings are configured to offer a balanced approach suitable for most scenarios:
Initial Capital: $10,000
Default Quantity Type: 10% of equity
Commission: 0.1%
Slippage: 1
Currency: USD
These settings can be modified to suit various trading styles and asset classes.

IU Break of any session StrategyHow this script works:
1. This script is an intraday trading strategy script which buy and sell on the bases of user-defined intraday session range breakout and gives alert(if the alert is set) message too when the new position is open.
2. It calculate the session as per the user inputs or user defined custom session.
3. The script stores the highest and lowest value of the whole session.
4. It take a long position on the first break and close above the highest value.
5. It take a short position on the break and close below the lowest value.
6. The script takes one position in one day.
7. The stop loss for this script is the previous low(if long) or high(if short).
8. Take profit is 1:2 and it's adjustable.
9. This script work on every kind of market.
How The Useful For The User :
1. User can backtest any session range breakout he wants to trade.
2. User can get alert when the new position is open.
3. User can change the Risk to Reward in order to find the best Risk to Reward.
4. User can see the highest and lowest value of the session with respect to analyzing his trading objective.
5. This strategy script highlights which session range breakout performs best and which performs worst.

AI SuperTrend - Strategy [presentTrading]
█ Introduction and How it is Different
The AI Supertrend Strategy is a unique hybrid approach that employs both traditional technical indicators and machine learning techniques. Unlike standard strategies that rely solely on traditional indicators or mathematical models, this strategy integrates the power of k-Nearest Neighbors (KNN), a machine learning algorithm, with the tried-and-true SuperTrend indicator. This blend aims to provide traders with more accurate, responsive, and context-aware trading signals.
*The KNN part is mainly referred from @Zeiierman.
BTCUSD 8hr performance
ETHUSD 8hr performance
█ Strategy, How it Works: Detailed Explanation
SuperTrend Calculation
Volume-Weighted Moving Average (VWMA): A VWMA of the close price is calculated based on the user-defined length (len). This serves as the central line around which the upper and lower bands are calculated.
Average True Range (ATR): ATR is calculated over a period defined by len. It measures the market's volatility.
Upper and Lower Bands: The upper band is calculated as VWMA + (factor * ATR) and the lower band as VWMA - (factor * ATR). The factor is a user-defined multiplier that decides how wide the bands should be.
KNN Algorithm
Data Collection: An array (data) is populated with recent n SuperTrend values. Corresponding labels (labels) are determined by whether the weighted moving average price (price) is greater than the weighted moving average of the SuperTrend (sT).
Distance Calculation: The absolute distance between each data point and the current SuperTrend value is calculated.
Sorting & Weighting: The distances are sorted in ascending order, and the closest k points are selected. Each point is weighted by the inverse of its distance to the current point.
Classification: A weighted sum of the labels of the k closest points is calculated. If the sum is closer to 1, the trend is predicted as bullish; if closer to 0, bearish.
Signal Generation
Start of Trend: A new bullish trend (Start_TrendUp) is considered to have started if the current trend color is bullish and the previous was not bullish. Similarly for bearish trends (Start_TrendDn).
Trend Continuation: A bullish trend (TrendUp) is considered to be continuing if the direction is negative and the KNN prediction is 1. Similarly for bearish trends (TrendDn).
Trading Logic
Long Condition: If Start_TrendUp or TrendUp is true, a long position is entered.
Short Condition: If Start_TrendDn or TrendDn is true, a short position is entered.
Exit Condition: Dynamic trailing stops are used for exits. If the trend does not continue as indicated by the KNN prediction and SuperTrend direction, an exit signal is generated.
The synergy between SuperTrend and KNN aims to filter out noise and produce more reliable trading signals. While SuperTrend provides a broad sense of the market direction, KNN refines this by predicting short-term price movements, leading to a more nuanced trading strategy.
Local picture
█ Trade Direction
The strategy allows traders to choose between taking only long positions, only short positions, or both. This is particularly useful for adapting to different market conditions.
█ Usage
ToolTips: Explains what each parameter does and how to adjust them.
Inputs: Customize values like the number of neighbors in KNN, ATR multiplier, and moving average type.
Plotting: Visual cues on the chart to indicate bullish or bearish trends.
Order Execution: Based on the generated signals, the strategy will execute buy/sell orders.
█ Default Settings
The default settings are selected to provide a balanced approach, but they can be modified for different trading styles and asset classes.
Initial Capital: $10,000
Default Quantity Type: 10% of equity
Commission: 0.1%
Slippage: 1
Currency: USD
By combining both machine learning and traditional technical analysis, this strategy offers a sophisticated and adaptive trading solution.

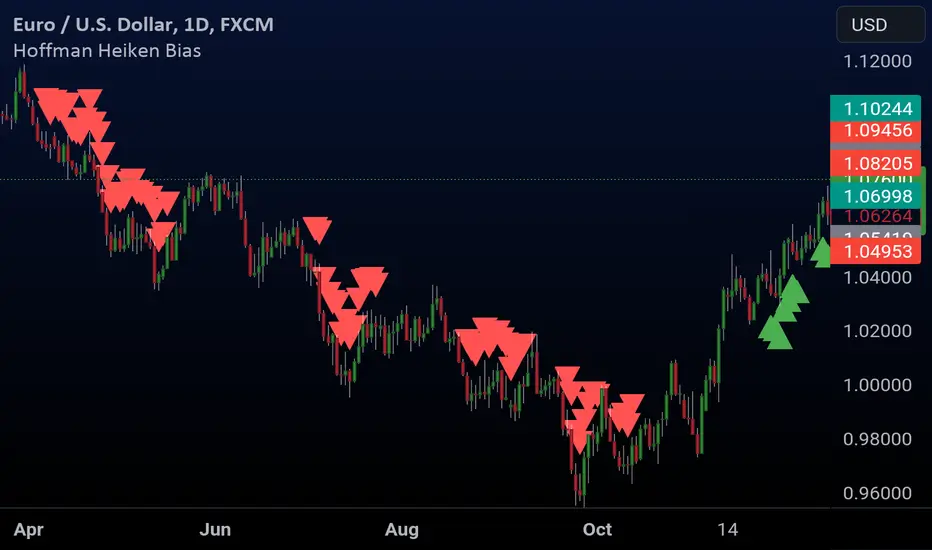
Hoffman Heiken BiasThis indicator uses a couple of different things including the Hoffman moving averages applied with heiken ashi bar data and some volatility to help determine when the bias of the market has shifted for the timeframe you are looking at.
Gaussian Detrended ReversionThis strategy, titled "Gaussian Detrended Reversion Strategy," aims to identify potential price reversals using the customized Gaussian Detrended Price Oscillator (GDPO) in combination with smoothed price cycles.
Key Elements of the Strategy:
GDPO Calculation: The strategy first calculates the Detrended Price Oscillator (DPO) by comparing the close price to an Exponential Moving Average (EMA) of a specified period. This calculation helps identify short-term price cycles by detrending the price data.
Gaussian Smoothing: The DPO values are then smoothed using the Arnaud Legoux Moving Average (ALMA), applying a Gaussian smoothing technique. This smoothed version of the DPO is intended to filter out noise and provide a clearer picture of price trends.
Entry and Exit Conditions: The strategy defines conditions for both long and short entry points as well as exit points. It looks for specific crossover events between the smoothed GDPO and its lagged version. The strategy enters a long position when the smoothed GDPO crosses above the lag and is negative, and exits the long position when the smoothed GDPO crosses below the lag or the zero line. Similarly, the strategy enters a short position when the smoothed GDPO crosses below the lag and is positive, and exits the short position when the smoothed GDPO crosses above the lag or the zero line.
Visualization: The smoothed GDPO and its lag are plotted on the chart using distinct colors. The zero line is also displayed as a reference point. Additionally, the chart background changes color when the strategy enters a long or short position. Cross markers are also plotted at the crossover points as exit cues.
Overall, this strategy aims to capture potential price reversals using the GDPO and Gaussian smoothing, with specific entry and exit conditions to guide trading decisions.
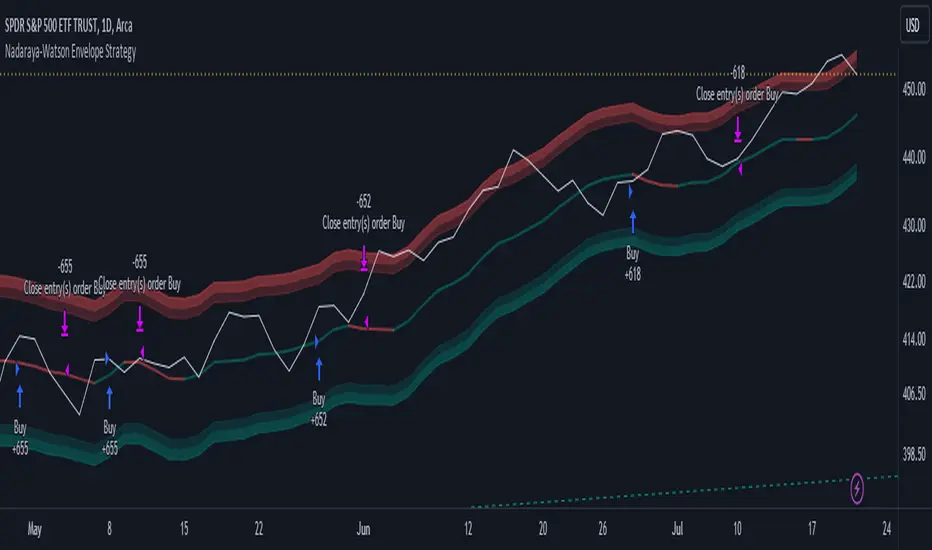
Nadaraya-Watson Envelope Strategy (Non-Repainting) Log ScaleIn the diverse world of trading strategies, the Nadaraya-Watson Envelope Strategy offers a different approach. Grounded in mathematical analysis, this strategy utilizes the Nadaraya-Watson kernel regression, a method traditionally employed for interpreting complex data patterns.
At the core of this strategy lies the concept of 'envelopes', which are essentially dynamic volatility bands formed around the price based on a custom Average True Range (ATR). These envelopes help provide guidance on potential market entry and exit points. The strategy suggests considering a buy when the price crosses the lower envelope and a sell when it crosses the upper envelope.
One distinctive characteristic of the Nadaraya-Watson Envelope Strategy is its use of a logarithmic scale, as opposed to a linear scale. The logarithmic scale can be advantageous when dealing with larger timeframes and assets with wide-ranging price movements.
The strategy is implemented using Pine Script v5, and includes several adjustable parameters such as the lookback window, relative weighting, and the regression start point, providing a level of flexibility.
However, it's important to maintain a balanced view. While the use of mathematical models like the Nadaraya-Watson kernel regression may provide insightful data analysis, no strategy can guarantee success. Thorough backtesting, understanding the mathematical principles involved, and sound risk management are always essential when applying any trading strategy.
The Nadaraya-Watson Envelope Strategy thus offers another tool for traders to consider. As with all strategies, its effectiveness will largely depend on the trader's understanding, application, and the specific market conditions.
Crunchster's Normalised Trend StrategyThis is a unique rules-based, systematic trading strategy - in the trend following category.
The strategy is designed for use on the daily timeframe. Specific features of this strategy are outlined below:
1. Uses a transformed price series (which I dub "real price") to generate signals rather than ticker price
2. Uses advanced position sizing and risk management, usually reserved for institutional portfolio management, a proven technique utilised by Commodity Trading Advisors and Managed Futures funds (Algo/Quant funds).
"Real Price" is a transformed price series derived from the sum of volatility adjusted (daily) returns, over the entire price series of an asset. The lookback period of the volatility adjustment is user defined.
A Hull moving average (HMA) is derived from the real price, and used as the main trend determinant. The lookback period of the HMA is user defined. Default lookback of 100 periods (days) ensures a responsive trend indicator, but without leading to over-trading from frequent crossovers (average holding period 14 days on BTC).
The core strategy is very simple, go long when real price crosses over HMA, go short when real price crosses under HMA. New position triggers automatically close open positions in the counter direction.
Position sizing is based on recent price volatility and the user defined annualised risk target. In essence positions are inverse volatility weighted, so larger size is opened during lower volatility and smaller size during increased volatility. Recent volatility is calculated as the standard deviation of returns with 14 period lookback, then extrapolated into an annualised volatility of expected returns. Annualised recent volatility is then referenced to the risk target set by the user to adjust the position size. The default settings are a very conservative 10% annual risk target. Initial capital should be set as the maximum risk capital per trade (ie if $10,000 total capital and 10% risk per trade, initial capital should be $1000). Maximum leverage per position can be set independently, to facilitate hitting risk targets that are greater than the natural volatility of the traded asset, and to accommodate low volatility conditions, whilst maintaining overall risk controls.
Hard stop losses are based on multiples of the average true range of recent price (14 period lookback), user configurable.
Please leave comments regarding further features or refinements. I plan to develop further adding alternative moving average selections and the ability to select/deselect long and short strategies.
3 hours ago
Release Notes:
Added option to compound profits versus using a fixed position capital. Be mindful that compounding will potentially increase profits, but also increase drawdowns and overall risk. Leverage will still cap overall exposure with compounding and therefore provides an additional layer of risk control.
2 hours ago
Release Notes:
Added function to toggle long/short strategy legs on and off.

SuperTrend Long Strategy +TrendFilterThis strategy aims to identify long (buy) opportunities in the market using the SuperTrend indicator. It utilizes the Average True Range (ATR) and a multiplier to determine the dynamic support levels for entering long positions. This presentation will provide an overview of the strategy's components, explain its usage, and highlight that it focuses on long trades.
Components of the Strategy:
1. ATR Period: This input determines the period used for calculating the Average True Range (ATR). A higher value may result in smoother trend lines but may lag behind recent price changes.
2. Source (src): This input determines the price source used for calculations, with "hl2" (the average of high and low prices) set as the default.
3. ATR Multiplier: This input specifies the multiplier applied to the ATR value to determine the distance of the support levels from the source.
4. Change ATR Calculation Method: This input allows toggling between two methods of ATR calculation: the default method using atr() or a simple moving average (SMA) of ATR values (sma(tr, Periods)).
5. Show Buy/Sell Signals: This input enables or disables the display of buy and sell signals on the chart.
6. Highlighter On/Off: This input controls whether highlighting of up and down trends is displayed on the chart.
7. Bar Coloring On/Off: This input determines whether the bars on the chart are colored based on the trend direction.
8. The "SuperTrend Long STRATEGY" has been enhanced by incorporating a trend filter. A moving average is used as the filter to confirm the prevailing trend before executing trades. This addition effectively reduces false signals and improves the strategy's reliability, all while maintaining its original name.
Strategy Logic:
1. The strategy calculates the upper (up) and lower (dn) trend lines based on the ATR value and the chosen multiplier.
2. The trend variable keeps track of the current trend, with 1 indicating an uptrend and -1 indicating a downtrend.
3. Buy and sell signals are generated based on the change in trend direction.
4. The strategy includes an optional highlighting feature that colors the chart background based on the current trend.
5. Additionally, the bar coloring feature colors the bars based on the direction of the last trend change.
Usage:
1. ATR Period and ATR Multiplier can be adjusted based on the desired sensitivity and risk tolerance.
2. Buy and sell signals can be displayed using the Show Buy/Sell Signals input, providing clear indications of entry and exit points.
3. The Highlighter On/Off input allows users to visually identify the prevailing trend by coloring the chart background.
4. The Bar Coloring On/Off input offers a quick visual reference for the most recent trend change.
Long Strategy:
The SuperTrend Long Strategy is specifically designed to identify long (buy) opportunities. It generates buy signals when the current trend changes from a downtrend to an uptrend, indicating a potential entry point for long positions. The strategy aims to capture upward price movements and maximize profits during bullish market conditions.
The SuperTrend Long Strategy provides traders with a systematic approach to identifying long trade opportunities. By leveraging the SuperTrend indicator and dynamic support levels, this strategy aims to generate buy signals in uptrending markets. Traders can customize the inputs and utilize the visual features to adapt the strategy to their specific trading preferences.
The modification adds a trend filter to the "SuperTrend Long STRATEGY" to improve its effectiveness. The trend filter uses a moving average to confirm the prevailing trend before taking trades. This addition helps filter out false signals and enhances the strategy's reliability without changing its name.

Lorentzian Classification Strategy Based in the model of Machine learning: Lorentzian Classification by @jdehorty, you will be able to get into trending moves and get interesting entries in the market with this strategy. I also put some new features for better backtesting results!
Backtesting context: 2022-07-19 to 2023-04-14 of US500 1H by PEPPERSTONE. Commissions: 0.03% for each entry, 0.03% for each exit. Risk per trade: 2.5% of the total account
For this strategy, 3 indicators are used:
Machine learning: Lorentzian Classification by @jdehorty
One Ema of 200 periods for identifying the trend
Supertrend indicator as a filter for some exits
Atr stop loss from Gatherio
Trade conditions:
For longs:
Close price is above 200 Ema
Lorentzian Classification indicates a buying signal
This gives us our long signal. Stop loss will be determined by atr stop loss (white point), break even(blue point) by a risk/reward ratio of 1:1 and take profit of 3:1 where half position will be closed. This will be showed as buy.
The other half will be closed when the model indicates a selling signal or Supertrend indicator gives a bearish signal. This will be showed as cl buy.
For shorts:
Close price is under 200 Ema
Lorentzian Classification indicates a selling signal
This gives us our short signal. Stop loss will be determined by atr stop loss (white point), break even(blue point) by a risk/reward ratio of 1:1 and take profit of 3:1 where half position will be closed. This will be showed as sell.
The other half will be closed when the model indicates a buying signal or Supertrend indicator gives a bullish signal. This will be showed as cl sell.
Risk management
To calculate the amount of the position you will use just a small percent of your initial capital for the strategy and you will use the atr stop loss or last swing for this.
Example: You have 1000 usd and you just want to risk 2,5% of your account, there is a buy signal at price of 4,000 usd. The stop loss price from atr stop loss or last swing is 3,900. You calculate the distance in percent between 4,000 and 3,900. In this case, that distance would be of 2.50%. Then, you calculate your position by this way: (initial or current capital * risk per trade of your account) / (stop loss distance).
Using these values on the formula: (1000*2,5%)/(2,5%) = 1000usd. It means, you have to use 1000 usd for risking 2.5% of your account.
We will use this risk management for applying compound interest.
> In settings, with position amount calculator, you can enter the amount in usd of your account and the amount in percentage for risking per trade of the account. You will see this value in green color in the upper left corner that shows the amount in usd to use for risking the specific percentage of your account.
> You can also choose a fixed amount, so you will have to activate fixed amount in risk management for trades and set the fixed amount for backtesting.
Script functions
Inside of settings, you will find some utilities for display atr stop loss, break evens, positions, signals, indicators, a table of some stats from backtesting, etc.
You will find the settings for risk management at the end of the script if you want to change something or trying new values for other assets for backtesting.
If you want to change the initial capital for backtest the strategy, go to properties, and also enter the commisions of your exchange and slippage for more realistic results.
In risk managment you can find an option called "Use leverage ?", activate this if you want to backtest using leverage, which means that in case of not having enough money for risking the % determined by you of your account using your initial capital, you will use leverage for using the enough amount for risking that % of your acount in a buy position. Otherwise, the amount will be limited by your initial/current capital
I also added a function for backtesting if you had added or withdrawn money frequently:
Adding money: You can choose how often you want to add money (Monthly, yearly, daily or weekly). Then a fixed amount of money and activate or deactivate this function
Withdraw money: You can choose if you want to withdraw a fixed amount or a percentage of earnings. Then you can choose a fixed amount of money, the period of time and activate or deactivate this function. Also, the percentage of earnings if you choosed this option.
Some other assets where strategy has worked
BTCUSD 4H, 1D
ETHUSD 4H, 1D
BNBUSD 4H
SPX 1D
BANKNIFTY 4H, 15 min
Some things to consider
USE UNDER YOUR OWN RISK. PAST RESULTS DO NOT REPRESENT THE FUTURE.
DEPENDING OF % ACCOUNT RISK PER TRADE, YOU COULD REQUIRE LEVERAGE FOR OPEN SOME POSITIONS, SO PLEASE, BE CAREFULL AND USE CORRECTLY THE RISK MANAGEMENT
Do not forget to change commissions and other parameters related with back testing results!. If you have problems loading the script reduce max bars back number in general settings
Strategies for trending markets use to have more looses than wins and it takes a long time to get profits, so do not forget to be patient and consistent !
Please, visit the post from @jdehorty called Machine Learning: Lorentzian Classification for a better understanding of his script!
Any support and boosts will be well received. If you have any question, do not doubt to ask!

8 Day Run - Momentum StrategyInspired by Linda Bradford Raschke.
Entry criteria:
This strategy is used to capture momentum effects on the daily periodicities. Once prices have had a run of 8 or more consecutive closes above or below the 5-period simple moving average the strategy is primed to trade.
It will then enter a short on the first close above the 5sma after a run of 8 or more closes below the 5sma (it will enter a long when the price closes below the 5sma after a run of 8 or more closes above the 5sma).
Exit criteria:
All trades are exited on the first close back above/ below the 5sma.

ARCHENS SHARESThis script marks the high and low of 9.45 to 10.15 price. When the price breaks high, then gives Buy signal. When the price breaks low, then it gives Sell Signal. These buy and sell signals are given with labels "ARCHENS BUY" or "ARCHENS SELL". With my observation in stock market, I have made this strategy.
This strategy works in normal candle pattern but i observed that it works well in heikenashi candle. For this strategy to work well, we have to select 5 mins heikenashi candles.
If this strategy gives "ARCHENS buy", then buy it. Target should be as per individuals mind. But Stop loss should be hitted when there are two continue opposite {red} heikenashi candle.
If this strategy gives "ARCHENS sell", then sell it. Target should be as per individuals mind. But Stop loss should be hitted when there are two continue opposite {green} heikenashi candle.
Strategy for UT Bot Alerts indicator Using the UT Bot alerts indicator by @QuantNomad, this strategy was designed for showing an example of how this indicator could be used, also, it has the goal to help some people from a group that use to use this indicator for their trading. Under any circumstance I recommend to use it without testing it before in real time.
Backtesting context: 2020-02-05 to 2023-02-25 of BTCUSD 4H by Tvc. Commissions: 0.03% for each entry, 0.03% for each exit. Risk per trade: 2.5% of the total account
For this strategy, 3 indicators are used:
UT Bot Alerts indicator by Quantnomad
One Ema of 200 periods for indicate the trend
Atr stop loss from Gatherio
Trade conditions:
For longs:
Close price is higher than Atr from UT Bot
Ema from UT Bot cross over Atr from UT Bot.
This gives us our long signal. Stop loss will be determined by atr stop loss (white point), break even(blue point) by a risk/reward ratio of 0.75:1 and take profit of 3:1 where half position will be closed. This will be showed as buy (open long position)
The other half will be closed when close price is lower than Atr and Ema from UT Bot cross under Atr. This will be showed as cl buy (close long position)
For shorts:
Close price is lower than Atr from UT Bot
Ema from UT Bot cross over Atr from UT Bot.
This gives us our short signal. Stop loss will be determined by atr stop loss (white point), break even(blue point) by a risk/reward ratio of 0.75:1 and take profit of 3:1 where half position will be closed. This will be showed as sell (open short position)
The other half will be closed when close price is higher than Atr and Ema from UT Bot cross over Atr. This will be showed as cl sell (close short position)
Risk management
For calculate the amount of the position you will use just a small percent of your initial capital for the strategy and you will use the atr stop loss for this.
Example: You have 1000 usd and you just want to risk 2,5% of your account, there is a long signal at price of 20,000 usd. The stop loss price from atr stop loss is 19,000. You calculate the distance in percent between 20,000 and 19,000. In this case, that distance would be of 5,0%. Then, you calculate your position by this way: (initial or current capital * risk per trade of your account) / (stop loss distance).
Using these values on the formula: (1000*2,5%)/(5,0%) = 500usd. It means, you have to use 500 usd for risking 2.5% of your account.
We will use this risk management for apply compound interest.
In settings, with position amount calculator, you can enter the amount in usd of your account and the amount in percentage for risking per trade of the account. You will see this value in green color in the upper left corner that shows the amount in usd to use for risking the specific percentage of your account.
Script functions
Inside of settings, you will find some utilities for display atr stop loss, break evens, positions, signals, indicators, etc.
You will find the settings for risk management at the end of the script if you want to change something. But rebember, do not change values from indicators, the idea is to not over optimize the strategy.
If you want to change the initial capital for backtest the strategy, go to properties, and also enter the commisions of your exchange and slippage for more realistic results.
In risk managment you can find an option called "Use leverage ?", activate this if you want to backtest using leverage, which means that in case of not having enough money for risking the % determined by you of your account using your initial capital, you will use leverage for using the enough amount for risking that % of your acount in a buy position. Otherwise, the amount will be limited by your initial/current capital
---> Do not forget to deactivate Trades on chart option in style settings for a cleaner look of the chart <---
Some things to consider
USE UNDER YOUR OWN RISK. PAST RESULTS DO NOT REPRESENT THE FUTURE.
DEPENDING OF % ACCOUNT RISK PER TRADE, YOU COULD REQUIRE LEVERAGE FOR OPEN SOME POSITIONS, SO PLEASE, BE CAREFULL AND USE CORRECTLY THE RISK MANAGEMENT
Do not forget to change commissions and other parameters related with back testing results!
Strategies for trending markets use to have more looses than wins and it takes a long time to get profits, so do not forget to be patient and consistent !
---> The strategy can still be improved, you can change some parameters depending of the asset and timeframe like risk/reward for taking profits, for break even, also the main parameters of the UT Bot Alerts <----

Simple SuperTrend Strategy for BTCUSD 4HHello guys!, If you are a swing trader and you are looking for a simple trend strategy, you should check this one. Based in the supertrend indicator, this strategy will help you to catch big movements in BTCUSD 4H and avoid losses as much as possible in consolidated situations of the market
This strategy was designed for BTCUSD in 4H timeframe
Backtesting context: 2020-01-02 to 2023-01-05 (The strategy has also worked in previous years)
Trade conditions:
Rules are actually simple, the most important thing is the risk and position management of this strategy
For long:
Once Supertrend changes from a downtrend to a uptrend, you enter into a long position. The stop loss will be defined by the atr stop loss
The first profit will be of 0.75 risk/reward ratio where half position will be closed. When this happens, you move the stop loss to break even.
Now, just will be there two situations:
Once Supertrend changes from a uptrend to a downtrend, you close the other half of the initial long position.
If price goes againts the position, the position will be closed due to breakeven.
For short:
Once Supertrend changes from a uptrend to a downtrend, you enter into a short position. The stop loss will be defined by the atr stop loss
The first profit will be of 0.75 risk/reward ratio where half position will be closed. When this happens, you move the stop loss to break even.
Like in the long position, just will be there two situations:
Once Supertrend changes from a downtrend to a uptrend, you close the other half of the initial short position.
If price goes againts the position, the position will be closed due to breakeven.
Risk management
For calculate the amount of the position you will use just a small percent of your initial capital for the strategy and you will use the atr stop loss for this.
Example: You have 1000 usd and you just want to risk 2,5% of your account, there is a long signal at price of 20,000 usd. The stop loss price from atr stop loss is 19,000. You calculate the distance in percent between 20,000 and 19,000. In this case, that distance would be of 5,0%. Then, you calculate your position by this way: (initial or current capital * risk per trade of your account) / (stop loss distance).
Using these values on the formula: (1000*2,5%)/(5,0%) = 500usd. It means, you have to use 500 usd for risking 2.5% of your account.
We will use this risk management for apply compound interest.
Script functions
Inside of settings, you will find some utilities for display atr stop loss, supertrend or positions.
You will find the settings for risk management at the end of the script if you want to change something. But rebember, do not change values from indicators, the idea is to not over optimize the strategy.
If you want to change the initial capital for backtest the strategy, go to properties, and also enter the commisions of your exchange and slippage for more realistic results.
Signals meanings:
L for long position. CL for close long position.
S for short position. CS for close short position.
Tp for take profit (it also appears when the position is closed due to stop loss, this due to the script uses two kind of positions)
Exit due to break even or due to stop loss
Some things to consider
USE UNDER YOUR OWN RISK. PAST RESULTS DO NOT REPRESENT THE FUTURE.
DEPENDING OF % ACCOUNT RISK PER TRADE, YOU COULD REQUIRE LEVERAGE FOR OPEN SOME POSITIONS, SO PLEASE, BE CAREFULL AND USE CORRECTLY THE RISK MANAGEMENT
The amount of trades closed in the backtest are not exactly the real ones. If you want to know the real ones, go to settings and change % of trade for first take profit to 100 for getting the real ones. In the backtest, the real amount of opened trades was of 194.
Indicators used:
Supertrend
Atr stop loss by garethyeo
This is the fist strategy that I publish in tradingview, I will be glad with you for any suggestion, support or advice for future scripts. Do not doubt in make any question you have and if you liked this content, leave a boost. I plan to bring more strategies and useful content for you!

Open DriveOpen Drive is a market profile concept introduced by Jim Dalton. It occurs when the price moves directionally and persistently for the first 30 minutes from the cash market open.
It is necessary to use 30-minute bars as there needs to be enough time to measure an extreme move of the cash open. This means there will be fewer trades than other strategies using faster time periodicities.
The script finds open drives from these time points 0700/ 0800 and 1300/1430.
The entry signal also has a breakout threshold using the 5-bar high and 5-bar low to only take trades moving away from the prior 5-bar range. This weeds out most mid-range trades and small range expansion bars.
If the price has had a strong move from the open and has broken either below the prior 5-bar low or above the prior 5-bar high by an amount equal to the prior 5-bar range a trade is entered in the direction of the move.
The Exit criteria; exit after 3 bars which is 90mins when using a 30min periodicity.
Note, this script is shared to show that momentum generated on or around the cash open tends to persist. The entry and exits of this strategy are quite naive but there are plenty of ways to take more aggressive entries on faster time frames when an open drive occurs. The times chosen for this strategy will suit stock index futures mainly. The user can experiment with other futures products and their corresponding pit/ cash open hours.
Google "open drive market profile" for more information on open drives and market profile concepts.
Happy trading!

M0PB (Momentum Pullback)Long/short strategy that identifies extreme readings on the rsi as a *momentum signal*, unlike most RSI strategies the script will look to buy or sell the first pullback in the direction of the extreme RSI reading.
Enters positions on the first pullback to the 5ema(low)/ 5ema(high) and exits at rolling 12 bar high/ low. The rolling high/ low feature means that if the price enters into a prolonged consolidation the profit target will begin to reduce with each new bar. The best trades tend to work within 2-6 bars.
Built for use on 5 min intervals on FX, Indexes, and Crypto. Lower than 5 minute time frames tend to be noisier and mean more commissions and a higher risk of slippage so the suggested timeframe is 5 mins.
Hard stop is X ATR (users can experiment with this) from the position entry price. This can be adjusted in user inputs.
There is a lot of slack left in entries and exits but the overall strategy is fairly robust across timeframes and markets and has between 60%-70% win rate with larger winners.
Signals that occur from economic news volatility are best avoided.

Big Whale Purchases and SalesBig Whale Purchases and Sales - plots big whale transactions on your chart!
People that hold more than 1% of a crypto currencies circulating supply are considered whales and have a huge influence on price, not just because they can move the market with their huge transactions, but also because other traders often track their wallets and follow their example. Taking a look at whale holdings, one can see why whale worship is so common in crypto: While Bitcoin has a relatively low whale concentration, many of the Top 100 Cryptocurrencies have whales control 60% or more of their circulating supply.
Integrating IntoTheBlock data, this script plots the transactions of these whales and, in strategy mode, copy trades them.
Features:
Strategy Mode: Switches the script between an indicator and a strategy.
Standard Deviations: The number of Standard Deviations that a transaction needs to surpass to be considered worth plotting. Setting this to 0 will show all whale transactions, higher settings will only show the biggest transactions.
Blockchain: The Chain on which Whale activity is tracked.

Faytterro Estimator StrategyWhat is "Faytterro Estimator Strategy"?
"Faytterro Estimator Strategy" is strategy of faytterro estimator. if you want to know more about faytterro estimator:
What it does?
It trades according to the signals given by faytterro estimator and some additional restrictions.
How it does it?
Using the faytterro estimator and the following variables, it gives buy and sell signals in different sizes at ideal points.
How to use it?
The "source" part is used to change the source of faytterro estimator.
The "length" is the length of the fayterro estimator.
"Minimum entry-close gap" is the minimum distance between two transactions opened in opposite directions. For example, if you opened long at 20 500 and "Minimum entry-close gap" is 400, you will not receive a sell signal before the price goes above 20900.
If "minimum entry-entry gap" is the minimum difference between two transactions opened in the same direction. For example, if you open long at 20500 level and the "minimum entry-entry gap" is 400, you will not receive a "buy" signal before the price goes below the 20100 level.
"strong entry size" determines the size of strong signals. The size of ordinary signals is always 1.
note: default values for btc/usdt 1 hour timeframe.

GT 5.1 Strategy═════════════════════════════════════════════════════════════════════════
█ OVERVIEW
People often look an indicator in their technical analysis to enter a position. We may also need to look at the signals of one or more indicators to verify the signals given by some indicators. In this context, I developed a strategy to test whether it really works by choosing some of the indicators that capture trend changes with the same characteristics. Also, since the subject is to catch the trend change, I thought it would be right to include an indicator using the heikin ashi logic. By averaging and smoothing the market noise, Heiken Ashi makes it easier to detect the direction of the trend helps to see possible reversal points on the chart. However, it should be noted that Heiken Ashi is a lagging indicator.
I picked 5 different indicators (but their purpose are similar) and combined them to produce buy and sell signals based on your choice(not repaint). First of all let's get some information about our indicators. So you will understand me why i picked these indicators and what is the meaning of their signals.
1 — Coral Trend Indicator by LazyBear
Coral Trend Indicator is a linear combination of moving averages, all obtained by a triple or higher order exponential smoothing. The indicator comes with a trend indication which is based on the normalized slope of the plot. the usage of this indicator is simple. When the color of the line is green that means the market is in uptrend. But when the color is red that means the market is in downtrend.
As you see the original indicator it is simple to find is it in uptrend or downtrend.
So i added a code to find when the color of the line change. When it turns green to red my script giving sell signals, when it turns red to green it gives buy signals.
I hide the candles to show you more clearly what is happening when you choose only Coral Strategy. But sometimes it is not enough only using itself. Even if green dots turn to red it continues in uptrend. So we need a to look another indicator to approve our signal.
2 — SSL channel by ErwinBeckers
Known as the SSL , the Semaphore Signal Level channel is an indicator that combines moving averages to provide you with a clear visual signal of price movement dynamics. In short, it's designed to show you when a price trend is forming. This indicator creates a band by calculating the high and low values according to the determined period. Simply if you decide 10 as period, it calculates a 10-period moving average on the latest 10 highs. Calculate a 10-period moving average on the latest 10 lows. If the price falls below the low band, the downtrend begins, if the price closes above the high band, the uptrend begins. Lets look the original form of indicator and learn how it using.
If the red line is below and the green band is above, it means that we are in uptrend, and if it is on the opposite side, it means that we are in downtrend. Therefore, it would be logical to enter a position where the trend has changed. So i added a code to find when the crossover has occured.
As you see in my strategy, it gives you signals when the trend has changed. But sometimes it is not enough only using this indicator itself. So lets look 2 indicator together in one chart.
Look circle SSL is saying it is in downtrend but Coral is saying it has entered in uptrend. if we just look to coral signal it can misleads us. So it can be better to look another indicator for validating our signals.
3 — Heikin Ashi RSI Oscillator by JayRogers
The Heikin-Ashi technique is used by technical traders to identify a given trend more easily. Heikin-Ashi has a smoother look because it is essentially taking an average of the movement. There is a tendency with Heikin-Ashi for the candles to stay red during a downtrend and green during an uptrend, whereas normal candlesticks alternate color even if the price is moving dominantly in one direction. This indicator actually recalculates the RSI indicator with the logic of heikin ashi. Due to smoothing, the bars are formed with a slight lag, reflecting the trend rather than the exact price movement. So lets look the original version to understand more clearly. If red bars turn to green bars it means uptrend may begin, if green bars turn to red it means downtrend may begin.
As you see HARSI giving lots of signal some of them is really good but some of them are not very well. Because it gives so much signals Now i will change time period and lets look same chart again.
Now results are better because of heikin ashi's logic. it is not suitable for day traders, it gives more accurate result when using the time period is longer. But it can be useful to use this indicator in short time periods using with other indicators. So you may catch the trend changes more accurately.
4 — MACD DEMA by ToFFF
This indicator uses a double EMA and MACD algorithm to analyze the direction of the trend. Though it might seem a tough task to manage the trades with the help of MACD DEMA once you know how the proper way to interpret the signal lines, it will be an easy task.
This indicator also smoothens the signal lines with the time series algorithm which eventually makes the higher time frame important. So, expecting better results in the lower time frame can result in big losses as the data reading from the MACD DEMA will not be accurate. In order to understand the function of this indicator, you have to know the functions of the EMA also.
The exponential moving average tends to give more priority to the recent price changes. So, expecting better results when the volatility is very high is a very risky approach to trade the market. Moreover, the MACD has some lagging issues compared to the EMA, so it is super important to use a trading method that focuses on the higher time frame only. What does MACD 12 26 Close 9 mean? When the DEMA-9 crosses above the MACD(12,26), this is considered a bearish signal. It means the trend in the stock – its magnitude and/or momentum – is starting to shift course. When the MACD(12,26) crosses above the DEMA-9, this is considered a bullish signal. Lets see this indicator on Chart.
When the blue line crossover red line it is good time to buy. As you see from the chart i put arrows where the crossover are appeared.
When the red line crossover blue line it is good time to sell or exit from position.
5 — WaveTrend Oscillator by LazyBear
This is a technical indicator that creates high and low bands between two values. It then creates a trend indicator that draws waves with highs and lows within these boundaries. WaveTrend is a widely used indicator for finding direction of an asset.
Calculation period: number of candles used to calculate WaveTrend, defaults to 10. Averaging period: number of candles used to average WaveTrend, defaults to 21.
As you see in chart when the lines crossover occured my strategy gives buy or sell signals.
═════════════════════════════════════════════════════════════════════════
█ HOW TO USE
I hope you understand how the indicators I mentioned above work and what they are used for. Now, I will explain in detail how to use the strategy I have created.
When you enter the settings section, you will see 5 types of indicators. If you want to use the signals of the indicators, simply tick the box next to the indicators. Also, under each option there is an area where you can set the "lookback". This setting is a field that will make the signals overlap when you select more than one option. If you are going to trade with only one option, you should make sure that this field is 0. Otherwise, it may continue to generate as many signals as you choose.
Lets see in chart for easy understanding.
As you see chart, if i chose only HARSI with lookback 0 (HARSI and CORAL should be 1 minumum because of algorithm-we looking 1 bar before, others 0 because we are looking crossovers), it will give signals only when harsı bar's color changed. But when i changed Lookback as 7 it will be like this in chart.
Now i will choose 2 indicator with settings of their lookback 0.
As you see it will give signals when both of them occurs same time. But HARSI is an indicator giving very early signal so we can enter position 5-6 bars after the first bar color change. So i will change HARSI Lookback settings as 7. Lets look what happens when we use lookback option.
So it wil be useful to change lookback settings to find best signals in each time period and in each symbol. But it shouldnt be too high. Because you can be late to catch trend's starting.
this is an image of MACD and WAVE trend used and lookback option are both 6.
Now lets see an example with 3 options are chosen with lookback option 11-1-5
Now lets talk about indicators settings. After strategy options you will see each indicators settings, you can change their settings as you desired. So each indicators signal will be changed according to your adjustment.
I left strategy options with default settings. You can change it manually as if you want.
═════════════════════════════════════════════════════════════════════════
█ LIMITATIONS: Don't rely on non-standard charts results. For example Heikin Ashi is a technical analysis method used with the traditional candlestick chart.Heikin Ashi vs. Candlestick Chart: The decisive visual difference between Heikin Ashi and the traditional chart is that Heikin Ashi flattens the traditional candlestick chart using a modified formula.
The primary advantage of Heikin Ashi is that it makes the chart more reader-friendly and helps users identify and analyze trends .
Because Heikin Ashi provides averaged price information rather than real-time price and reacts slowly to volatility — not suitable for scalpers and high-frequency traders. I added HARSI indicator as a supportive signal because it is useful with using CORAL and SSL channel indicators. If you change your candle types to Heikin Ashi , your profit will change in good way but dont rely on it.
═════════════════════════════════════════════════════════════════════════
█ THANKS:
Special thanks to authors of the scripts that i used.
@LazyBear and @ErwinBeckers and @JayRogers and @ToFFF
═════════════════════════════════════════════════════════════════════════
█ DISCLAIMER
Any trade decisions you make are entirely your own responsibility.

R19 STRATEGYHello again.
Let me introduce you R19 Strategy I wrote for mostly BTC long/short signals
This is an upgrated version of STRATEGY R18 F BTC strategy.
I checked this strategy on different timeframes and different assest and found it very usefull for BTC 1 Hour and 5 minutes chart.
Strategy is basically takes BTC/USDT as a main indicator, so you can apply this strategy to all cryptocurrencies as they mostly acts accordingly with BTC itself (Of course you can change main indicator to different assets if you think that there is a positive corelation with. i.e. for BTC signals you can sellect DXY index for main indicator to act for BTC long/short signals)
Default variables of the inticator is calibrated to BTC/USDT 5 minute chart. I gained above %77 success.
Strategy simply uses, ADX, MACD, SMA, Fibo, RSI combination and opens positions accordingly. Timeframe variable is very important that, strategy decides according the timeframe you've sellected but acts within the timeframe in the chart. For example, if you're on the 5 minutes chart, but you've selected 1 hour for the time frame variable, strategy looks for 1 hour MACD crossover for opening a position, but this happens in 5 minutes candle, It acts quickly and opens the position.
Strategy also uses a trailing stop loss feature. You can determine max stoploss, at which point trailing starts and at which distance trailing follows. The green and red lines will show your stoploss levels according to the position strategy enters (green for long, red for short stop loss levels). When price exceeds to the certaing levels of success, stop loss goes with the profitable price (this means, when strategy opens a position, you can put your stop loss to the green/red line in actual trading)
You can fine tune strategy to all assets.
Please write down your comments if you get more successfull about different time zones and different assets. And please tell me your fine tuning levels of this strategy as well.
See you all.
