Dynamic ~ CVDDynamic - CVD is a smart, time-adaptive version of the classic Cumulative Volume Delta (CVD) indicator, designed to help traders visualize market buying and selling pressure across all timeframes with minimal manual tweaking.
Overview
Cumulative Volume Delta tracks the difference between buying and selling volume during each bar. It reveals whether aggressive buyers or sellers dominate the market, offering deep insight into real-time market sentiment and underlying momentum.
This version of CVD automatically adjusts its EMA smoothing length based on your selected timeframe, ensuring optimal sensitivity and consistency across intraday, daily, weekly, and even monthly charts.
Features
Dynamic EMA Length — Automatically adapts smoothing parameters based on the chart timeframe:
1–59 min → 50
1–23 h → 21
Daily & Weekly → 100
Monthly → 10
CVD Visualization — Displays cumulative delta to show the ongoing buying/selling imbalance.
CVD‑EMA Curve — Offers a clear trend signal by comparing the CVD line with its EMA.
Adaptive Color Logic — EMA curve changes color dynamically:
Green when CVD > EMA (bullish pressure)
Gray when CVD < EMA (bearish pressure)
How to Use
Use Dynamic - CVD to gauge whether the market is accumulating (net buying) or distributing (net selling).
When CVD rises above its EMA, it often signals consistent buying pressure and potential bullish continuation.
When CVD stays below its EMA, it highlights sustained selling pressure and possible weakness.
The dynamic EMA makes it suitable for scalping, swing trading, and longer-term trend analysis—no need to manually adjust settings.
Best For
Traders looking to measure real buying/selling flow rather than price movement alone.
Market participants who want a plug‑and‑play CVD that stays accurate across all timeframes.
Anyone interested in volume‑based momentum confirmation tools.
Disclaimer
This script is provided for educational and analytical purposes only. It does not constitute financial advice or a recommendation to buy or sell any asset. Past performance is not indicative of future results. Always perform your own analysis and consult a licensed financial advisor before making investment decisions. The author is not responsible for any financial losses or trading outcomes arising from the use of this indicator.
Forecasting

Unicorn Trade Indicator - Enhanced V1This code also contains pinescripts from iFVG (BPR) by Algorize and Visualizing displacement by tradeforopp who have kindly provided them as open source.
An ICT Unicorn is where a breaker block is traded through which incorporates a fair value gap. I decided to code this indicator as I couldn't find an existing free indicator on Trading View that performed adequately.
This indicator will highlight breaker blocks and when broken will post an Unicorn emoji and send an alert if requested. The last 3 breaker blocks are displayed, the prior boxes are labled PBB and are shown as red for bearish and green for bullish. After the main Unicorn is posted, the code continues to mark market structure shifts.
As all trading strategies work better with confluence I have added several other features which is very useful for people who are restricted on the number of indicators that can place on a single chart.
I have added iFVG (BPR) by Algoryze and Visualizing displacement by tradeforopp which have kindly been made open source by the authors. My thanks to them for their hard work.
Unicorn alerts will only be sent when a yellow displacement candle ( from the Visualizing displacement code) is present along with the Unicorn as this is the best type of Unicorn to trade.
The number of fvg's and bpr's from the code by Algoryze can be adjusted in the settings.
Also to add confluence I have used my own code to display liquidity depth boxes made popular by toodegrees.
I hope you find this indicator useful.

Liquidity Swap Detector Ultimate - Cedric JeanjeanAdvanced Smart Money Concepts indicator designed to detect high-probability liquidity sweeps and institutional order flow reversals. This professional-grade tool combines multiple ICT (Inner Circle Trader) strategies to identify optimal entry points.
═══════════════════════════════════════════════════════
📊 KEY FEATURES:
✅ Smart Swing Detection
- Identifies confirmed swing highs and lows using adaptive lookback periods
- Eliminates false signals through double-confirmation logic
- Detects liquidity grabs at key market structure points
✅ Fair Value Gap (FVG) Analysis
- Multi-timeframe FVG detection for enhanced accuracy
- Filters imbalances by minimum size threshold
- Combines current timeframe and higher timeframe FVGs
✅ Advanced Volatility Filter
- ATR-based volatility analysis to avoid low-quality setups
- Adjustable volatility threshold (default 0.35%)
- Ensures entries during optimal market conditions
✅ Precision Signal Generation
- LONG signals: Confirmed swing lows + FVG + volatility confirmation
- SHORT signals: Confirmed swing highs + FVG + volatility confirmation
- Clear visual markers with price labels
✅ Comprehensive Alert System
- Three alert types: Simple, Detailed, JSON (for webhooks)
- Separate LONG/SHORT alert controls
- Compatible with MT5 integration via webhooks
- TradingView native alertcondition support
✅ Professional Dashboard
- Real-time ATR monitoring
- Volatility percentage display
- FVG status indicator
- Alert status tracker
═══════════════════════════════════════════════════════
⚙️ CUSTOMIZABLE PARAMETERS:
🔹 Lookback Swing (1-50): Defines swing detection sensitivity
🔹 ATR Multiplier: Controls wick filter strength
🔹 Volatility Filter: Minimum required market volatility (%)
🔹 FVG Filter: Minimum fair value gap size (%)
🔹 FVG Timeframe: Higher timeframe for multi-TF analysis
🔹 Visual Options: Toggle swing marks, FVG zones, labels
🔹 Alert Controls: Enable/disable LONG/SHORT notifications
═══════════════════════════════════════════════════════
📈 HOW IT WORKS:
1. The indicator scans for confirmed swing points using a robust double-confirmation algorithm
2. Simultaneously analyzes Fair Value Gaps on both current and higher timeframes
3. Validates market volatility to ensure sufficient price movement
4. Generates precise entry signals when all conditions align
5. Triggers customizable alerts for instant notification
═══════════════════════════════════════════════════════
🎯 BEST PRACTICES:
- Use on liquid markets (Forex majors, indices, crypto)
- Recommended timeframes: 15m, 1H, 4H
- Combine with support/resistance for confirmation
- Adjust lookback period based on market volatility
- Test alert settings before live trading
- Use JSON alerts for automated trading integration
═══════════════════════════════════════════════════════
⚡ ALERT CONFIGURATION:
1. Click the Alert icon (bell) in TradingView
2. Select "Liquidity Swap Detector Ultimate - TITAN v6"
3. Choose your preferred alert condition:
- LONG Signal: Only bullish setups
- SHORT Signal: Only bearish setups
- ANY Signal: All trading opportunities
4. Set expiration and notification preferences
5. For MT5 integration: Select "JSON" message type and configure webhook URL

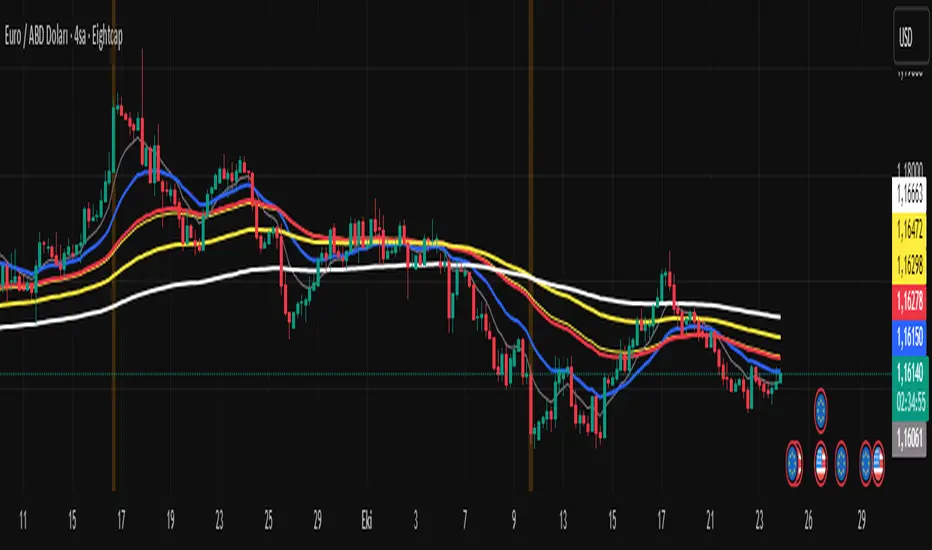
Fiyat - 55 EMA Uzaklık SinyaliThis indicator generates a signal when the price moves a certain percentage away from the 55-period Exponential Moving Average (EMA).
It helps traders identify when the market is stretched too far from its mean level, which can indicate potential reversal or continuation zones.
⚙️ How It Works
Calculates the 55 EMA on the selected chart.
Measures the percentage distance between the current price and the 55 EMA.
When the price distance exceeds the user-defined threshold (default: 0.50%), a visual signal (orange triangle) appears on the chart.
The background also highlights the signal candle.
🧩 Inputs
EMA Length: Default = 55 (can be changed).
Distance Threshold (%): Default = 0.50 → Change to detect stronger or weaker price deviations.
QQQ Price Levels + Custom LevelsThis indicator projects QQQ price levels onto any chart — ideal for traders who monitor Nasdaq futures (NQ), QQQ ETF, or correlated tech stocks.
It helps visualize where QQQ sits relative to your current instrument and lets you fully customize your view with user-defined colored levels.
QQQ Ladder Projection
Automatically plots a range of evenly spaced QQQ levels around the current QQQ price.
Adjustable multiplier for spacing.
Configurable line style (solid/dashed/dotted), color, and label offset.
Labels show “QQQ ” and move dynamically with chart scaling.
Six User-Defined QQQ Levels
- Type in up to six specific QQQ prices (e.g. key support/resistance or psychological levels).
- Each level has independent color, line width, and line style controls.
- Default theme: 3 red levels (resistance) and 3 green levels (support).
- Lines are projected onto the current chart’s price scale, even if it’s not QQQ.
Colored Overlay Labels
- Labels on the main QQQ ladder automatically recolor at your selected levels.
- A small box overlays the original label, matching your chosen line color for clear visual emphasis.
Dynamic Updates
- Choose to update on every tick or once per candle close.
- Compatible with intraday or higher-timeframe charts.

Custom Drawdown LevelsInput fields for three custom percentages.
Calculation of drawdown levels from the all-time high.
Plotting horizontal lines at those levels.

Alerts v6The strategy includes:
✅ EMA-based trend direction (fast vs slow)
✅ RSI filtering for overbought/oversold control
✅ ADX confirmation for strong trend validation
✅ Pullback & BOS detection for precision entries
✅ Per-bar change logic for adaptive entry timing
✅ Session/day gating to control trading hours
✅ JSON alert integration for AI trading bots or webhooks
This script is Pine Script v6 compatible and optimized for automated alert-based trading setups such as AI trading bots, webhook systems, and VPS-linked executions.
Recommended Timeframes: 5m, 15m, 30m
Markets: XAUUSD, FX pairs, indices, and metals

RSI to Price Projection PanelThis indicator calculates the current RSI based on the closing price and projects estimated prices for user-defined RSI target levels. Results are displayed in a table at the top-right corner of the chart.

Metallic Retracement ToolI made a version of the Metallic Retracement script where instead of using automatic zig-zag detection, you get to place the points manually. When you add it to the chart, it prompts you to click on two points. These two points become your swing range, and the indicator calculates all the metallic retracement levels from there and plots them on your chart. You can drag the points around afterwards to adjust the range, or just add the indicator to the chart again to place a completely new set of points.
The mathematical foundation is identical to the original Metallic Retracement indicator. You're still working with metallic means, which are the sequence of constants that generalize the golden ratio through the equation x² = kx + 1. When k equals 1, you get the golden ratio. When k equals 2, you get silver. Bronze is 3, and so on forever. Each metallic number generates its own set of retracement ratios by raising alpha to various negative powers, where alpha equals (k + sqrt(k² + 4)) / 2. The script algorithmically calculates these levels instead of hardcoding them, which means you can pick any metallic number you want and instantly get its complete retracement sequence.
What's different here is the control. Automatic zig-zag detection is useful when you want the indicator to find swings for you, but sometimes you have a specific price range in mind that doesn't line up with what the zig-zag algorithm considers significant. Maybe you're analyzing a move that's still developing and hasn't triggered the zig-zag's reversal thresholds yet. Maybe you want to measure retracements from an arbitrary high to an arbitrary low that happened weeks apart with tons of noise in between. Manual placement lets you define exactly which two points matter for your analysis without fighting with sensitivity settings or waiting for confirmation.
The interactive placement system uses TradingView's built-in drawing tools, so clicking the two points feels natural and works the same way as drawing a trendline or fibonacci retracement. First click sets your starting point, second click sets your ending point, and the indicator immediately calculates the range and draws all the metallic levels extending from whichever point you chose as the origin. If you picked a swing low and then a swing high, you get retracement levels projecting upward. If you went from high to low, they project downward.
Moving the points after placement is as simple as grabbing one of them and dragging it to a new location. The retracement levels recalculate in real-time as you move the anchor points, which makes it easy to experiment with different range definitions and see how the levels shift. This is particularly useful when you're trying to figure out which swing points produce retracement levels that line up with other technical features like previous support or resistance zones. You can slide the points around until you find a configuration that makes sense for your analysis.
Adding the indicator to the chart multiple times lets you compare different metallic means on the same price range, or analyze multiple ranges simultaneously with different metallic numbers. You could have golden ratio retracements on one major swing and silver ratio retracements on a smaller correction within that swing. Since each instance of the indicator is independent, you can mix and match metallic numbers and ranges however you want without one interfering with the other.
The settings work the same way as the original script. You select which metallic number to use, control how many power ratios to display above and below the 1.0 level, and adjust how many complete retracement cycles you want drawn. The levels extend from your manually placed swing points just like they would from automatically detected pivots, showing you where price might react based on whichever metallic mean you've selected.
What this version emphasizes is that retracement analysis is subjective in terms of which swing points you consider significant. Automatic detection algorithms make assumptions about what constitutes a meaningful reversal, but those assumptions don't always match your interpretation of the price action. By giving you manual control over point placement, this tool lets you apply metallic retracement concepts to exactly the price ranges you care about, without requiring those ranges to fit someone else's definition of a valid swing. You define the context, the indicator provides the mathematical framework.

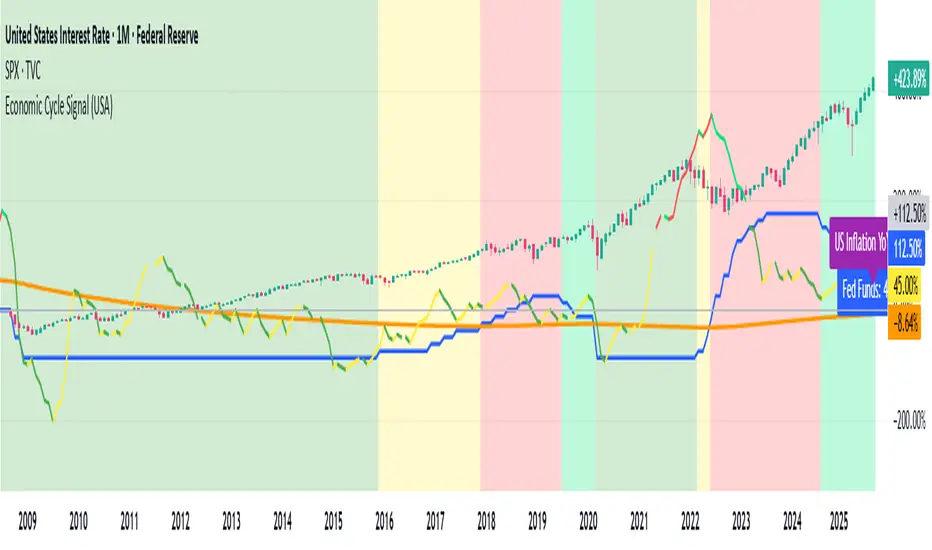
Economic Cycle Signal (USA)📊 Economic Cycle Signal (USA)
This indicator overlays both the U.S. Federal Reserve Funds Rate (Fed Funds) and the U.S. Inflation Rate YoY directly onto your stock market chart (e.g., S&P 500). It visually connects monetary policy and inflation dynamics with equity market performance, helping traders and analysts understand how macroeconomic shifts impact risk assets.
🔹 Key Features
• Plots the monthly U.S. Fed Funds Rate alongside your chart.
• Overlays the U.S. Inflation Rate YoY, offering a direct and realistic view of inflation pressure instead of CPI.
• Shades the background to reflect different economic cycle phases (recovery, recession, expansion, late cycle).
• Highlights how the stock market reacts during shifting monetary and inflationary conditions.
• Provides a clear traffic-light style signal for quick macro interpretation.
• Now includes dynamic inflation color logic based on the Fed’s 2% target and 5% threshold (explained below).
🔹 Inflation Line Color Logic (New)
The inflation line now changes color dynamically to show whether inflation is within or outside the Federal Reserve’s comfort zone, and whether it’s rising or falling:
Inflation Condition Interpretation Line Color
Inflation > 5% and Rising Inflation overheating (well above target) 🔴 Red
Inflation > 5% and Falling Cooling off from high levels 💚 Lime
Inflation < 5% and Falling Disinflation / stable price environment 🟢 Green
Inflation < 5% and Rising Early inflation rebound 🟡 Yellow
This color-coded logic mirrors the interest rate phase colors, giving traders an instant visual cue about inflationary pressure and possible policy turning points.
🔹 How Traders & Analysts Can Use It
• Visualize the interaction between U.S. monetary policy and inflation cycles in real time.
• Identify historically supportive phases when low or easing rates follow moderate inflation.
• Detect tightening cycles when inflation spikes first and the Fed reacts, signaling potential equity headwinds.
• Use as a macro compass to anticipate inflation pressure, policy changes, and market regime shifts.
• Combine with technical analysis, fundamentals, or leading indicators for deeper macro insights.
🔹 Color Legend (Economic Phases)
🟩 Light Green → Recovery (Early Cycle)
• Rates: low or falling
• Inflation: low/stable
🟩 Green → Recession (Down Cycle)
• Rates: cut aggressively
• Inflation: falling
🟨 Yellow → Expansion (Mid Cycle)
• Rates: rising gradually
• Inflation: moderate
🟥 Red → Overheating (Late Cycle)
• Rates: high / rising fast
• Inflation: high
🔹 Inflation Context
• Inflation typically leads the policy rate cycle, offering early insight into future Fed actions.
• The U.S. Inflation Rate YoY provides a direct measure of consumer price changes compared to the same month last year — a clearer gauge of inflation pressure than CPI.
• The new color logic helps visualize whether inflation is accelerating or cooling, relative to the Fed’s 2% target and 5% upper threshold.
• This dual-overlay makes it easy to interpret the cause (inflation) and effect (interest rate policy) in one synchronized chart.
⚠️ Disclaimer
This script is for educational and informational purposes only. It does not provide financial advice or trading signals. Always combine it with your own research, proper risk management, and professional judgment.
Economic Cycle Signal (Pakistan)📊 Economic Cycle Signal (Pakistan)
This indicator overlays both the Pakistan Policy Rate (PKINTR) and the Pakistan Inflation Rate YoY (PKIRYY) directly onto your KSE or Pakistan market chart. It visually connects monetary policy and inflation dynamics with market performance, helping traders and analysts understand how shifts in economic conditions impact risk assets in Pakistan.
🔹 Key Features
• Plots the monthly Pakistan Policy Rate alongside your chart.
• Overlays the Pakistan Inflation Rate YoY to track how price pressures evolve before policy rate adjustments.
• Shades the background to reflect different economic cycle phases (recovery, recession, expansion, late cycle).
• Highlights how equities and other risk assets react during shifting monetary and inflationary conditions.
• Provides a clear traffic-light style signal for quick macro interpretation.
• Now includes dynamic inflation color logic based on the State Bank of Pakistan’s (SBP) 5–7% target range and thresholds for overheating or cooling inflation.
🔹 Inflation Line Color Logic (New)
The inflation line color dynamically reflects whether inflation is within or outside SBP’s target range, and whether it’s rising or falling:
Inflation Condition Interpretation Line Color
Inflation > 7% and Rising Inflation overheating (well above SBP target) 🔴 Red
Inflation > 7% and Falling Cooling off from high levels 💚 Lime
Inflation < 5% and Falling Disinflation / stable price environment 🟢 Green
Inflation < 5% and Rising Early inflation rebound 🟡 Yellow
This adaptive color logic mirrors the interest rate cycle signals, helping traders instantly interpret Pakistan’s inflation trajectory and anticipate potential monetary policy turning points.
🔹 How Traders & Analysts Can Use It
• Visualize Pakistan’s monetary policy cycles and inflation trends in real time.
• Identify supportive phases when rate cuts or low policy rates follow controlled inflation.
• Detect tightening cycles when inflation spikes and the SBP reacts with rate hikes, often creating headwinds for equities.
• Use as a macro compass to anticipate inflation pressure, potential policy actions, and shifts in market risk appetite.
• Combine with technical analysis, fundamentals, or macro indicators for deeper insights into Pakistan’s economic conditions.
🔹 Color Legend (Economic Phases)
🟩 Light Green → Recovery (Early Cycle)
• Rates: low or falling
• Inflation: low/stable
🟩 Green → Recession (Down Cycle)
• Rates: cut aggressively
• Inflation: falling
🟨 Yellow → Expansion (Mid Cycle)
• Rates: rising gradually
• Inflation: moderate
🟥 Red → Overheating (Late Cycle)
• Rates: high / rising fast
• Inflation: high
🔹 Inflation Context
• SBP’s medium-term inflation target range is 5–7%, aimed at balancing growth and price stability.
• The script applies the same visual logic used in the U.S. version, now calibrated to Pakistan’s macro environment.
• The Pakistan Inflation Rate YoY (PKIRYY) line color shifts dynamically — clearly showing when inflation is rising above target, cooling, or stabilizing.
• This dual-overlay helps interpret both the cause (inflation) and effect (policy response) within Pakistan’s economic cycle, giving investors a clear macro perspective.
⚠️ Disclaimer
This script is for educational and informational purposes only. It does not provide financial advice or trading signals. Always combine it with your own research, proper risk management, and professional judgment.

Volume Surprise [LuxAlgo]The Volume Surprise tool displays the trading volume alongside the expected volume at that time, allowing users to spot unexpected trading activity on the chart easily.
The tool includes an extrapolation of the estimated volume for future periods, allowing forecasting future trading activity.
🔶 USAGE
We define Volume Surprise as a situation where the actual trading volume deviates significantly from its expected value at a given time.
Being able to determine if trading activity is higher or lower than expected allows us to precisely gauge the interest of market participants in specific trends.
A histogram constructed from the difference between the volume and expected volume is provided to easily highlight the difference between the two and may be used as a standalone.
The tool can also help quantify the impact of specific market events, such as news about an instrument. For example, an important announcement leading to volume below expectations might be a sign of market participants underestimating the impact of the announcement.
Like in the example above, it is possible to observe cases where the volume significantly differs from the expected one, which might be interpreted as an anomaly leading to a correction.
🔹 Detecting Rare Trading Activity
Expected volume is defined as the mean (or median if we want to limit the impact of outliers) of the volume grouped at a specific point in time. This value depends on grouping volume based on periods, which can be user-defined.
However, it is possible to adjust the indicator to overestimate/underestimate expected volume, allowing for highlighting excessively high or low volume at specific times.
In order to do this, select "Percentiles" as the summary method, and change the percentiles value to a value that is close to 100 (overestimate expected volume) or to 0 (underestimate expected volume).
In the example above, we are only interested in detecting volume that is excessively high, we use the 95th percentile to do so, effectively highlighting when volume is higher than 95% of the volumes recorded at that time.
🔶 DETAILS
🔹 Choosing the Right Periods
Our expected volume value depends on grouping volume based on periods, which can be user-defined.
For example, if only the hourly period is selected, volumes are grouped by their respective hours. As such, to get the expected volume for the hour 7 PM, we collect and group the historical volumes that occurred at 7 PM and average them to get our expected value at that time.
Users are not limited to selecting a single period, and can group volume using a combination of all the available periods.
Do note that when on lower timeframes, only having higher periods will lead to less precise expected values. Enabling periods that are too low might prevent grouping. Finally, enabling a lot of periods will, on the other hand, lead to a lot of groups, preventing the ability to get effective expected values.
In order to avoid changing periods by navigating across multiple timeframes, an "Auto Selection" setting is provided.
🔹 Group Length
The length setting allows controlling the maximum size of a volume group. Using higher lengths will provide an expected value on more historical data, further highlighting recurring patterns.
🔹 Recommended Assets
Obtaining the expected volume for a specific period (time of the day, day of the week, quarter, etc) is most effective when on assets showing higher signs of periodicity in their trading activity.
This is visible on stocks, futures, and forex pairs, which tend to have a defined, recognizable interval with usually higher trading activity.
Assets such as cryptocurrencies will usually not have a clearly defined periodic trading activity, which lowers the validity of forecasts produced by the tool, as well as any conclusions originating from the volume to expected volume comparisons.
🔶 SETTINGS
Length: Maximum number of records in a volume group for a specific period. Older values are discarded.
Smooth: Period of a SMA used to smooth volume. The smoothing affects the expected value.
🔹 Periods
Auto Selection: Automatically choose a practical combination of periods based on the chart timeframe.
Custom periods can be used if disabling "Auto Selection". Available periods include:
- Minutes
- Hours
- Days (can be: Day of Week, Day of Month, Day of Year)
- Months
- Quarters
🔹 Summary
Method: Method used to obtain the expected value. Options include Mean (default) or Percentile.
Percentile: Percentile number used if "Method" is set to "Percentile". A value of 50 will effectively use a median for the expected value.
🔹 Forecast
Forecast Window: Number of bars ahead for which the expected volume is predicted.
Style: Style settings of the forecast.

Match on Selectable Percentage Change + RangeIndicator Overview:
Match on Selectable Percentage Change + Range is a powerful analytical tool designed for traders and analysts who want to identify historical price bars that match a specific percentage variation, and then evaluate how price evolved in the following days. It combines precision filtering with visual tabular feedback, making it ideal for pattern recognition, backtesting, and scenario analysis.
What It Does
This indicator scans historical bars to find instances where the percentage change between two consecutive closes matches a user-defined target (± a customizable tolerance). Once matches are found, it displays:
The date of each match (most recent first)
The actual variation searched
The percentage change after 2, 10, 20, and 30 bars
The min-max range (in %) over those same periods
All results are shown in a dynamic table directly on the chart.
Inputs & Controls
Input Description
Which variation do you want to analyze? (%)
Set the target percentage change to look for (e.g. 2.5%)
% deviation from the variation to be considered (%) Define the tolerance range around the target (e.g. ±0.5%)
Bars to analyze (max 9999) Set how many past bars to scan
Show match table Toggle to enable/disable the entire table
Show percentage variations (2d, 10d, 20d, 30d) Toggle to show/hide post-match percentage changes
Show min-max ranges (2d, 10d, 20d, 30d) Toggle to show/hide post-match high/low ranges
Table Structure
Each row in the table represents a historical match. Columns include:
Date: When the match occurred
Variation in: The actual % change that triggered the match
2d / 10d / 20d / 30d: % change after those days
Min-Max 2d / 10d / 20d / 30d: Range of price movement after those days
Color coding helps quickly identify bullish (green) vs bearish (red) outcomes.
Use Cases
Backtesting: See how similar past moves evolved over time
Scenario modeling: Estimate potential outcomes after a known variation
Pattern recognition: Spot recurring setups or volatility clusters
Risk analysis: Understand post-variation drawdowns and upside potential
Tips for Use
Use tighter deviation (e.g. 0.3%) for precision, or wider (e.g. 1%) for broader pattern capture.
Combine with other indicators to validate setups (e.g. volume, RSI, trend filters).
Toggle off variation or range columns to focus only on the metrics you need.

Cyclical Phases of the Market🧭 Overview
“Cyclical Phases of the Market” automatically detects major market cycles by connecting swing lows and measuring the average number of bars between them.
Once it learns the rhythm of past cycles, it projects the next expected cycle (in time and price) using a dashed orange line and a forecast label.
In simple terms:
The indicator shows where the next potential low is statistically expected to occur, based on the timing and depth of previous cycles.
⚙️ Core Logic – Step by Step
1️⃣ Pivot Detection
The script uses the built-in ta.pivotlow() and ta.pivothigh() functions to find local turning points:
pivotLow marks a local swing low, defined by pivotLeft and pivotRight bars on each side.
Only confirmed lows are used to define the major cycle points.
Each new pivot low is stored in two arrays:
cycleLows → price level of the low
cycleBars → bar index where the low occurred
2️⃣ Cycle Identification and Drawing
Every time two consecutive swing lows are found, the indicator:
Calculates the number of bars between them (cycle length).
If that distance is greater than or equal to minCycleBars, it draws a teal line connecting the two lows — visually representing one complete cycle.
These teal lines form the historical cycle structure of the market.
3️⃣ Average Cycle Length
Once there are at least three completed cycles, the script calculates the average duration (mean number of bars between lows).
This value — avgCycleLength — represents the dominant periodicity or cycle rhythm of the market.
4️⃣ Forecasting the Next Cycle
When a valid average cycle length exists, the model projects the next expected cycle:
Time projection:
Adds avgCycleLength to the last cycle’s ending bar index to find where the next low should occur.
Price projection:
Estimates the vertical amplitude by taking the difference between the last two cycle lows (priceDiff).
Adds this same difference to the last low price to forecast the next probable low level.
The result is drawn as an orange dashed line extending into the future, representing the Next Expected Cycle.
5️⃣ Forecast Label
An orange label 🔮 appears at the projected future point showing:
Text:
🔮 Upcoming Cycle Forecast
Price:
The label marks the probable area and timing of the next cyclical low.
(Note: the date/time calculation currently multiplies bar count by 7 days, so it’s designed mainly for daily charts. On other timeframes, that conversion can be adapted.)
📊 How to Read It on the Chart
Visual Element Meaning Interpretation
Teal lines Completed historical cycles (low to low) Show actual periodic rhythm of the market
Orange dashed line Projection of the next expected cycle Anticipated path toward the next cyclical low
Orange label 🔮 Upcoming Cycle Forecast Displays expected price and bar location
Average cycle length Internal variable (bars between lows) Represents the dominant cycle period
📈 Interpretation
When teal segments show consistent spacing, the market is following a stable rhythm → cycles are predictable.
When cycle spacing shortens, the market is accelerating (volatility rising).
When it widens, the market is slowing down or entering accumulation.
The orange dashed line represents the next expected low zone:
If the market drops near this line → cyclical pattern confirmed.
If the market breaks well below → cycle amplitude has increased (trend weakening).
If the market rises above and delays → a new longer cycle may be forming.
🧠 Practical Use
Combine with oscillators (e.g., RSI or TSI) to confirm momentum alignment near projected lows.
Use in conjunction with volume to identify accumulation or exhaustion near the expected turning point.
Compare across timeframes: weekly cycles confirm long-term rhythm; daily cycles refine short-term entries.
⚡ Summary
Aspect Description
Purpose Detect and forecast recurring market cycles
Cycle basis Low-to-Low pivot analysis
Visuals Teal historical cycles + Orange forecast line
Forecast Next expected low (price and time)
Ideal timeframe Daily
Main outputs Average cycle length, next projected cycle, visual cycle map

PDB 4 MA + Candle Strength/Weakness Detector
4MA Strength & Reversal Detector
Unlock the power of momentum with this advanced 4 Moving Average system (20, 50, 100, 200) designed to pinpoint market strength and early reversal zones with precision.
How It Works:
- Bearish Reversal: Triggered when all moving averages align (20 < 50 < 100 < 200) and bearish reversal candles appear — highlighting potential tops.
- Bullish Reversal: Triggered when all moving averages align (200 < 100 < 50 < 20) and bullish reversal candles form — marking potential bottoms
:Best For:
⚡ Scalpers and day traders using 1–5 minute timeframes
📈 Identifying momentum shifts and trend exhaustion early
Tip: Combine this with volume or RSI for stronger confirmation and fewer false signals.

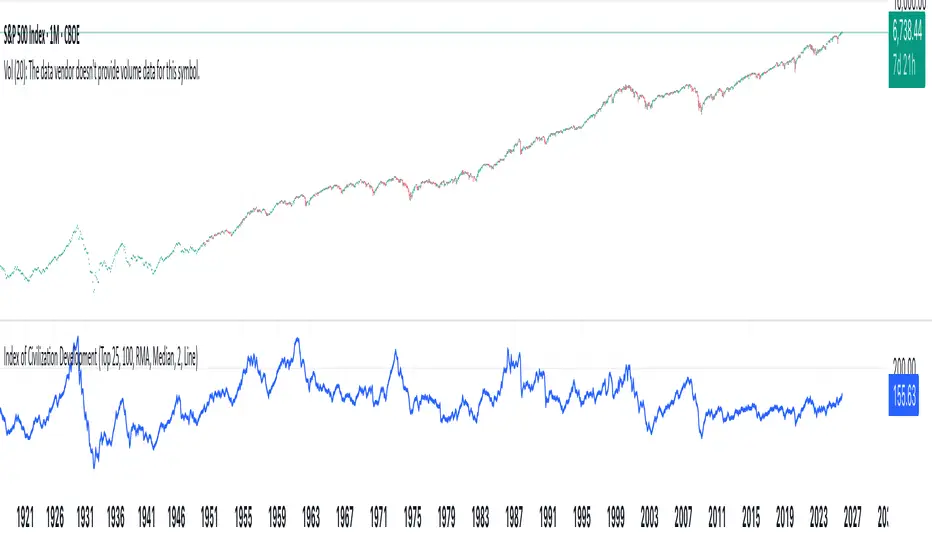
Index of Civilization DevelopmentIndex of Civilization Development Indicator
This Pine Script (version 6) creates a custom technical indicator for TradingView, titled Index of Civilization Development. It generates a composite index by averaging normalized stock market performances from a selection of global country indices. The normalization is relative to each index's 100-period simple moving average (SMA), scaled to a percentage (100% baseline). This allows for a comparable "development" or performance metric across diverse markets, potentially highlighting trends in global economic or "civilizational" progress based on equity markets.The indicator plots as a single line in a separate pane (non-overlay) and is designed to handle up to 40 symbols to respect TradingView's request.security() call limits.Key FeaturesComposite Index Calculation: Fetches the previous bar's close (close ) and its 100-period SMA for each selected symbol.
Normalizes each: (close / SMA(100)) * 100.
Averages the valid normalizations (ignores invalid/NA data) to produce a single "Index (%)" value.
Symbol Selection Modes:Top N Countries: Selects from a predefined list of the top 50 global stock indices (by market cap/importance, e.g., SPX for USA, SHCOMP for China). Options: Top 5, 15, 25, or 50.
Democratic Countries: ~38 symbols from democracies (e.g., SPX, NI225, NIFTY; based on democracy indices ≥6/10, including flawed/parliamentary systems).
Dictatorships: ~12 symbols from authoritarian/hybrid regimes (e.g., SHCOMP, TASI, IMOEX; scores <6/10).
Customization:Line color (default: blue).
Line width (1-5, default: 2).
Line style: Solid line (default), Stepline, or Circles.
Data Handling:Uses request.security() with lookahead enabled for real-time accuracy, gaps off, and invalid symbol ignoring.
Runs calculations on every bar, with max_bars_back=2000 for historical depth.
Arrays are populated only on the first bar (barstate.isfirst) for efficiency.
Predefined Symbol Lists (Examples)Top 50: SPX (USA), SHCOMP (China), NI225 (Japan), ..., BAX (Bahrain).
Democratic: Focuses on free-market democracies like USA, Japan, UK, Canada, EU nations, Australia, etc.
Dictatorships: Authoritarian markets like China, Saudi Arabia, Russia, Turkey, etc.
Usage TipsAdd to any chart (e.g., daily/weekly timeframe) to view the composite line.
Ideal for macro analysis: Compare democratic vs. authoritarian performance, or track "top world" equity health.
Potential Limitations: Relies on TradingView's symbol availability; some exotic indices (e.g., KWSEIDX) may fail if not supported. The 40-symbol cap prevents errors.
Interpretation: Values >100 indicate above-trend performance; <100 suggest underperformance relative to recent averages.
This script blends financial data with geopolitical categorization for a unique "civilization index" perspective on global markets. For modifications, ensure symbol tickers match TradingView's format.
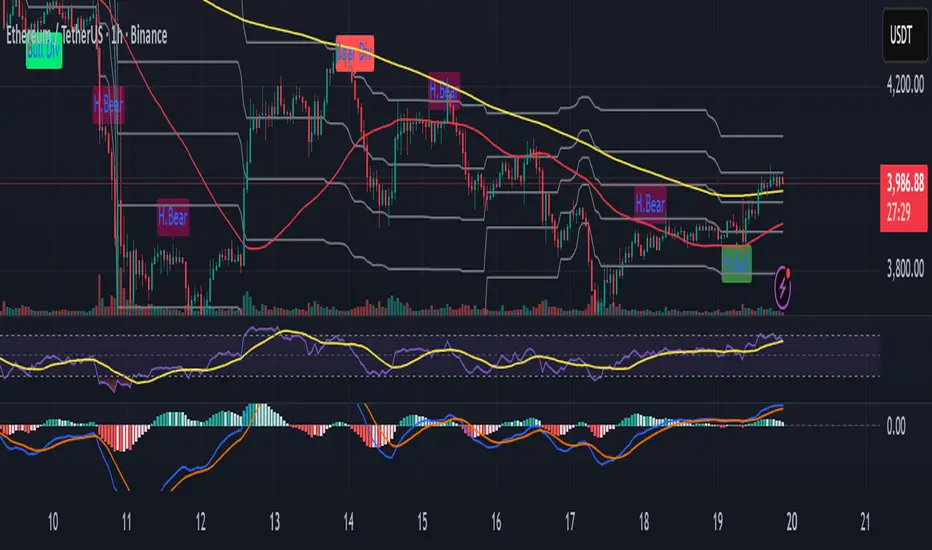
PAMASHAIn this version of 19 OCT 001 UPDATE, this Indicator forecast the future by indicating Hidden divergences and regular Divergences. Besides, it will distinguish order blocks, FVGs, ... .
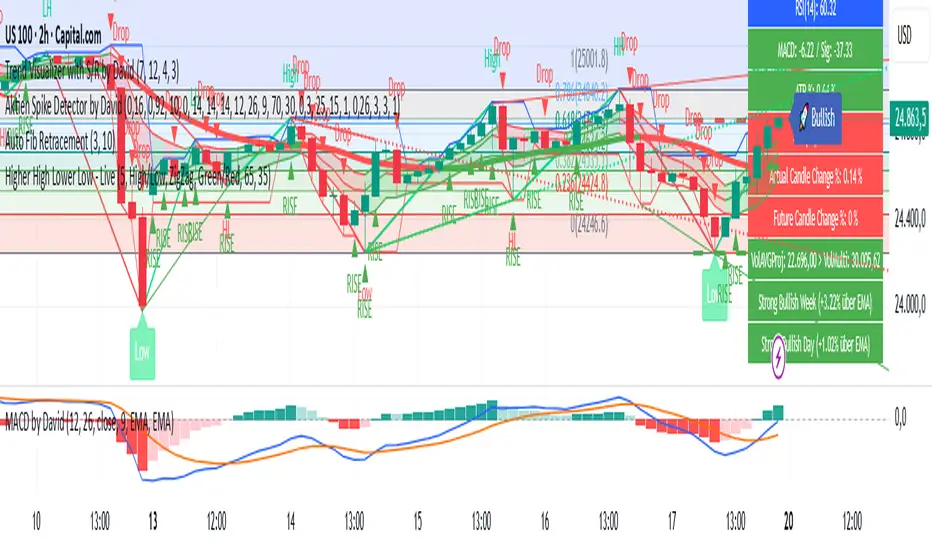
Aktien Spike Detector by DavidDescription:
This indicator marks the daily high and low on the chart and provides a visual and audible alert whenever the current price touches either of these levels. Additionally, the indicator highlights the candlestick that reaches the daily high or low to quickly identify significant market movements or potential reversal points.
Features:
📈 Daily high and low are automatically calculated and displayed as lines on the chart.
🔔 Alert notification when the price touches the daily high or low.
🕯️ Highlighting of the touch candlestick (e.g., color-coded) for better visual orientation.
💡 Ideal for traders trading breakouts, rejections, or intraday reversals.
Areas of application:
Perfect for day traders, scalpers, and intraday analysts who want to see precisely when the market reaches key daily levels.
Tristan's Devil Mark (Short / Long, with W%R)The Devil’s Mark indicator is a visual tool designed to help traders identify potential short and long opportunities based on candle structure and market momentum. It combines price action analysis with the Williams %R (W%R) oscillator to highlight candles with high potential for reversal or continuation.
Can be used on any timeline, from scalping day trades to swing trades on daily and higher timelines. Know that the higher the timeline the less likely the indicator will show. (Asia and London sessions tend to show many indicators. I find this more useful for NY session.)
How the script works
Candle Structure Conditions
Short (Sell) Wedge: Plotted above green candles that have no bottom wick, indicating that inside that candle there was strong upward momentum without downside hesitation .
Long (Buy) Wedge: Plotted below red candles that have no top wick, indicating that inside that candle there was strong downward momentum without upside hesitation .
These candles are visually emphasized as wedges to mark potential turning points.
Williams %R Filter
The indicator uses Williams %R to measure overbought and oversold conditions:
Proximity to 0 (nearZeroThresh): Determines how close W%R must be to 0 (overbought) to trigger a Sell Wedge. This acts as a “Sell sensitivity” filter.
Proximity to -100 (nearHundredThresh): Determines how close W%R must be to -100 (oversold) to trigger a Buy Wedge. This acts as a “Buy sensitivity” filter.
When the candle meets both the candle structure and the W%R condition, the wedge is plotted in purple (“Within W%R Range”).
When the "ignore W%R filter" toggle is on, all eligible candles are plotted regardless of W%R. Wedges that normally would not meet W%R criteria are plotted in light purple (“Outside W%R Range”) to distinguish them. #YOLO (🚫 I recommend leaving "Ignore W%R Filter" OFF)
Settings Explained
Williams %R Length: The number of bars used to calculate the W%R oscillator. Shorter lengths make it more sensitive; longer lengths smooth the readings.
Proximity to 0 / 100: Controls how “strict” the indicator is in requiring overbought or oversold W%R conditions to trigger. Lower values mean closer to extreme zones, higher values are more permissive.
Ignore W%R Toggle: Option to show Devil’s Marks on every eligible candle regardless of W%R. Useful for visualizing purely price-action-based signals.
What the trader sees
Purple wedges: Candles meeting both candle structure and W%R conditions.
Light purple wedges: Candles meeting candle structure but ignored W%R (when toggle is on). #YOLO (🚫 I recommend leaving "Ignore W%R Filter" OFF)
Short opportunities are wedges above bars (green candles with no bottom wick).
Long opportunities are wedges below bars (red candles with no top wick).
Trading Insight
The Devil’s Mark is a momentum and reversal alert tool:
Look for purple downward-pointing wedges when W%R is near overbought. This is a potential shorting opportunity. Buying at the close of that candle may improve your short trades.
Look for purple upward-pointing wedges when W%R is near oversold. This is a potential
long opportunity. Buying at the close of that candle may improve your long trades.
Light purple wedges show the same price-action cues without W%R confirmation—useful for aggressive traders who want every potential setup. #YOLO #YMMV #noFullPort
Settings / Security
The “Output values” checkbox appears for each plotted series (like a plot or plotshape) and controls whether the series will also be exposed numerically in the Data Window or used by other indicators/scripts.
Here’s what it means in practice:
1. Checked (true)
The series values (like candle high, low, or any computed value) are exported to the Data Window and can be read by other scripts using request.security() or ta functions.
Example: You can see the exact numerical value of each plotted point in the Data Window when you hover over the chart.
Useful if you want to backtest or reference these plotted values programmatically.
2. Unchecked (false)
The series is plotted visually only.
The numeric values are hidden from the Data Window and cannot be accessed by other scripts.
Makes the chart cleaner if you don’t need the numeric outputs.

CE+ZLSMA RovTrading StrateryThe strategy is optimized for scalping in small timeframes like M15 and M30, as well as M5.
It combines two indicators: CE and ZLSMA.
Try it now!

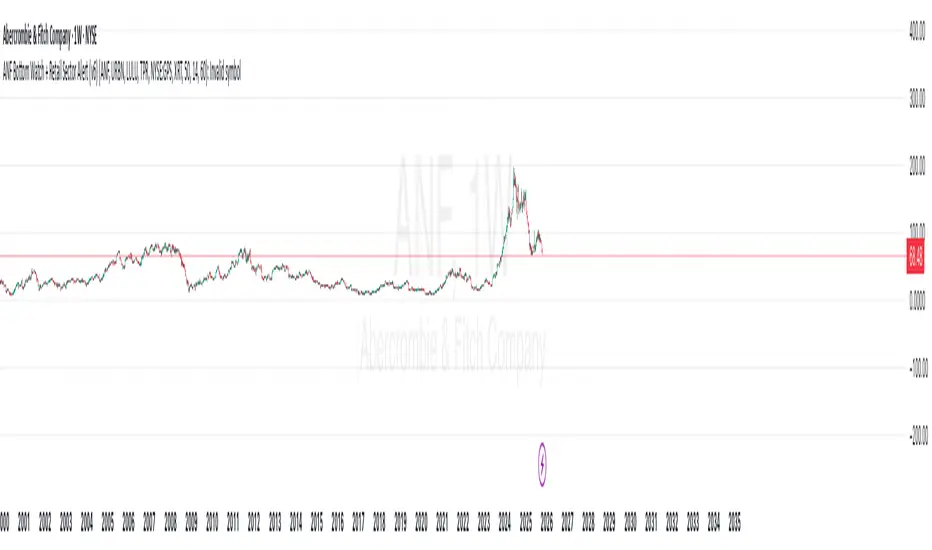
ANF Bottom Watch + Retail Sector Alert (v6) Detect when ANF crosses above its 50-day moving average (technical recovery signal).
Show visual + alert when RSI recovers above 40 (momentum bottom confirmation).
Track peer strength (URBN, LULU, TPR, GPS) — if 3+ peers are trading above their own 50-day MA, the script flags a sector rotation (bullish context).
Give a “Bottom Watch Active” label when all three signals align.
Swing AURORA v4.0 — Refined Trend Signals### Swing Algo v4.0 — Refined Trend Signals
#### Overview
Swing Algo v4.0 is an advanced technical indicator designed for TradingView, built to detect trend changes and provide actionable buy/sell signals in various market conditions. It combines multiple technical elements like moving averages, ADX for trend strength, Stochastic RSI for timing, and RSI divergence for confirmation, all while adapting to different timeframes through auto-tuning. This indicator overlays on your chart, highlighting trend regimes with background colors, displaying buy/sell labels (including "strong" variants), and offering early "potential" signals for proactive trading decisions. It's suitable for swing trading, trend following, or as a filter for other strategies across forex, stocks, crypto, and other assets.
#### Purpose
The primary goal of Swing Algo v4.0 is to help traders identify high-probability trend reversals and continuations early, reducing noise and false signals. It aims to provide clear, non-repainting signals that align with market structure, volatility, and momentum. By incorporating filters like higher timeframe (HTF) alignment, bias EMAs, and divergence, it refines entries for better accuracy. The indicator emphasizes balanced performance across aggressive, balanced, and conservative modes, making it versatile for both novice and experienced traders seeking to optimize their decision-making process.
#### What It Indicates
- **Trend Regimes (Background Coloring)**: The chart background changes color to reflect the current market regime:
- **Green (Intense for strong uptrends, faded when cooling)**: Indicates bullish trends where price is above the baseline and EMAs are aligned upward.
- **Red/Maroon (Intense maroon for strong downtrends, faded red when cooling)**: Signals bearish trends with price below the baseline and downward EMA alignment.
- **Faded Yellow**: Marks "no-trade" zones or potential trend changes, where conditions are choppy, weak, or neutral (e.g., low ADX, near baseline, or low volatility).
- **Buy/Sell Signals**: Labels appear on the chart for confirmed entries:
- "BUY" or "STRONG BUY" for bullish signals (strong variants require higher scores and optional divergence).
- "SELL" or "STRONG SELL" for bearish signals.
- **Potential Signals**: Early warnings like "Potential BUY" or "Potential SELL" appear before full confirmation, allowing traders to anticipate moves (confirmed after a few bars based on the trigger window).
- **Divergence Marks**: Small "DIV↑" (bullish) or "DIV↓" (bearish) labels highlight RSI divergences on pivots, adding confluence for strong signals.
- **Lines**: Optional plots for baseline (teal), EMA13/21 (lime/red based on crossover), providing visual trend context.
Signals are anchored either to the current bar or confirmed pivots, ensuring alignment with price action. The indicator avoids repainting by confirming on close if enabled.
#### Key Parameters and Customization
Swing Algo v4.0 offers minimal yet efficient parameters for fine-tuning, with defaults optimized for common use cases. Most can be auto-tuned based on timeframe for simplicity:
- **Confirm on Close (no repaint)**: Boolean (default: true) – Ensures signals don't repaint by waiting for bar confirmation.
- **Auto-tune by Timeframe**: Boolean (default: true) – Automatically adjusts lengths and sensitivity for 5-15m, 30-60m, 2-4h, or higher frames.
- **Mode**: String (options: Aggressive, Balanced , Conservative) – Controls signal thresholds; Aggressive for more signals, Conservative for fewer but higher-quality ones.
- **Signal Anchor**: String (options: Pivot (divLB) , Current bar) – Places labels on confirmed pivots or the current bar.
- **Trigger Window (bars)**: Integer (default: 3) – Window for signal timing; auto-tuned if enabled.
- **Baseline Type**: String (options: HMA , EMA, ALMA) – Core trend line; lengths auto-tune (e.g., 55 for short frames).
- **Use Bias EMA Filter**: Boolean (default: false) – Adds a long-term EMA for trend bias.
- **Use HTF Filter**: Boolean (default: false) – Aligns with higher timeframe (auto or manual like 60m, 240m, D); override for stricter scoring.
- **Sensitivity (10–90)**: Integer (default: 55) – Adjusts ADX threshold for trend detection; higher = more sensitive.
- **Use RSI-Stoch Trigger**: Boolean (default: true) – Enables Stochastic RSI for entry timing; customizable lengths, smooths, and levels.
- **Use RSI Divergence for STRONG**: Boolean (default: true) – Requires divergence for strong signals; pivot lookback (default: 5).
- **Visual Options**: Booleans for background regime, labels, divergence marks, and lines (all default: true).
These parameters are grouped for ease, with tooltips in TradingView for quick reference. Start with defaults and tweak based on backtesting.
#### How It Works
At its core, Swing Algo v4.0 calculates a baseline (e.g., HMA) to define the trend direction. It then scores potential buys/sells using factors like:
- **Trend Strength**: ADX above a dynamic threshold, combined with EMA crossovers (13/21) and slope analysis.
- **Volatility/Volume**: Bollinger/Keltner squeeze exits, volume z-score, and ATR filters to avoid choppy markets.
- **Timing**: Stochastic RSI crossovers or micro-timing via DEMA/TEMA for precise entries.
- **Filters**: Bias EMA, HTF alignment, gap from baseline, and no-trade zones (weak ADX, near baseline, low vol).
- **Divergence**: RSI pivots confirm strong signals.
- **Scoring**: Buy/sell scores (min 3-5 based on mode) trigger labels only when all gates pass, with early "potential" detection for foresight.
The algorithm processes these in real-time, auto-adapting to timeframe for efficiency. Signals flip only on direction changes to prevent over-trading. For best results, use on liquid assets and combine with risk management.
#### Disclaimer
This indicator is for educational and informational purposes only and does not constitute financial advice, investment recommendations, or trading signals. Trading involves significant risk of loss and is not suitable for all investors. Past performance is not indicative of future results. Always backtest the indicator on your preferred assets and timeframes, and consult a qualified financial advisor before making any trading decisions. The author assumes no liability for any losses incurred from using this script. Use at your own risk.
