Road To DubaiROAD TO DUBAI
Useful for daily trading over all type of asset, from Stock to Crypto, Forex and Commodities. It works best with 5min to 1hr graphs, if you are a intraday trader.
This is not a simple mashup of indicators, because you can add them as your own.
This script is more like a tool to understand price action based on indicators position . Thanks to cross call based on MACD , RSI with EMA applied and few index realtime mapping, this tool will let you reduce time effort for graph analysis .
As extra feature it will let you to try different strategies , all fully customizable.
I've tried my best to keep it readble, and easy to use. The best way to learn to use it, is to disable all features from configuration and try one by one.
CONFIGURATION TIPS : Click "Settings Gear" in the Upper Right Corner and disable "Indicator Arguments"
HOW TO PROPER SETUP
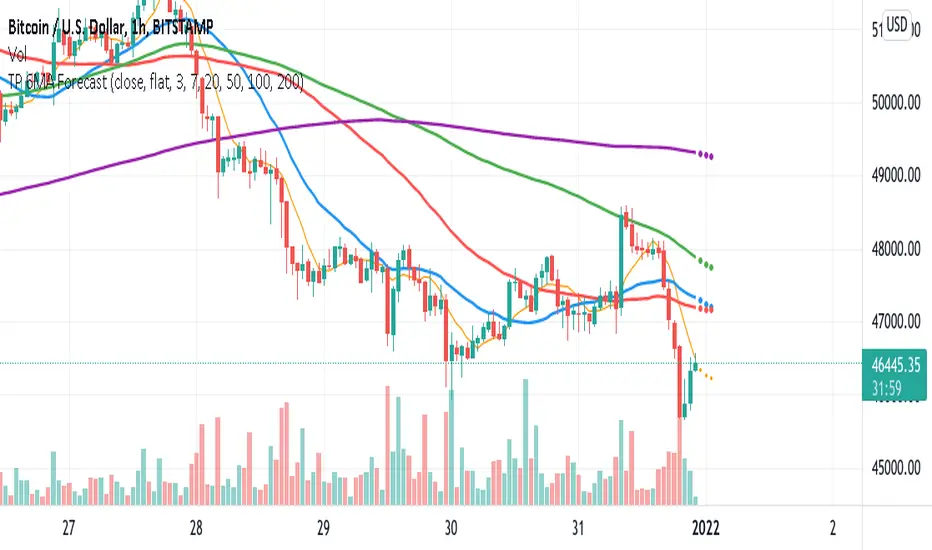
Road to Dubai 3 is semiautomatic on finding best Long and Short areas, and plot on the chart.
From configuration menu you can set a Backtrace period and sensibility for RSI EMA10, RSI EMA80 and MACD on your Timeframe, 5min, 30min, 60min.
Usually when configured, those parameters works fine on almost every asset.
You only need to start understanding signals.
STANDARD FEATURES
VWAP : Green/Red line. It will reset everyday at 00.00.
EMA80 : White Line
BLUELINES : Positive and negative overextend value from VWap . This is based on a range of bar and it will extend on the opposite side the lower or higher candle. Useful for understading where price can arrive, expecially if a spike will appear.
Those indicators are quite useful for understading trends, price positions and maximum price range.
RSI EMA10 OVERBOUGHT / OVERSOLD
Yellow arrow marks where RSI arrived at his Top or Bottom. If on different timeframes (5min, 30min and 60min) something similar happen area is filled with Red or Green.
This is base on EMA10 applied to RSI (I usually refer at it as Yellow Line on my indicator HighFreq Trader)
To find good values please try High Freq Trader 1.3
RSI EMA80 CALL
Red Cross or Green Square advice for a really potential inversion of trend. When a Silver bar appear, this means the same call was triggered on different Timeframe in the sametime.
This is based on EMA80 applied to RSI (I usually refer at it as Blue Line on my indicator HighFreq Trader).
To find good values please try High Freq Trader 1.3
MACD CALL
Based on MACD with standard settings. When triggered, a lime Triangle appears. Differents size based on timeframe (5min smaller, 60min bigger). If the same call is triggered on the same place a Lime Bar appear on the opposite side of trend (this is a graphical contents, bacause with all enabled, standard use, can be difficult to read signals).
In Menu Settings you will be able to set your best parameter for your asset.
MACD FIBONACCI EXTRA FEATURE
If you want you can enable a Fibonacci draw based on MACD . This works at his best (on my opinion) with 30min MACD
EXAMPLE
NATURAL GAS
In this chart 30min you can see all calls triggered for a Short. Yellow RSI Arrow, Red Cross, Macd Triangle and Colored Red, Lime and Silver Bars are all calling for Short.
In this way you can see in notime if this can be a perfect moment for take position
VIX VXN DXY CALLS
If VIX , VXN is triggered a small Green Dot will appear. If both are in the same time a bigger Dot appear. Very useful to find trend inversion.
If DXY is triggered a Red Dot will appear (only on Daily Chart ). Very Useful to understand trend inversion on whole market.
VOLUMES REMINDERS
Find if there was an High Volume traded (HV) or Low Volume Traded (LV) in the near past. Useful to understand if some tricky situation could happen (like a sudden sell, an accumulation or distribution)
Forecast

BTC Active Address Trend (On-chain)This indicator compares the % change in BTC price and the % change in BTC’s active addresses (BTC’s utility value).
1. % changes in BTC price & active addresses
- Orange line: BTC’s price change (%)
- Gray line: BTC’s active address change (%)
- Red/Yellow/Green lines: Bollinger bands for change in active address
2. Trend:
- Green circles: Bullish Sentiment Trend
Market sentiment is bullish and BTC price outgrows the increase in its utility value (overpricing)
- Red circles: Bearish Sentiment Trend
Market sentiment is bearish and BTC price drops more than the decrease in its utility value (underpricing)
3. Potential Re-Entries:
- Green/Red triangles: potential bullish/bearish entries
When % change of BTC price gets similar to that of active addresses
*Not financial advice.

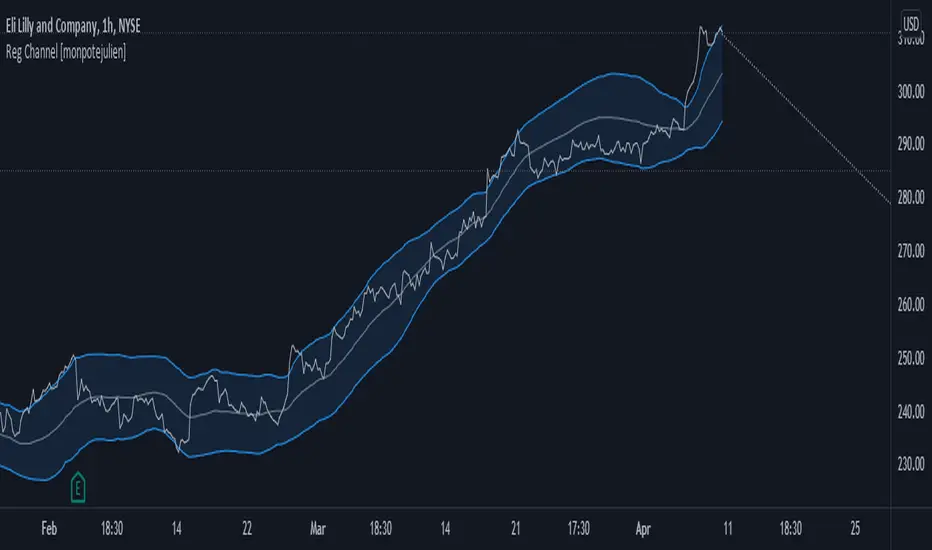
Regression Channel with projectionEXPERIMENTAL:
Auto adjusting regressive channel with projection.
Linear regression is a linear approach to modeling the relationship between a dependent variable and one or more independent variables.
In linear regression , the relationships are modeled using linear predictor functions whose unknown model parameters are estimated from the data.
Disclaimer :
Success in trading is all about following your trading strategy and indicators should fit into your own strategy, and not be traded purely on.
This script is for informational and educational purposes only. Use of the script does not constitute professional and / or financial advice. You are solely responsible for evaluating the outcome of the script and the risks associated with using the script. In exchange for the use of the script, you agree not to hold monpotejulien TradingView user responsible for any possible claims for damages arising out of any decisions you make based on the use of the script.
ZigZag Channel with projection forecastThis indicator is created on top of existing Zigzag indicator .
The projection channel starts at the end of the last ZigZag line.
Disclaimer
Success in trading is all about following your trading strategy and indicators should fit into your own strategy, and not be traded purely on.
This script is for informational and educational purposes only. Use of the script does not constitute professional and / or financial advice. You are solely responsible for evaluating the outcome of the script and the risks associated with using the script. In exchange for the use of the script, you agree not to hold monpotejulien TradingView user responsible for any possible claims for damages arising out of any decisions you make based on the use of the script.

Easy AspectsHi Traders,
Planetary Aspects divided into 2 parts, Hard (Square and Opposition) & Easy (Trine and Sextile) Aspects, the Conjunction is depending on the planets.
This Easy Aspects script, contains:
1. Trine is an angle of 120°, which is 1/3 of the 360° ecliptic
2. Sextile is an angle of 60°, which is 1/6 of the 360° ecliptic or 1/2 a trine (120°)
The objectives of this script are:
1. you can see the Hard Aspects schedule in certain periods, history and future.. (you can double check it in horoscopes.astro-seek.com )
2. this script allows you see based on specific aspect view, you can observe the correlation between the hard aspects and market reaction (is it turning or is it a swinghigh/ low?
Here are some examples;
TRINE
Sextile
Moon Phase , Eclipse & 4 SeasonsHi Traders,
This script is a little bit different than the others Moon Phase scripts, added Moon Eclipse and 4 Seasons..
The objectives of this script:
1. you can see the Moon Phase schedule at certain periods (you can double check it in mooncalendar.astro-seek.com)
2. you can see the correlation between the Moon Phase and market reaction
3. you can see the correlation between the Moon Eclipse and market reaction
4. you can see the correlation between the 4 Seasons and market reaction
Those Dates are the Moon Phase (history & future), so when the Moon Phase arrived, we can forecast the turning or swinghigh/low in the market (cryptos, stocks, commoditties & indexes), the turning or swinghigh/low is +/- 1 day.
Those lines are just a simply vertical lines that can help us backtest easily, hopefully we can take profit from this Moon Phase..
New Moon & Full Moon
New Moon
Full Moon
Moon Eclipse
4 Seasons (Spring Equinox, Summer Solstice, Autumn Equinox, Winter Solstice)
Cubic Bézier Curve Extrapolation [LuxAlgo]The following script allows for the extrapolation of a Cubic Bézier Curve fit using custom set control points and can be used as a drawing tool allowing users to estimate underlying price trends or to forecast future price trends.
Settings
Extrapolation Length: Number of extrapolated observations.
Source: Source input of the script.
Style
Width: Bézier curve line width.
Colors: The curve is colored based on the direction it's taking, the first color is used when the curve is rising, and the second when it is declining.
The other settings determine the locations of the control points. The user does not need to change them from the settings, instead only requiring adjusting their location on the chart like with a regular drawing tool. Setting these control points is required when adding the indicator to your chart.
Usage
Bézier curves are widely used in a lot of scientific and artistic fields. Using them for technical analysis can be interesting due to their extrapolation capabilities as well as their ease of calculation.
A cubic Bézier curve is based on four control points. Maxima/Minimas can be used as control points or the user can set them such that part of the extrapolated observation better fits the most recent price observations.
A possible disadvantage of Bézier curves is that obtaining a good fit with the data is not their primary goal. Rational Bézier curves can be used if obtaining a good fit is the primary user goal.
Details
At their core, Bézier curves are obtained from nested linear interpolation between each control point and the resulting linearly interpolated results. The Bézier curve point located at the first control point P0 and the last curve point located at the last control point Pn are equal to their respective control points. However, this script does not make use of this approach, instead using a more explicit form.
As mentioned previously, the complexity of a Bézier curve can be determined by its number of control points which is related to the Bézier curve degree (number of control points - 1). Instead of using nested linear interpolations to describe Bézier curves, one can describe them as a polynomial of a degree equal to the degree of the wanted Bézier curve.

Seasonality ForecastSeasonality Forecast is an indicator that gives an expected return over a coming period by looking at the average return for the same period in history. By default the indicator will show the forecast return for the next 20 days based on the last 5 years of data, these settings are changeable by the user, with the ability to use 20 years of historical data to calculate a forecast. You can also specify in the indicator settings "Use Custom Time" to go back to a particular date in the past to look at the forecast return from that date forward.
Seasonality is all around us, with the weather, business cycles, product demand, and even in your own personal habits. Chances are what you're doing today is somewhat similar to the same date last year. Traders especially in the futures markets have long known about seasonality effects and have taken advantage of it in the commodity markets where seasonality is more apparent since many commodities are affected by significant demand, weather and supply patterns.
This indicator can be applied to all markets and should be used on the daily timeframe with 10 - 100 day forecasts, it is designed to be used as part of an overall trading process in order to add strength to entry signals. If you don't see a reading it's because the instrument you're looking at doesn't have enough historical data to calculate an average expected return, ideally you always want to use at least 5 years of historical data to calculate a seasonality forecast and the more history used the more robust the forecast is.
To get access to this indicator PM or email me to my address shown below.
Enjoy :)
Disclaimer: All my scripts and content are for educational purposes only. I'm not a financial advisor and do not give personal financial advice. Past performance is no guarantee of future performance. Please trade at your own risk.

Probability ConesA probability cone is an indicator that forecasts a statistical distribution from a set point in time into the future.
Features
Forecast a Standard or Laplace distribution.
Change the how many bars the cones will lookback and sample in their calculations.
Set how many bars to forecast the cones.
Let the cones follow price from a set number of bars back.
Anchor the cones and they will not update from their last location.
Show or hide any set of cones.
Change the deviation used of any cone's upper or lower line.
Change any line's color, style, or width.
Change or toggle the fill colors between any two cone lines.
Basic Interpretations
First, there is an assumption that the distribution starting from the cone's origin, based on the number of historical bars sampled, is likely to represent the distribution of future price.
Price typically hangs around the mean.
About 68% of price stays within the first deviation cones.
About 95% of price stays within the second deviation cones.
About 99.7% of price stays within the third deviation cones.
When price is between the first and second deviation cones, there is a higher probability for a reversal.
However, strong momentum while above or below the first deviation can indicate a trend where price maintains itself past the first deviation. For this reason it's recommended to use a momentum indicator alongside the cones.
There is no mean reversion assumption when price deviates. Price can continue to stay deviated.
It's recommended that the cones are placed at the beginning of calendar periods. Like the month, week, or day.
Be mindful when using the cones on various timeframes. As the lookback setting, which selects the number of bars back to load from the cone's origin, will load the number of bars back based on the current timeframe.
Second Deviation Strategy
How to react when price goes beyond the second deviation is contingent on your trading position.
If you are holding a losing trade and price has moved past the second deviation, it could be time to stop trading and exit.
If you are holding a winning trade and price has moved past the second deviation, it would be best to look at exit strategies to capitalize on the outperformance.
If price has moved beyond the second deviation and you hold no position, then do not open any new trades.

TargetPredictor 5MA ForecastThis indicator consists of five moving averages. 7, 20, 50, 100 and 200.
Moving averages usually represent dynamic supports or resistances and are very useful in trading.
In addition, this indicator predicts where these moving averages will be located three candlesticks ahead and predicts their projected movement.
I hope you enjoy it and enjoy using it.
Universal logarithmic growth curves, with support and resistanceLogarithmic regression is used to model data where growth or decay accelerates rapidly at first and then slows over time. This model is for the long term series data (such as 10 years time span).
The user can consider entering the market when the price below 25% or 5% confidence and consider take profit when the price goes above 75% or 95% confidence line.
This script is:
- Designed to be usable in all tickers. (not only for bitcoin now!)
- Logarithmic regression and shows support-resistance level
- Shape of lines are all linear adjustable
- Height difference of levels and zones are customizable
- Support and resistance levels are highlighted
Input panel:
- Steps of drawing: Won't change it unless there are display problems.
- Resistance, support, other level color: self-explanatory.
- Stdev multipliers: A constant variable to adjust regression boundaries.
- Fib level N: Base on the relative position of top line and base line. If you don't want all fib levels, you might set all fib levels = 0.5.
- Linear lift up: vertically lift up the whole set of lines. By linear multiplication.
- Curvature constant: It is the base value of the exponential transform before converting it back to the chart and plotting it. A bigger base value will make a more upward curvy line.
FAQ:
Q: How to use it?
A: Click "Fx" in your chart then search this script to get it into your chart. Then right click the price axis, then select "Logarithmic" scale to show the curves probably.
Q: Why release this script?
A: - This script is intended to to fix the current issues of bitcoins growth curve script, and to provide a better version of the logarithmic curve, which is not only for bitcoin , but for all kinds of tickers.
- In the public library there is a hardcoded logarithmic growth curve by @quantadelic . But unfortunately that curve was hardcoded by his manual inputs, which makes the curve stop updating its value since 2019 the date he publish that code. Many users of that script love using it but they realize it was stop updating, many users out there based on @quantadelic version of "bitcoin logarithmic growth curves" and they tried their best to update the coordinates with their own hardcode input values. Eventually, a lot of redundant hardcoded "Bitcoin growth curve" scripts was born in the public library. Which is not a good thing.
Q: What about looking at the regression result with a log scale price axis?
A: You can use this script that I published in a year ago. This script display the result in a log scale price axis.

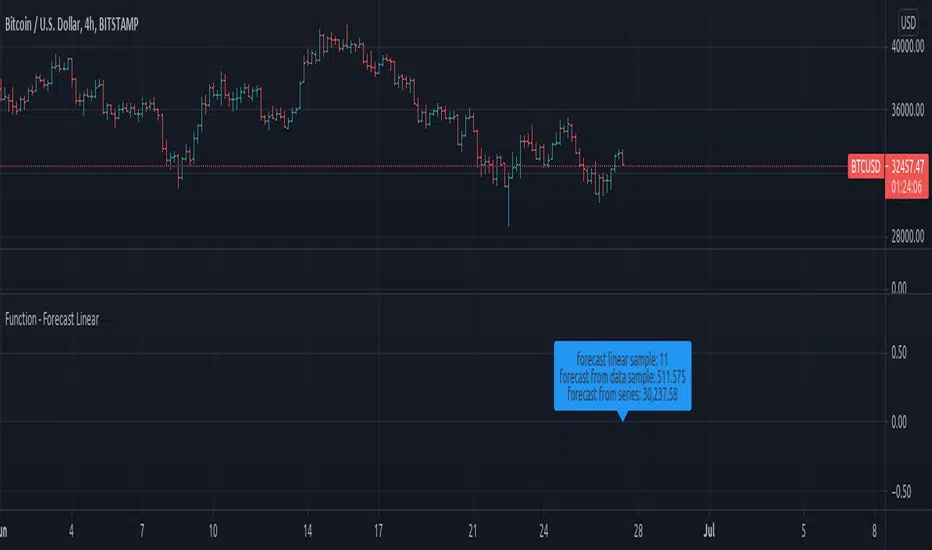
FunctionForecastLinearLibrary "FunctionForecastLinear"
Method for linear Forecast, same as found in excel and other sheet packages.
forecast(sample_x, sample_y, target_x) linear forecast method.
Parameters:
sample_x : float array, sample data X value.
sample_y : float array, sample data Y value.
target_x : float, target X to get Y forecast value.
Returns: float

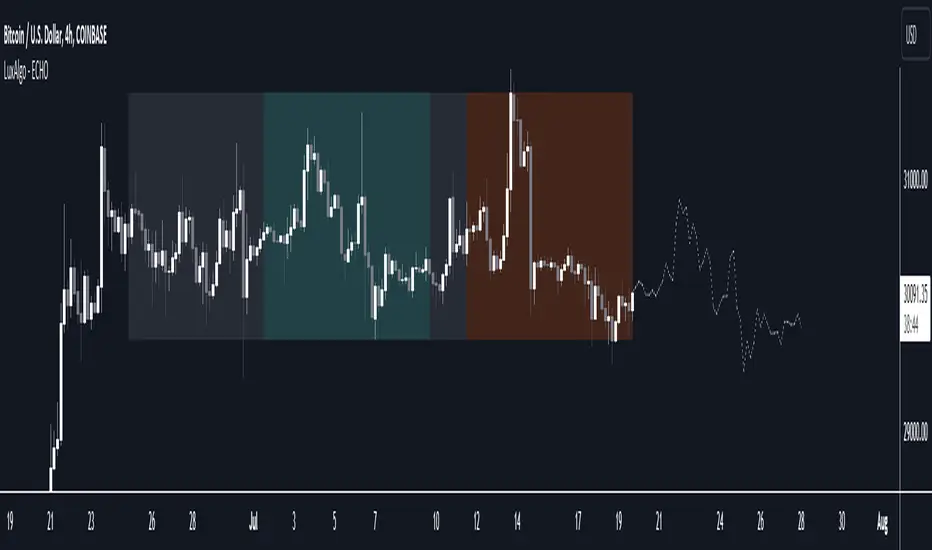
The Echo Forecast [LuxAlgo]This indicator uses a simple time series forecasting method derived from the similarity between recent prices and similar/dissimilar historical prices. We named this method "ECHO".
This method originally assumes that future prices can be estimated from a historical series of observations that are most similar to the most recent price variations. This similarity is quantified using the correlation coefficient. Such an assumption can prove to be relatively effective with the forecasting of a periodic time series. We later introduced the ability to select dissimilar series of observations for further experimentation.
This forecasting technique is closely inspired by the analogue method introduced by Lorenz for the prediction of atmospheric data.
1. Settings
Evaluation Window: Window size used for finding historical observations similar/dissimilar to recent observations. The total evaluation window is equal to "Forecast Window" + "Evaluation Window"
Forecast Window: Determines the forecasting horizon.
Forecast Mode: Determines whether to choose historical series similar or dissimilar to the recent price observations.
Forecast Construction: Determines how the forecast is constructed. See "Usage" below.
Src: Source input of the forecast
Other style settings are self-explanatory.
2. Usage
This tool can be used to forecast future trends but also to indicate which historical variations have the highest degree of similarity/dissimilarity between the observations in the orange zone.
The forecasting window determines the prices segment (in orange) to be used as a reference for the search of the most similar/dissimilar historical price segment (in green) within the gray area.
Most forecasting techniques highly benefit from a detrended series. Due to the nature of this method, we highly recommend applying it to a detrended and periodic series.
You can see above the method is applied on a smooth periodic oscillator and a momentum oscillator.
The construction of the forecast is made from the price changes obtained in the green area, denoted as w(t) . Using the "Cumulative" options we construct the forecast from the cumulative sum of w(t) . Finally, we add the most recent price value to this cumulated series.
Using the "Mean" options will add the series w(t) with the mean of the prices within the orange segment.
Finally the "Linreg" will add the series w(t) to an extrapolated linear regression fit to the prices within the orange segment.
vol_signalNote: This description is copied from the script comments. Please refer to the comments and release notes for updated information, as I am unable to edit and update this description.
----------
USAGE
This script gives signals based on a volatility forecast, e.g. for a stop
loss. It is a simplified version of my other script "trend_vol_forecast", which incorporates a trend following system and measures performance. The "X" labels indicate when the price touches (exceeds) a forecast. The signal occurs when price crosses "fcst_up" or "fcst_down".
There are only three parameters:
- volatility window: this is the number of periods (bars) used in the
historical volatility calculation. smaller number = reacts more
quickly to changes, but is a "noisier" signal.
- forecast periods: the number of periods for projecting a volatility
forecast. for example, "21" on a daily chart means the plots will
show the forecast from 21 days ago.
- forecast stdev: the number of standard deviations in the forecast.
for example, "2" means that price is expected to remain within
the forecast plot ~95% of the time. A higher number produces a
wider forecast.
The output table shows:
- realized vol: the volatility over the previous N periods, where N =
"volatility window".
- forecast vol: the realized volatility from N periods ago, where N =
"forecast periods"
- up/down fcst (level): the price level of the forecast for the next
N bars, where N = "forecast periods".
- up/down fcst (%): the difference between the current and forecast
price, expressed as a whole number percentage.
The plots show:
- blue/red plot: the upper/lower forecast from "forecast periods" ago.
- blue/red line: the upper/lower forecast for the next
"forecast periods".
- red/blue labels: an "X" where the price touched the forecast from
"forecast periods" ago.
+ NOTE: pinescript only draws a limited number of labels.
They will not appear very far into the past.

pricing_tableThis script helps you evaluate the fair value of an option. It poses the question "if I bought or sold an option under these circumstances in the past, would it have expired in the money, or worthless? What would be its expected value, at expiration, if I opened a position at N standard deviations, given the volatility forecast, with M days to expiration at the close of every previous trading day?"
The default (and only) "hv" volatility forecast is based on the assumption that today's volatility will hold for the next M days.
To use this script, only one step is mandatory. You must first select days to expiration. The script will not do anything until this value is changed from the default (-1). These should be CALENDAR days. The script will convert to these to business days for forecasting and valuation, as trading in most contracts occurs over ~250 business days per year.
Adjust any other variables as desired:
model: the volatility forecasting model
window: the number of periods for a lagged model (e.g. hv)
filter: a filter to remove forecasts from the sample
filter type: "none" (do not use the filter), "less than" (keep forecasts when filter < volatility), "greater than" (keep forecasts when filter > volatility)
filter value: a whole number percentage. see example below
discount rate: to discount the expected value to present value
precision: number of decimals in output
trim outliers: omit upper N % of (generally itm) contracts
The theoretical values are based on history. For example, suppose days to expiration is 30. On every bar, the 30 days ago N deviation forecast value is compared to the present price. If the price is above the forecast value, the contract has expired in the money; otherwise, it has expired worthless. The theoretical value is the average of every such sample. The itm probabilities are calculated the same way.
The default (and only) volatility model is a 20 period EWMA derived historical (realized) volatility. Feel free to extend the script by adding your own.
The filter parameters can be used to remove some forecasts from the sample.
Example A:
filter:
filter type: none
filter value:
Default: the filter is not used; all forecasts are included in the the sample.
Example B:
filter: model
filter type: less than
filter value: 50
If the model is "hv", this will remove all forecasts when the historical volatility is greater than fifty.
Example C:
filter: rank
filter type: greater than
filter value: 75
If the model volatility is in the top 25% of the previous year's range, the forecast will be included in the sample apart from "model" there are some common volatility indexes to choose from, such as Nasdaq (VXN), crude oil (OVX), emerging markets (VXFXI), S&P; (VIX) etc.
Refer to the middle-right table to see the current forecast value, its rank among the last 252 days, and the number of business days until
expiration.
NOTE: This script is meant for the daily chart only.

Pivot High/Low Analysis & Forecast [LuxAlgo]Returns pivot points high/low alongside the percentage change between one pivot and the previous one (Δ%) and the distance between the same type of pivots in bars (Δt). The trailing mean for each of these metrics is returned on a dashboard on the chart. The indicator also returns an estimate of the future time position of the pivot points.
This indicator by its very nature is not real-time and is meant for descriptive analysis alongside other components of the script. This is normal behavior for scripts detecting pivots as a part of a system and it is important you are aware the pivot labels are not designed to be traded in real-time themselves
🔶 USAGE
The indicator can provide information helping the user to infer the position of future pivot points. This information is directly used in the indicator to provide such forecasting. Note that each metric is calculated relative to the same type of pivot points.
It is also common for analysts to use pivot points for the construction of various figures, getting the percentage change and distance for each pivot point can allow them to eventually filter out points of non-interest.
🔹 Forecast
We use the trailing mean of the distance between respective pivots to estimate the time position of future pivot points, this can be useful to estimate the location of future tops/bottoms. The time position of the forecasted pivot is given by a vertical dashed line on the chart.
We can see a successful application of this method below:
Above we see the forecasted pivots for BTCUSD15. The forecast of interest being the pivot high. We highlight the forecast position with a blue dotted line for reference.
After some time we obtain a new pivot high with a new forecast. However, we can see that the time location of this new pivot high matches perfectly with the prior forecast.
The position in time for the forecast is given by:
x1_ph + E
x1_pl + E
where x1_ph denotes the position in time of the most recent pivot high. x1_pl denotes the position in time of the most recent pivot low and E the average distance between respective pivot points.
🔶 SETTINGS
Length: Window size for the detection of pivot points.
Show Forecasted Pivots: Display forecast of future pivot points.
🔹 Dashboard
Dashboard Location: Location of the dashboard on the chart
Dashboard Size: Size of the dashboard on the chart
Text/Frame Color: Determines the color of the frame grid as well as the text color

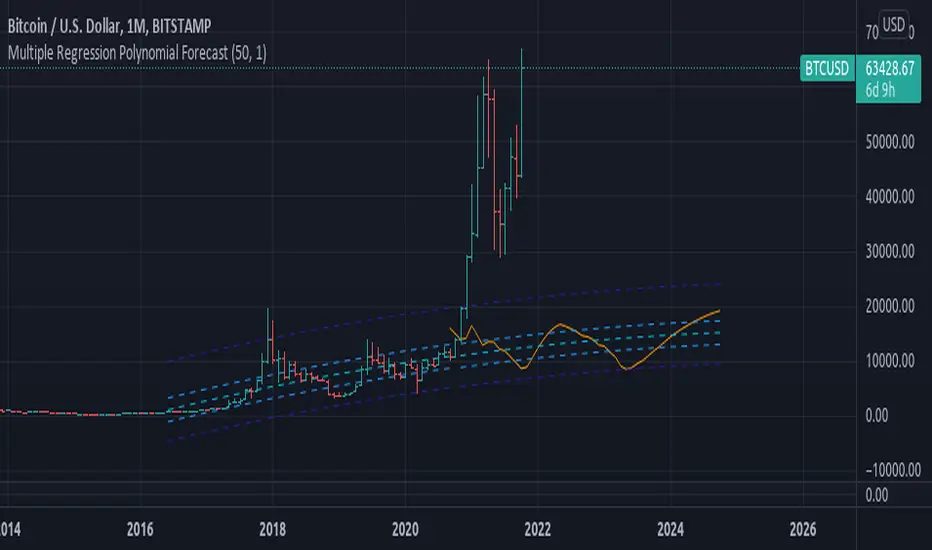
Multiple Regression Polynomial ForecastEXPERIMENTAL:
Forecasting using a polynomial regression over the estimates of multiple linear regression forecasts.
note: on low data the estimates are skewd away of initial value, i added the i_min_estimate option in to try curve this issue with limited success "o_o.
Function - Forecast LinearFunction to calculate a forecast using a linear regression approach, this is the same function used on excel and other data sheet programs.
reference:
- support.microsoft.com
- stackoverflow.com
Volatility - Sacred GeometryThis indicator is designed to pick up changes in volatility before it happens. It also shows current volatility, as price action drops the blue lines contract. The script uses the blue lines to locate spikes in volatility.
Example of dump revealing itself with plenty of notice.
Here large changes in price action are shown when the white lines spike. Traders can get a heads up on any pump or dump a few candles before it happens.
This example shows a low volatility channel vs high volatility channel. The blue lines expand as price range increases.
Trends can be discovered by studying the patterns.
* This indicator does not use sacred geometry, I just called it that because it looks like it. *
If anyone is interested in developing this indicator any further please get in contact.

Pivot ProbabilitiesThis indicator gives traders historical probabilities based on how often price closed between any two pivot points.
What are the features? (as of release)
Get the historical statistics of how often price closed between any two pivot points.
Manually set your own pivot point resolution to any higher timeframe. So get the historical statistics from any pivot point you'd like.
Why would someone use this?
Reversion: We can more clearly see between which pivots price has highest probability of mean reversion towards.
Risk Management: By adding the statistics between groups of pivots, we can have a better idea of what the normal trading range for pivot points on any given asset should be. Making it easier to identify which pivot points are more likely to have extreme price movements go past.
Could you add an option to show probabilities for "x" style of pivot points?
I plan on adding more types of pivot points in the future. Check out if there are any updates to this indicator that include the pivots you're looking for. Otherwise, tell me what you're looking for in the comments here.
Why don't I see any pivot points on my chart when I apply this indicator?
This indicator does not draw pivot points on your chart. It strictly draws probabilities. So feel free to use it in combination with your favorite one.

Multi Moving Average with ForecastThis script allows to use 5 different MAs with prediction of the next five periods.
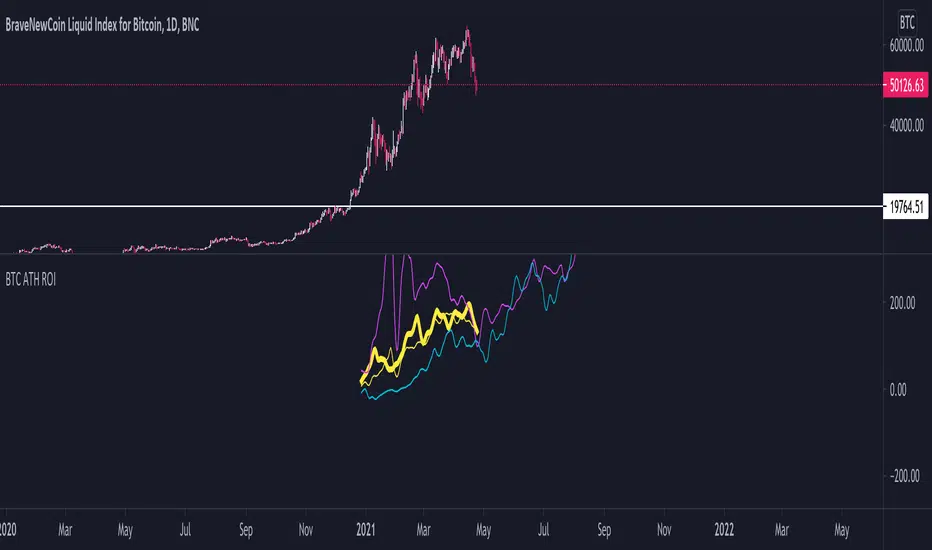
BTC ATH ROIThis indicator shows the ROI % of Bitcoin from when it passed its ATH of the previous bull cycle. I found it interesting that each time it crossed its ATH it took around 260-280 days to peak for each one. This bull run seems to follow between both of the previous bull runs including this recent dip.
There are a couple issues I want to fix but can't figure out:
1. You need to completely scroll out and move towards 2013 on the Daily chart for all 3 lines to show up. Would be nice to load all of that data at the start.
2. I can't query the value of the plots after they have been offset. This would be useful to create a prediction bias for the current plot so would could see where btc might go.
If you peeps know of a way to load all data or query plot values after offsets, please share. That would be awesome.
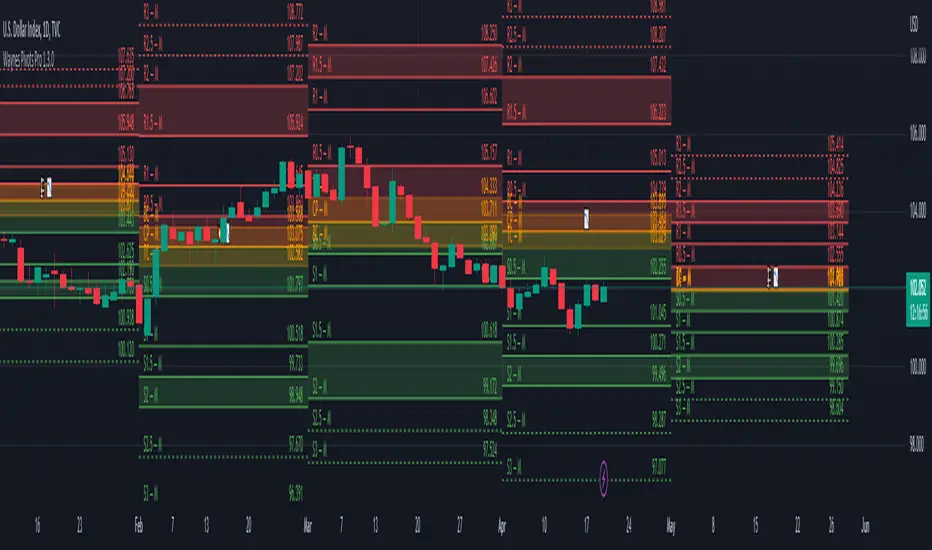
Wayne's Pivots ProThere is a public version of this indicator titled "Wayne's Pivots" if you would like to try out something similar to this indicator.
Wayne's Pivots Pro is named after Wayne McDonnel who came up with this indicator's pivot trading methodology. Wayne's Pivots are only one part of his methodology, but these pivots are the most critical part. They are frequently applied to supplement other trading methodologies as well. There are 3 key features that separate Wayne's Pivots specifically from every other pivot point indicator out there.
1. Midpoint Pivots
2. Biased Pivots
3. Next Period's Pivots
Understand that this indicator is supposed to be used, according to the methodology, alongside a fundamental bias. If you have not done fundamental research to know if you're a bull or bear on an asset, then you will likely not be using these pivots correctly. They do not tell you which direction the market will move. It tells you how far and how long a trade may go depending on which way you bias the pivots, and if your fundamental view was correct. This is trade planning tool for your entries and exits.
Breaking each point down:
1. Midpoint Pivots
If you take regular pivots (S#, R#), and get a histogram of every time price closed at or above each level, you generally end up with an even distribution. By adding midpoint levels you are doubling the amount of data, and increasing the resolution of the histogram. While these extra levels don't necessarily give us entries or exits, they do tell us when price doesn't quite reach a major support or resistance level. Midpoint pivot levels are calculated by finding the midpoint between each pivot level, and are labeled from the bottom up starting at M0 (Midpoint 0).
2. Biased Pivots
The traditional rules for trading pivot points are to buy support levels and sell resistance levels. In Wayne's methodology, we see pivots as a set for entries and take profits depending on our bias. It is known that trading the inverse of traditional pivot point rules that you can end up with a reasonable strategy. Biased pivots let us focus on only what matter to us by removing all other pivots, lines, and labels. Only showing us pivots useful to the bias we set.
For example, if you are a bull fundamentally you would set the bullish biased pivots. You would look for an entry in the area between the central pivot and second midpoint (M2), and an exit in the area between R2 and M4.
3. Next Period's Pivots
The third major feature of Wayne's Pivots are the "future" pivots. These are really calculated by taking the current HLC data and plotting it in realtime into the future before there's any data there. When we enter a new trading period, let say the day, we will have little data on the next day's pivots. As the current trading day goes on and gets closer to it's close, we start to see the next day's pivot points firm up. It's at this point that future pivots become actionable to create trading plans for the next day. The next period's pivots are exceptionally useful when scaled up to weekly, monthly, quarterly, and yearly timeframes. Daily, weekly, and monthly are the most commonly used within communities trading Wayne's methodology.
This is a completely rebuilt, professional use version of Wayne's Pivots. It includes many technical upgrades required by professional using Wayne's methodology. I released the original version publicly because it does not have many of the features here included in the Professional's version.
Features in Pro that are not in the public version:
Works on ALL timeframes.
Realtime pivot point updates.
Price levels on the pivots.
Extra pivots. (R3, M5, M0, S3)
All pivots start and end at the correct dates and times. (public version can't due to plot())
Easier to add more features!
Does this mean that you've abandoned the public version of Wayne's Pivots?
Absolutely not. Whenever there is a new feature in the Pro version, I always see if I can add it into the public one. It's just that the way it's built was not how I originally envisioned these pivots to be. If there's ever something that breaks the public version, I'm going to fix it because there's hundreds of people who use it.
I use the public version of Wayne's Pivots perfectly fine with my trading. Why switch to Pro?
Simply put, it's not going to give you the most accurate pivots that a professional would need. The pivots do not print properly on months with more or less than 30 days, and do their worst on short weeks. The public version has been like this ever since I first made it, and the only work around was to completely rebuild it. That's the major reason why I made the public version available to everyone in the first place. On top of all that, I can add way more features and customization options to these pivots than the public ones.
If I have a feature request will you try to implement it?
Absolutely! Some requests do have their limits, but don't be afraid to ask for something you really want. I'll try and implement lots of requested features as time goes on.