Candle Range Theory | Flux Charts💎 GENERAL OVERVIEW
Introducing our new Candle Range Theory Indicator! This powerful tool offers a strategy built around the Candle Range Theory, which analyzes market movements through the relative size and structure of price candles. For more information about the process, check the "HOW DOES IT WORK" section.
Features of the new Candle Range Theory Indicator :
Implementation of the Candle Range Theory
FVG & Order Block Entry Methods
2 Different TP / SL Methods
Customizable Execution Settings
Customizable Backtesting Dashboard
Alerts for Buy, Sell, TP & SL Signals
📌 HOW DOES IT WORK ?
The Candle Range Theory (CRT) indicator operates by identifying significant price movements through the relative size and structure of candlesticks. A key part of the strategy is determining large candles based on their range compared to the Average True Range (ATR) in a higher timeframe. Once identified, a breakout of either the high wick or the low wick of the large candle is required. This breakout is considered a liquidity grab. After that, the indicator waits for confirmation through Fair Value Gaps (FVGs) or Order Blocks (OBs). The confirmation structure must be the opposite direction of the breakout, for example if the high wick is broken, a bearish FVG is required for the short entry. After a confirmation signal is received, the indicator will trigger entry points based on your chosen entry method (FVG or OB), and exit points will be calculated using either a dynamic ATR-based TP/SL method or fixed percentages. Alerts for Buy, Sell, Take-Proft, and Stop-Loss are available.
🚩 UNIQUENESS
This indicator stands out because it combines two highly effective entry methods: Fair Value Gaps (FVGs) and Order Blocks (OBs). You can choose between these strategies depending on market conditions. Additionally, the dynamic TP/SL system uses the ticker's volatility to automatically calculate stop-loss and take-profit targets. The backtesting dashboard provides metrics about the performance of the indicator. You can use it to tune the settings for best use in the current tiker. The Candle Range Theory approach offers more flexibility compared to traditional indicators, allowing for better customization and control based on your risk tolerance.
⚙️ SETTINGS
1. General Configuration
Higher Timeframe: Customize the higher timeframe for analysis. Recommended combinations include M15 -> H4, H4 -> Daily, Daily -> Weekly, and Weekly -> Monthly.
HTF Candle Size: Define the size of the higher timeframe candles as Big, Normal, or Small to filter valid setups based on their range relative to ATR.
Entry Mode: Choose between FVGs and Order Blocks for your entry triggers.
Require Retracement: Enable this option if you want a retracement to the FVG or OB for entry confirmation.
Show HTF Candle Lines: Toggle to display the higher timeframe candle lines for better visual clarity.
2. Fair Value Gaps
FVG Sensitivity: You may select between Low, Normal, High or Extreme FVG detection sensitivity. This will essentially determine the size of the spotted FVGs, with lower sensitivities resulting in spotting bigger FVGs, and higher sensitivities resulting in spotting all sizes of FVGs.
3. Order Blocks
Swing Length: Swing length is used when finding order block formations. Smaller values will result in finding smaller order blocks.
4. TP / SL
TP / SL Method:
a) Dynamic: The TP / SL zones will be auto-determined by the algorithm based on the Average True Range (ATR) of the current ticker.
b) Fixed : You can adjust the exact TP / SL ratios from the settings below.
Dynamic Risk: The risk you're willing to take if "Dynamic" TP / SL Method is selected. Higher risk usually means a better winrate at the cost of losing more if the strategy fails. This setting is has a crucial effect on the performance of the indicator, as different tickers may have different volatility so the indicator may have increased performance when this setting is correctly adjusted.
Fairvaluegap

ICT Judas Swing | Flux Charts💎 GENERAL OVERVIEW
Introducing our new ICT Judas Swing Indicator! This indicator is built around the ICT's "Judas Swing" strategy. The strategy looks for a liquidity grab around NY 9:30 session and a Fair Value Gap for entry confirmation. For more information about the process, check the "HOW DOES IT WORK" section.
Features of the new ICT Judas Swing :
Implementation of ICT's Judas Swing Strategy
2 Different TP / SL Methods
Customizable Execution Settings
Customizable Backtesting Dashboard
Alerts for Buy, Sell, TP & SL Signals
📌 HOW DOES IT WORK ?
The strategy begins by identifying the New York session from 9:30 to 9:45 and marking recent liquidity zones. These liquidity zones are determined by locating high and low pivot points: buyside liquidity zones are identified using high pivots that haven't been invalidated, while sellside liquidity zones are found using low pivots. A break of either buyside or sellside liquidity must occur during the 9:30-9:45 session, which is interpreted as a liquidity grab by smart money. The strategy assumes that after this liquidity grab, the price will reverse and move in the opposite direction. For entry confirmation, a fair value gap (FVG) in the opposite direction of the liquidity grab is required. A buyside liquidity grab calls for a bearish FVG, while a sellside grab requires a bullish FVG. Based on the type of FVG—bullish for buys and bearish for sells—the indicator will then generate a Buy or Sell signal.
After the Buy or Sell signal, the indicator immediately draws the take-profit (TP) and stop-loss (SL) targets. The indicator has three different TP & SL modes, explained in the "Settings" section of this write-up.
You can set up alerts for entry and TP & SL signals, and also check the current performance of the indicator and adjust the settings accordingly to the current ticker using the backtesting dashboard.
🚩 UNIQUENESS
This indicator is an all-in-one suit for the ICT's Judas Swing concept. It's capable of plotting the strategy, giving signals, a backtesting dashboard and alerts feature. Different and customizable algorithm modes will help the trader fine-tune the indicator for the asset they are currently trading. Three different TP / SL modes are available to suit your needs. The backtesting dashboard allows you to see how your settings perform in the current ticker. You can also set up alerts to get informed when the strategy is executable for different tickers.
⚙️ SETTINGS
1. General Configuration
Swing Length -> The swing length for pivot detection. Higher settings will result in
FVG Detection Sensitivity -> You may select between Low, Normal, High or Extreme FVG detection sensitivity. This will essentially determine the size of the spotted FVGs, with lower sensitivies resulting in spotting bigger FVGs, and higher sensitivies resulting in spotting all sizes of FVGs.
2. TP / SL
TP / SL Method ->
a) Dynamic: The TP / SL zones will be auto-determined by the algorithm based on the Average True Range (ATR) of the current ticker.
b) Fixed : You can adjust the exact TP / SL ratios from the settings below.
Dynamic Risk -> The risk you're willing to take if "Dynamic" TP / SL Method is selected. Higher risk usually means a better winrate at the cost of losing more if the strategy fails. This setting is has a crucial effect on the performance of the indicator, as different tickers may have different volatility so the indicator may have increased performance when this setting is correctly adjusted.

HTF Inversion Fair Value Gap | Flux Charts💎 GENERAL OVERVIEW
Introducing our new Higher Timeframe Inversion Fair Value Gaps (IFVG) indicator! Inversion Fair Value Gaps occur when a Fair Value Gap becomes invalidated. They reverse the role of the original Fair Value Gap, making a bullish zone bearish and vice versa. This indicator finds the latest IFVG in a higher timeframe and renders it in the current chart with it's divergence. For more information about the process, read the "HOW DOES IT WORK" section of the description.
Features of the new Higher Timeframe IFVG Indicator :
Renders The Higher Timeframe IFVG
Invalidation Borders
Variety Of Zone Detection / Sensitivity / Filtering / Invalidation Settings
High Customizability
🚩 UNIQUENESS
This indicator lets you take a look at the bigger picture by rendering the latest IFVG in a higher timeframe. You can see the current IFVG divergence to see how is the price action acting around the IFVG. You also can customize the FVG Filtering method, FVG & IFVG Zone Invalidation, Detection Sensitivity etc. according to your needs to get the best performance from the indicator.
📌 HOW DOES IT WORK ?
A Fair Value Gap generally occur when there is an imbalance in the market. They can be detected by specific formations within the chart. An Inversion Fair Value Gap is when a FVG becomes invalidated, thus reversing the direction of the FVG.
This indicator then renders the IFVG in a higher timeframe in your chart like this :
The opaque dashed lines at the top and the bottom of the IFVG indicate the bars that formed the original FVG. The middle dashed line that is semi-transparent shows the candlestick that invalidated the original FVG, thus created the current IFVG. The vertical solid top & bottom wicks indicate the current divergence of the highest & lowest points to the current IFVG.
The IFVGs can act as strong support & resistance points, depending on their creation volume and invalidation volume. Traders can use them for confirmation signals to their positions.
⚙️ SETTINGS
1. General Configuration
Higher Timeframe -> The higher timeframe to detect latest IFVG from. Keep in mind that his setting must be higher than the current timeframe.
IFVG Zone Invalidation -> Select between Wick & Close price for IFVG Zone Invalidation.
2. Fair Value Gaps
FVG Zone Invalidation -> Select between Wick & Close price for FVG Zone Invalidation.
Zone Filtering -> With "Average Range" selected, algorithm will find FVG zones in comparison with average range of last bars in the chart. With the "Volume Threshold" option, you may select a Volume Threshold % to spot FVGs with a larger total volume than average.
FVG Detection -> With the "Same Type" option, all 3 bars that formed the FVG should be the same type. (Bullish / Bearish). If the "All" option is selected, bar types may vary between Bullish / Bearish.
Detection Sensitivity -> You may select between Low, Normal or High FVG detection sensitivity. This will essentially determine the size of the spotted FVGs, with lower sensitivities resulting in spotting bigger FVGs, and higher sensitivities resulting in spotting all sizes of FVGs.
3. Dasboard
You can enable / disable the mitigation dashboard and customize it here.
4. Customization
Offset -> The number of candlesticks the IFVG will be rendered to the right of the latest bar.
Width -> The width of the rendered IFVG in candlesticks.

Gaps Trend [ChartPrime]The Gaps Trend - ChartPrime indicator is designed to detect Fair Value Gaps (FVGs) in the market and apply a trailing stop mechanism based on those gaps. It identifies both bullish and bearish gaps and provides traders with a way to manage trades dynamically as gaps appear. The indicator visually highlights gaps and uses the detected momentum to assess trend direction, helping traders identify price imbalances caused by strong buy or sell pressure.
⯁ KEY FEATURES & HOW TO USE
⯌ Fair Value Gap (FVG) Detection :
The indicator automatically detects both bullish and bearish FVGs, identifying gaps between candle highs and lows. Bullish gaps are shown in green, and bearish gaps in purple. These gaps indicate price imbalances driven by strong momentum, such as when there is significant buying or selling pressure.
Use : Traders can use FVG detection to identify periods of high price momentum, offering insight into potential continuation or exhaustion of trends.
⯌ Trailing Stop Feature Based on FVGs :
A core feature of this indicator is the trailing stop mechanism, which adjusts dynamically based on the identified FVGs. When a bullish gap is detected, the trailing stop is placed below the price to capture upward momentum, while bearish gaps result in a trailing stop placed above the price. This feature helps traders stay in trends while protecting profits as the price moves.
Use : The trailing stop follows the momentum of the price, ensuring that traders can stay in profitable trades during strong trends and exit when the momentum shifts.
bullish set up
bearish set up
⯌ Trend Direction Indication :
The indicator colors the chart according to the current trend direction based on the position of the price relative to the trailing stop. Green indicates an uptrend (bullish gap), while purple shows a downtrend (bearish gap). This provides traders with a quick visual assessment of trend direction based on the presence of gaps.
Use : Traders can monitor the chart's color to stay aligned with the market’s trend, staying long during green phases and short during purple ones.
⯌ Gap Size Filtering :
Each detected gap is assigned a numerical ranking based on its size, with larger gaps having higher rankings. The gap size filter allows traders to only display gaps that meet a minimum size threshold, focusing on the most impactful gaps in terms of price movement.
Use : Traders can use the filter to focus on gaps of a certain size, filtering out smaller, less significant gaps. The numerical ranking helps identify the largest and most influential gaps for decision-making.
⯌ FVG Level Visualization :
The indicator can display dashed lines marking the levels of previously filled FVGs. These levels represent areas where price once experienced a gap and later filled it. Monitoring these levels can provide traders with key reference points for potential reactions in price.
Use : Traders can use these gap levels to track where price has filled gaps and potentially use these levels as zones for entry, exit, or assessing market behavior.
⯁ USER INPUTS
Filter Gaps : Adjust the size threshold to filter gaps by their size ranking.
Show Gap Levels : Toggle the display of dashed lines at filled FVG levels.
Enable Trailing Stop : Activate or deactivate the trailing stop feature based on FVGs.
Trailing Stop Length : Set the number of bars used to calculate the trailing stop.
Bullish/Bearish Colors : Customize the colors representing bullish and bearish gaps.
⯁ CONCLUSION
The Gaps Trend indicator combines Fair Value Gap detection with a dynamic trailing stop feature to help traders manage trades during periods of high price momentum. By detecting gaps caused by strong buy or sell pressure and applying adaptive stops, the indicator provides a powerful tool for riding trends and managing risk. The additional ability to filter gaps by size and visualize previously filled gaps enhances its utility for both trend-following and risk management strategies.

ICT HTF FVGs v2 (fadi)NOTICE: Instead of updating the existing ICT HTF FVGs indicator, this indicator is being published separately due to the requests to keep the original by some traders and because of the drastic change in behavior/configurations. If the original v1 version is more appropriate for your style of trading, feel free to continue to use it.
ICT HTF FVGs v2
In trading, Fair Value Gaps (FVGs) refer to market inefficiencies or imbalances that occur when buying and selling activities are not equal. These gaps can be identified on various timeframes and are used in different trading strategies.
FVGs are crucial in price action trading as they highlight the difference between the current market price of an asset and its fair value. Traders use these gaps to identify potential trading opportunities, as they often indicate areas where the market may correct itself
This indicator will overlap the higher timeframe (HTF) FVGS over the current timeframe to help traders anticipate and plan their trades.
Features
Up to 6 higher timeframes (HTF) can be overlayed on a chart
Traders can limit the number of HTF FVGs to preset number of HTFs
Lower and current timeframes can be included
Configurable spacing of HTF FVGs to prevent overlapping
Configurable Smart Expansion of FVGs based on proximity to current price
Traders can decide what constitutes a Mitigated FVG
Show or hide mitigated FVGs to declutter the chart
Flexible display settings that controls how the FVGs are displayed
Flexible labeling of the FVG levels and content
Higher Timeframes Display Settings
This indicator provides the ability to select up to 6 HTF intervals. These intervals are based on the trader's timeframes including any custom timeframes.
Timeframe Configurations
Enable or Disable a Timeframe
The Timeframe to Display
Bullish / BISI FVG Color
Bearish / SIBI FVG Color
The number of FVGs For The Selected Timeframe
Limit to the next HTFs only can be used to display the selected number of HTF FVGs. For example, if the trader selects 3 then only 3 HTF FVGs will be displayed.
Note: If either of the next two options is selected, they will take up spots from this count.
Hide lower Timeframes restricts the FVGs to higher timeframes only. If this option is disabled, it will show lower timeframes FVGs as well.
Hide Current Timeframe removes current timeframe from the selected list of HTF FVGs. If this option is disabled, it will show current timeframe FVGs as well.
Background Transparency Enable or disable the background color (shaded area) of the FVG. If it is enabled, it will set the transparency amount. The higher the value, the more transparent the background.
Extend lines controls when and how to extend the FVG levels. There are three options:
Extension Only extends the FVGs by the specified number provided below only.
Current Candle Plus Extension extends all the FVGs beyond the current candle by the number provided below.
When in Range will only extend the FVGs near current price based on the advanced settings below. This setting will use Average True Range multiplier to calculate the range (shows FVGs that are higher or lower by the average candle size multiplied by the number in Advanced section).
Mitigated shows or hides the mitigated HTF FVGs. A FVG is considered mitigated based on one of the following options:
None will ignore mitigation and show all FVGs.
Touched when a HTF FVG is touched regardless of how deep the price get inside the FVG.
Wick filled the FVG is closed by a wick or body of a candle.
Body filled the FVG is closed by the body of a candle
Wick filled half a candle's wick or body has reached the C.E. of the FVG
Body filled half a candle body has reached the C.E. of the FVG
Extend mitigated lines sets the number of candles to extend the mitigated FVG levels by for better visibility.
Important Note: Mitigation is calculated based on the timeframe of the FVG, not current timeframe.
Display
Display settings focus on how the FVGs will be displayed. The trader is in total control and there are multiple ways to overlay FVGs on the chart.
Open / Close / C.E. / Link controls the borders. Traders can enable or disable any of them as well as set the thickness and style. Link is the right border.
C.E. also offers the option of setting the bullish (BISI) and bearish (SIBI) colors of the C.E. level
Labeling controls if the labels should be displayed next to the FVG, their color, background, and font size.
Label levels to display controls which levels to show. Open, High. or the C.E.
Label display content controls what to show in the labels, the timeframe of the label, is it a BISI or a SIBI, and a label to indicate if it is the Open or the Close.
Note: if the distance between the open and close has the potential of overlapping the labels, then the indicator will only show the C.E. label for visual clarity.
Advanced Settings
Advanced settings controls some internal calculations:
Proximity factor based on daily range used to calculate possible range of FVGs within a day's range to keep the chart clean. The higher the value, the more FVGs will be shown.
Combine labels factor for visibility used to calculate the distance between the open and close and if all the labels or only the C.E. should be displayed. The higher the value, the bigger the distance for combination (smaller numbers will show more labels).
Range should be within X candles used when "When in Range" option is selected. This is the ATR multiplier used to extend the FVGs. The higher the number, the more FVGs will be extended.
Once desired settings have been achieved, the settings can be saved as default from the bottom left of the indicator settings page for future use.

ICT Unicorn | Flux Charts💎 GENERAL OVERVIEW
Introducing our new ICT Unicorn Indicator! This indicator is built around the ICT's "Unicorn" strategy. The strategy uses Breaker Blocks and Fair Value Gaps for entry confirmation. For more information about the process, check the "HOW DOES IT WORK" section.
Features of the new ICT Unicorn Indicator :
Implementation of ICT's Unicorn Strategy
Toggleable Retracement Entry Method
3 Different TP / SL Methods
Customizable Execution Settings
Customizable Backtesting Dashboard
Alerts for Buy, Sell, TP & SL Signals
📌 HOW DOES IT WORK ?
The ICT Unicorn entry model merges the concepts of Breaker Blocks and Fair Value Gaps (FVGs), offering a distinct method for identifying trade opportunities. By integrating these two elements, we can have a position entry with stop-loss and take-profit targets on the potential support & resistance zones. This model is particularly reliable for trade entry, as it combines two powerful entry techniques.
An ICT Unicorn Model consists of a FVG which is overlapping with a Breaker Block of the same type. Here is an example :
When a FVG overlaps with a Breaker Block of the same type, the indicator gives a Buy or Sell signal depending on the FVG type (Bullish & Bearish). If the "Require Retracement" option is enabled in the settings, the signals are not given immediately. Instead, the current price of the ticker will need to touch the FVG once more before the signals are given.
After the Buy or Sell signal, the indicator immediately draws the take-profit (TP) and stop-loss (SL) targets. The indicator has three different TP & SL modes, explained in the "Settings" section of this write-up.
You can set up alerts for entry and TP & SL signals, and also check the current performance of the indicator and adjust the settings accordingly to the current ticker using the backtesting dashboard.
🚩 UNIQUENESS
This indicator is an all-in-one suit for the ICT's Unicorn concept. It's capable of plotting the strategy, giving signals, a backtesting dashboard and alerts feature. Different and customizable algorithm modes will help the trader fine-tune the indicator for the asset they are currently trading. Three different TP / SL modes are available to suit your needs. The backtesting dashboard allows you to see how your settings perform in the current ticker. You can also set up alerts to get informed when the strategy is executable for different tickers.
⚙️ SETTINGS
1. General Configuration
FVG Detection Sensitivity -> You may select between Low, Normal, High or Extreme FVG detection sensitivity. This will essentially determine the size of the spotted FVGs, with lower sensitivies resulting in spotting bigger FVGs, and higher sensitivies resulting in spotting all sizes of FVGs.
Swing Length -> Swing length is used when finding order block formations. Smaller values will result in finding smaller order & breaker blocks.
Require Retracement ->
a) Disabled : The entry signal is given immediately once a FVG overlaps with a Breaker Block of the same type.
b) Enabled : The current price of the ticker will need to touch the FVG once more before the entry signal is given.
2. TP / SL
TP / SL Method ->
a) Unicorn : This is the default option. The SL will be set to the lowest low of the last 100 bars with an extra offset in a Buy signal. For Sell signals, the SL will be set to the highest high of the last 100 bars with an extra offset. The TP is then set to a value using the SL value and maintaining a risk-reward ratio.
b) Dynamic: The TP / SL zones will be auto-determined by the algorithm based on the Average True Range (ATR) of the current ticker.
c) Fixed : You can adjust the exact TP / SL ratios from the settings below.
Dynamic Risk -> The risk you're willing to take if "Dynamic" TP / SL Method is selected. Higher risk usually means a better winrate at the cost of losing more if the strategy fails. This setting is has a crucial effect on the performance of the indicator, as different tickers may have different volatility so the indicator may have increased performance when this setting is correctly adjusted.

Unicorn ICT Signals [TradingFinder] Breaker Block + FVG Zones🔵 Introduction
The "ICT Unicorn Model" trading strategy in the "Inner Circle Trader" (ICT) style is one of the well-known strategies in the world of Forex and financial market trading.
The ICT methodology was developed by Michael Huddleston and is based on technical analysis and Price Action concepts.
This style focuses specifically on interpreting price movements and identifying optimal entry and exit points in the market.
In the Unicorn strategy, traders seek points where the probability of price reversal or trend continuation is high. This strategy is primarily based on recognizing and analyzing Price Action patterns and market structure.
By understanding"ICT Unicorn Model", traders can make more informed decisions about where to enter or exit trades, thereby increasing their chances of success in the market.
🟣 Understanding the Breaker Block
A Breaker Block is a specialized form of an Order Block that changes its role after a key market level is broken. Typically, an Order Block is an area on the chart where large institutional orders are likely to be placed, providing strong support or resistance.
However, when this area is breached, and the price moves in the opposite direction, it transforms into what is known as a Breaker Block. This shift indicates a reversal in market sentiment, turning the previous support into resistance or vice versa, thereby signaling a potential trend change to traders.
🟣 The Significance of the Fair Value Gap (FVG)
The Fair Value Gap (FVG) refers to an area on a price chart where the price rapidly moves through a level, leaving behind a gap. This gap represents an imbalance between supply and demand and is often seen as a potential area for price to return and fill the gap.
These zones are crucial for traders as they can indicate future price movements, providing opportunities to enter or exit trades.
🟣 Defining the ICT Unicorn Model
When an FVG overlaps with a Breaker Block, it forms a highly significant trading area known as a Unicorn. This overlap creates an ideal zone for traders to enter the market, as it combines two powerful technical signals.
The Unicorn Model is therefore considered an optimal strategy for identifying precise entry and exit points in the financial markets.
Demand ICT Unicorn Model :
Supply ICT Unicorn Model :
🔵 How to Use
🟣 Bullish ICT Unicorn
The Bullish ICT Unicorn model is applicable when the market is in an uptrend, and traders are seeking buying opportunities.
Follow these steps to identify Bullish ICT Unicorn :
Identify the Bullish Breaker Block : Locate an area where the price moved upward after breaking an Order Block. This area now acts as a Breaker Block.
Identify the Bullish FVG : Look for a Fair Value Gap near the Breaker Block.
Confirm the Unicorn : When the Bullish Breaker Block and Bullish FVG overlap, a Bullish Unicorn is confirmed. Traders can enter a buy position when the price returns to this zone.
🟣Bearish ICT Unicorn
The Bearish ICT Unicorn model is used when the market is in a downtrend, and traders are looking for selling opportunities.
To identify Bearish ICT Unicorn, follow these steps :
Identify the Bearish Breaker Block : Find an area where the price moved downward after breaking an Order Block. This area now acts as a Breaker Block.
Identify the Bearish FVG : Check if a Fair Value Gap has formed near the Breaker Block.
Confirm the Unicorn : When the Bearish Breaker Block and Bearish FVG overlap, a Bearish Unicorn is confirmed. Traders can enter a sell position when the price returns to this zone.
🔵 Setting
🟣 Global Setting
Pivot Period of Order Blocks Detector : Enter the desired pivot period to identify the Order Block.
Order Block Validity Period (Bar) : You can specify the maximum time the Order Block remains valid based on the number of candles from the origin.
Mitigation Level Breaker Block : Determining the basic level of a Breaker Block. When the price hits the basic level, the Breaker Block due to mitigation.
Mitigation Level FVG : Determining the basic level of a FVG. When the price hits the basic level, the FVG due to mitigation.
Mitigation Level Unicorn : Determining the basic level of a Unicorn Block. When the price hits the basic level, the Unicorn Block due to mitigation.
🟣 Unicorn Block Display
Show All Unicorn Block : If it is turned off, only the last Order Block will be displayed.
Demand Unicorn Block : Show or not show and specify color.
Supply Unicorn Block : Show or not show and specify color.
🟣 Breaker Block Display
Show All Breaker Block : If it is turned off, only the last Breaker Block will be displayed.
Demand Main Breaker Block : Show or not show and specify color.
Demand Sub (Propulsion & BoS Origin) Breaker Block : Show or not show and specify color.
Supply Main Breaker Block : Show or not show and specify color.
Supply Sub (Propulsion & BoS Origin) Breaker Block : Show or not show and specify color.
🟣 Fair Value Gap Display
Show Bullish FVG : Toggles the display of demand-related boxes.
Show Bearish FVG : Toggles the display of supply-related boxes.
🟣 Logic Settings
🟣 Order Block Refinement
Refine Order Blocks : Enable or disable the refinement feature. Mode selection.
🟣 FVG Filter
FVG Filter : This refines the number of identified FVG areas based on a specified algorithm to focus on higher quality signals and reduce noise.
Types of FVG filters :
Very Aggressive Filter: Adds a condition where, for an upward FVG, the last candle's highest price must exceed the middle candle's highest price, and for a downward FVG, the last candle's lowest price must be lower than the middle candle's lowest price. This minimally filters out FVGs.
Aggressive Filter: Builds on the Very Aggressive mode by ensuring the middle candle is not too small, filtering out more FVGs.
Defensive Filter: Adds criteria regarding the size and structure of the middle candle, requiring it to have a substantial body and specific polarity conditions, filtering out a significant number of FVGs.
Very Defensive Filter: Further refines filtering by ensuring the first and third candles are not small-bodied doji candles, retaining only the highest quality signals.
🟣 Alert
Alert Name : The name of the alert you receive.
Alert ICT Unicorn Model Block Mitigation :
On / Off
Message Frequency :
This string parameter defines the announcement frequency. Choices include: "All" (activates the alert every time the function is called), "Once Per Bar" (activates the alert only on the first call within the bar), and "Once Per Bar Close" (the alert is activated only by a call at the last script execution of the real-time bar upon closing). The default setting is "Once per Bar".
Show Alert Time by Time Zone :
The date, hour, and minute you receive in alert messages can be based on any time zone you choose. For example, if you want New York time, you should enter "UTC-4". This input is set to the time zone "UTC" by default.
🔵Conclusion
The Unicorn Model in ICT, utilizing the concepts of Breaker Blocks and Fair Value Gaps, provides an effective tool for identifying entry and exit points in financial markets. By offering more precise signals, this model helps traders make better decisions and minimize trading risks.
Success in applying this model requires practice and a deep understanding of market structure, but it can significantly improve trading performance.

Fair Value Gap & Gap Profile [BigBeluga]This indicator is designed to help traders identify and utilize fair value gaps on price charts and analyze volume at these points. These gaps, formed by significant price movements, can act as key support and resistance levels. The indicator enhances trading strategies by visually representing these gaps, making it easier for traders to spot potential entry and exit points.
⦿ What Is A Fair Value Gap?
Before diving into the practical use of the Fair Value Gap in trading, it's crucial to have a clear understanding of what it is and how to identify it on your charts. The Fair Value Gap, or FVG , is a widely utilized tool among price action traders to detect market inefficiencies or imbalances. Sometimes you will even see them labeled as inefficiencies by other traders. These imbalances arise when buying or selling pressure is significant, resulting in a large upward or downward move, leaving behind an imbalance in the market.
The idea behind FVGs is that the market will eventually come back to these inefficiencies in the market before continuing in the same direction as the initial impulsive move. FVGs are important since traders can achieve an edge in the market. Price action traders can also use these imbalances as entry or exit points in the market.
By visually representing gaps and their profile, the Fair Value Gap (FVG) & Gap Profile indicator provides a historical overview of gaps within a specified lookback period, showing the distribution and density of gaps across different price levels. This insight helps traders identify zones where the price tends to move more fluidly, often encountering less resistance. High points on the Gap Profile indicate areas where gaps have occurred frequently in the past, which could serve as potential breakout or breakdown zones.
⦿ Key Features:
● Gap Detection and Visualization:
- Identifies Bullish and Bearish Gaps: Highlights gaps where the price moved significantly up or down along with a volume. Intensivity of color show strength of FVG by volume
- Filter for Significant Gaps: Allows users to filter out insignificant gaps, ensuring only relevant gaps are displayed.
● Customizable Display Options:
- Shows Filled Gaps: Option to display gaps that have been filled, aiding in the analysis of historical price movements.
- Displays Filled Gap Levels: Highlights the levels of filled gaps.
● Gap Profile:
Gap Profile Insight: The Gap Profile feature shows the distribution of gaps over a specified lookback period. High points on the FVG Profile indicate areas with a significant number of gaps in the past. These high points are signs of low resistance for price movement. Consequently, at these points, the price tends to move more easily without encountering strong resistance. Traders can use this information to identify potential breakout or breakdown zones where price action is likely to be more fluid.
● Grab Liquidity Detection:
- Collect liquidity Signals: Plots markers on the chart where price interacts with gap levels, providing potential trade signals based on liquidity.
⦿ How Traders Can Use This Indicator:
- Plan Trades: Use gaps as potential entry and exit points, based on whether the price is approaching, filling, or moving away from a gap.
- Analyze Market Trends: Understand historical price movements by analyzing filled gaps and their impact on current price action.
- Analyze Gap Profile: Identify zones where the price tends to move more fluidly, often encountering less resistance. High points on the Gap Profile indicate areas where gaps have occurred frequently in the past, which could serve as potential breakout or breakdown zones.
- Price imbalance: market will eventually come back to these inefficiencies and fill them. inefficiencies or imbalances in the market usually act as a magnet for price.
By incorporating the Fair Value Gap & Gap Profile indicator into their trading strategy, traders can gain a clearer understanding of market dynamics and make more informed trading decisions.

FVG Price & Volume Graph [LuxAlgo]The FVG Price & Volume Graph tool plot recently detected fair value gaps relative to the volume traded within their area during their formation. This allows us to effectively visualize significant fair value gaps caused by high liquidity.
The indicator also returns levels from the fair value gaps areas average with the highest associated volume.
Do note that the indicator can consider the chart's visible range when being computed, which will recalculate the indicator when the chart's visible range changes.
🔶 USAGE
Fair Value Gaps (FVG) are core price action concepts occurring when the disparity between supply and demand is significant. Price has a tendency to come back to those areas and mitigating them, that is filling them.
The provided tools allow for effective visualization of both FVG's area's height as well as the volume originating from their creation, which is defined by the total traded volume located within the FVG during its creation. FVG's with more associated volume are displayed to the rightmost of the chart.
Users can determine the amount of most recent FVG's to display from the "Display Amount" setting. Disabling the "Consider Mitigation" setting will return mitigated FVGs in the plot, which can be useful to know where most FVGs were located.
We can use the area average of the FVGs with the most associated volume as potential support/resistance levels. Users can extend more FVG's averages by increasing the "Highest Volume Averages" setting.
🔹 Visualizing Volume/Price Relationships of FVG's
A linear regression is fit between FVG's areas average and their associated volume, with this linear regression helping us see where FVG's with specific volume might be located in the future based on existing FVG's.
Note that FVG's do not tend to exhibit linear relationships with their associated volume, the provided linear regression can give a general sense of tendency, but nothing necessarily accurate.
🔶 DETAILS
🔹 Intrabar Data TF
Given a formation of three candles causing an FVG, the volume traded within that FVG area is obtained by looking at the lower timeframe intrabar candles located within the intermediary candle of the formation. The volume of the intrabar candles located within the FVG areas is added up to obtain the associated volume of the FVG.
Using a lower "Intrabar Data TF" allows obtaining more precise volume results, at the cost of computation time and data availability (if there is a high difference between the "Intrabar Data TF" and the chart TF then less FVG can have their associated volume calculated due to Tradingview limitations).
🔹 Display
Users have access to multiple graphical settings affecting how the indicator is displayed.
The "Graph Resolution" setting determines the length of the X axis, with higher values returning more precise results on the location of FVGs over the X axis. Users can also control the number of labels displayed on the X-axis using the numerical input to the right of "Show X-Axis Labels".
Additionally, users can color FVG areas using a gradient relative to the size of the area, or the volume associated with the FVG.
🔶 SETTINGS
Display Amount: Amount of most recent FVGs to display.
Highest Volume Averages: Amount of FVG averages levels with the highest volume to display and extend.
Consider Mitigation: Only display unmitigated FVGs.
Filter FVGs Outside Visible Range: Only display FVGs areas that are located within the user chart visible range.
Intrabar Data TF: Timeframe used to obtain intrabar data. Should be lower than the user chart timeframe.

Uptrick: FVG Market Zones**Uptrick: FVG Market Zones**
---
### Introduction
**Uptrick: FVG Market Zones** is a cutting-edge technical analysis tool designed to identify and visualize Fair Value Gaps (FVGs) within financial markets. This indicator focuses on pinpointing critical price levels where significant gaps occur, which can act as potential support and resistance zones. By integrating advanced volatility analysis and user-configurable parameters, the **Uptrick: FVG Market Zones** provides traders with a robust framework for understanding market dynamics and making informed trading decisions.
### Purpose and Functionality
The primary purpose of the **Uptrick: FVG Market Zones** indicator is to detect and highlight Fair Value Gaps, which are areas on a price chart where there is a significant price movement without any trading activity in between. These gaps can provide critical insights into market behavior, as they often indicate areas where the market has not fully accounted for the supply and demand dynamics. Traders use these zones to anticipate potential reversals, breakouts, or consolidations, making this tool highly valuable for both short-term and long-term trading strategies.
### Unique Features and Originality
The **Uptrick: FVG Market Zones** indicator is distinguished by its focus on FVGs and its ability to integrate this concept into a broader market analysis framework. Unlike other indicators that may offer generalized support and resistance levels, this tool specifically identifies and visualizes gaps based on volatility-adjusted criteria. This precision allows traders to focus on the most relevant market zones, improving their ability to anticipate market movements.
One of the standout features of this indicator is its user-configurable settings, which provide a high degree of customization. This flexibility ensures that traders can tailor the indicator to suit their specific trading style and the particular market they are analyzing. Additionally, the indicator's visualization capabilities are enhanced with customizable colors and gap-filling options, making it easier for traders to interpret and act on the information presented.
### Inputs and Configurations
**Uptrick: FVG Market Zones** comes with several user inputs that allow traders to customize the indicator's behavior and appearance. Each input plays a crucial role in determining how the indicator identifies and visualizes FVGs on the chart. Here’s a detailed breakdown of each input:
1. **FVG Analysis Period (fvgPeriod):**
- **Description:** This input determines the period over which the indicator analyzes the chart for identifying FVGs. By adjusting this value, traders can control how far back in time the indicator looks to detect significant gaps.
- **Default Value:** 25
- **Purpose:** A shorter period may focus on more recent market activity, making the indicator more sensitive to recent price movements. In contrast, a longer period allows the indicator to identify gaps that have remained unfilled for an extended time, potentially acting as stronger support or resistance levels.
2. **Analysis Mode (mode):**
- **Description:** The Analysis Mode input allows traders to choose between different methods of analyzing the chart for FVGs.
- **Options:** "Recent Gaps" and "Extended View"
- **Default Option:** "Recent Gaps"
- **Purpose:**
- **Recent Gaps:** Focuses on the latest significant gaps, providing traders with up-to-date information on the most relevant market zones.
- **Extended View:** Considers a broader range of gap patterns, which can be useful in markets where historical gaps may still influence current price action.
3. **Volatility Sensitivity (volatilityFactor):**
- **Description:** This input adjusts the sensitivity of the indicator to market volatility. It is used in calculating the threshold for identifying FVGs.
- **Default Value:** 0.3
- **Step Size:** 0.1
- **Purpose:** A higher sensitivity will cause the indicator to detect smaller gaps, which might be more frequent but less significant. Lower sensitivity focuses on larger, more impactful gaps, which are less frequent but potentially more powerful in predicting market behavior.
4. **Highlight Market Gaps (showGaps):**
- **Description:** A boolean input that determines whether the identified FVGs should be highlighted on the chart.
- **Default Value:** True
- **Purpose:** This input allows traders to toggle the visualization of FVGs. When enabled, the indicator highlights gaps using colored boxes, making them visually prominent on the chart.
5. **Bullish Highlight Color (bullColor):**
- **Description:** Sets the color used to highlight bullish FVGs (gaps that may indicate support).
- **Default Value:** #00FF7F (a shade of green)
- **Purpose:** The color choice is crucial for quickly distinguishing bullish zones from bearish ones. Green is typically associated with upward price movement, making it intuitive for traders to identify potential support areas.
6. **Bearish Highlight Color (bearColor):**
- **Description:** Sets the color used to highlight bearish FVGs (gaps that may indicate resistance).
- **Default Value:** #FF4500 (a shade of red)
- **Purpose:** Red is commonly associated with downward price movement, making it easy for traders to identify potential resistance areas. This color coding helps in quickly assessing the chart.
7. **Fill Gap Areas (fillGaps):**
- **Description:** A boolean input that determines whether the FVGs should be filled with a color on the chart.
- **Default Value:** True
- **Purpose:** Filling the gap areas provides a more solid visual cue for traders. It enhances the visibility of the gaps, making it easier to spot these zones during fast-paced trading sessions.
8. **Hidden Color (hidden):**
- **Description:** A color input that is used when certain elements should be hidden from the chart.
- **Default Value:** color.rgb(0,0,0,100) (a semi-transparent black)
- **Purpose:** This input is useful for controlling the visibility of certain plots or elements on the chart, ensuring that the indicator remains clean and uncluttered.
### Market Gap Detection
The core functionality of the **Uptrick: FVG Market Zones** indicator lies in its ability to detect Fair Value Gaps. These gaps occur when the price makes a significant jump from one level to another without any trading activity in between. The indicator uses a combination of price action analysis and volatility thresholds to identify these gaps.
- **Volatility Measurement:** The indicator begins by measuring market volatility using the Average True Range (ATR). This volatility measurement is then adjusted by the user-defined sensitivity factor, which determines the threshold for identifying significant gaps.
- **Gap Identification:** The indicator checks for instances where the current low is higher than the high two bars ago (bullish gap) or where the current high is lower than the low two bars ago (bearish gap). These conditions signify a potential FVG.
- **Gap Storage and Management:** Once a gap is identified, it is stored in an array. The indicator also manages the size of these arrays based on the selected analysis mode, ensuring that only the most relevant gaps are considered in the analysis.
### Visualization
Visualization is a key component of the **Uptrick: FVG Market Zones** indicator. By providing clear and customizable visual cues, the indicator ensures that traders can quickly and easily interpret the information it provides.
- **Gap Highlighting:** When enabled, the indicator highlights the identified FVGs on the chart using colored boxes. Bullish gaps are highlighted in green, while bearish gaps are highlighted in red. This color coding helps traders instantly recognize potential support and resistance zones.
- **Gap Filling:** The indicator can also fill the identified gaps with a semi-transparent color. This option enhances the visibility of the gaps, making them more prominent on the chart. Filled gaps are particularly useful for traders who want to keep track of these zones over multiple trading sessions.
- **Gap Averages:** The indicator calculates the average level of the identified gaps and plots these averages as lines on the chart. These lines represent the general area of support or resistance based on the detected gaps, providing traders with a reference point for setting their stop losses or profit targets.
- **Text Labels:** The indicator also labels each FVG with the text "FVG" inside the highlighted area. This feature ensures that traders can easily identify these zones even in charts with dense price action.
### Practical Applications
The **Uptrick: FVG Market Zones** indicator is versatile and can be applied to a wide range of trading strategies across different markets and timeframes. Here are a few examples of how this indicator can be used in practice:
1. **Support and Resistance Trading:**
- Traders can use the identified FVGs as dynamic support and resistance levels. By placing their trades based on these levels, they can take advantage of potential reversals or continuations at key market zones.
2. **Gap Filling Strategy:**
- Some traders focus on the concept of gap filling, where the market eventually returns to "fill" the gap created by rapid price movements. The **Uptrick: FVG Market Zones** indicator can
help identify such gaps and anticipate when the market might return to these levels.
3. **Breakout Trading:**
- The indicator can be used to identify breakouts from significant gaps. When the price moves beyond the identified FVGs, it may signal a strong trend continuation, providing an opportunity for breakout traders.
4. **Reversal Trading:**
- By monitoring the signals generated by the indicator, traders can identify potential market reversals. A sell signal after a prolonged uptrend or a buy signal after a downtrend may indicate a reversal, allowing traders to position themselves accordingly.
5. **Risk Management:**
- The average levels of the FVGs can be used to set stop-loss and take-profit levels. By aligning these levels with the FVG zones, traders can improve their risk management practices and enhance their trading discipline.
### Customization and Flexibility
One of the standout features of the **Uptrick: FVG Market Zones** indicator is its high level of customization. Traders can adjust various parameters to tailor the indicator to their specific needs and preferences.
- **Customizable Colors:** The indicator allows traders to choose their preferred colors for highlighting bullish and bearish gaps. This flexibility ensures that the indicator can be integrated seamlessly into any trading setup, regardless of the trader's color scheme preferences.
- **Adjustable Periods and Sensitivity:** By allowing traders to adjust the analysis period and volatility sensitivity, the indicator can be fine-tuned to suit different market conditions. For example, a trader might use a shorter analysis period and higher sensitivity in a volatile market, while opting for a longer period and lower sensitivity in a more stable market.
- **Toggling Visual Elements:** Traders can choose to enable or disable various visual elements of the indicator, such as gap highlighting, gap filling, and text labels. This level of control allows traders to declutter their charts and focus on the information that is most relevant to their trading strategy.
### Advantages and Benefits
The **Uptrick: FVG Market Zones** indicator offers several key advantages that make it a valuable tool for traders:
1. **Precision:** By focusing on Fair Value Gaps, the indicator provides highly precise levels of support and resistance, which are often more reliable than traditional horizontal levels.
2. **Clarity:** The clear visual representation of FVGs, along with the text labels and color coding, ensures that traders can quickly interpret the indicator's signals and incorporate them into their trading decisions.
3. **Adaptability:** The indicator's customizable settings allow it to be adapted to different markets, timeframes, and trading styles. Whether you are a day trader, swing trader, or long-term investor, this indicator can be tailored to meet your needs.
4. **Enhanced Decision-Making:** The trading signals generated by the indicator provide actionable insights that can help traders make more informed decisions. By aligning their trades with the identified FVG zones, traders can improve their chances of success.
5. **Risk Management:** The use of FVG zones as reference points for stop-loss and take-profit levels enhances risk management practices, helping traders protect their capital while maximizing their profit potential.
### Conclusion
The **Uptrick: FVG Market Zones** indicator is a powerful and versatile tool for traders seeking to enhance their market analysis and improve their trading outcomes. By focusing on Fair Value Gaps and providing a high level of customization, this indicator offers a unique blend of precision, clarity, and adaptability. Whether you are looking to identify key market zones, generate trading signals, or improve your risk management practices, the **Uptrick: FVG Market Zones** indicator is a valuable addition to any trader's toolkit.
With its innovative approach to market analysis and user-friendly design, **Uptrick: FVG Market Zones** stands out as an essential tool for traders who want to stay ahead of the market and make more informed trading decisions. Whether you are trading stocks, forex, commodities, or cryptocurrencies, this indicator provides the insights you need to navigate the markets with confidence and success.

ICT Balanced Price Range [TradingFinder] BPR | FVG + IFVG🔵 Introduction
The ICT Balanced Price Range (BPR) indicator is a valuable tool that helps traders identify key areas on price charts where a balance between buyers and sellers is established. These zones can serve as critical points for potential price reversals or continuations.
🟣 Bullish Balanced Price Range
A Bullish BPR forms when a buying pressure zone (Bullish FVG) overlaps with a Bullish Inversion FVG. This overlap indicates a high probability of price moving upwards, making it a crucial area for traders to consider.
🟣 Bearish Balanced Price Range
Similarly, a Bearish BPR is created when a selling pressure zone (Bearish FVG) overlaps with a Bearish Inversion FVG. This zone is often seen as a key area where the price is likely to move downward.
🔵 How to Use
🟣 Identifying the Balanced Price Range (BPR)
To identify the Balanced Price Range (BPR), you must first locate two Fair Value Gaps (FVGs) on the price chart. One FVG should be on the sell side, and the other on the buy side. When these two FVGs horizontally oppose each other, the area where they overlap is recognized as the Balanced Price Range (BPR).
This BPR zone is highly sensitive to price movements due to the combination of two FVGs, often leading to strong market reactions. As the price approaches this area, the likelihood of a significant market move increases, making it a prime target for professional traders.
🟣 Bullish Balanced Price Range (Bullish BPR)
To effectively trade using a Bullish BPR, begin by identifying a bullish market structure and searching for bullish Price Delivery Arrays (PD Arrays). Once the market structure shifts to bullish in a lower time frame, locate a Bullish FVG within the Discount Zone that overlaps with a Bearish FVG.
Mark this overlapping zone and wait for the price to test it before executing a buy trade. Alternatively, you can set a Buy Limit order with a stop loss below the recent swing low and target profits based on higher time frame liquidity draws.
🟣 Bearish Balanced Price Range (Bearish BPR)
For bearish trades, start by identifying a bearish market structure and look for bearish PD Arrays. After the market structure shifts to bearish in a lower time frame, identify a Bearish FVG within the Discount Zone that overlaps with a Bullish FVG. Mark this overlapping zone and execute a sell trade when the price tests it.
You can also use a Sell Limit order with a stop loss above the recent swing high and target profits according to higher time frame liquidity draws.
🔵 Settings
🟣 Global Settings
Show All Inversion FVG & IFVG : If disabled, only the most recent FVG & IFVG will be displayed.
FVG & IFVG Validity Period (Bar) : Determines the maximum duration (in number of candles) that the FVG and IFVG remain valid.
Switching Colors Theme Mode : Includes three modes: "Off", "Light", and "Dark". "Light" mode adjusts colors for light mode use, "Dark" mode adjusts colors for dark mode use, and "Off" disables color adjustments.
🟣 Display Settings
Show Bullish BPR : Toggles the display of demand-related boxes.
Show Bearish BPR : Toggles the display of supply-related boxes.
Mitigation Level BPR : Options include "Proximal", "Distal", or "50 % OB" modes, which you can choose based on your needs. The "50 % OB" line is the midpoint between distal and proximal.
Show Bullish IFVG : Toggles the display of demand-related boxes.
Show Bearish IFV G: Toggles the display of supply-related boxes.
Mitigation Level FVG and IFVG : Options include "Proximal", "Distal", or "50 % OB" modes, which you can choose based on your needs. The "50 % OB" line is the midpoint between distal and proximal.
🟣 Logic Settings
FVG Filter : This refines the number of identified FVG areas based on a specified algorithm to focus on higher quality signals and reduce noise.
Types of FVG filters :
Very Aggressive Filter : Adds a condition where, for an upward FVG, the last candle's highest price must exceed the middle candle's highest price, and for a downward FVG, the last candle's lowest price must be lower than the middle candle's lowest price. This minimally filters out FVGs.
Aggressive Filter : Builds on the Very Aggressive mode by ensuring the middle candle is not too small, filtering out more FVGs.
Defensive Filter : Adds criteria regarding the size and structure of the middle candle, requiring it to have a substantial body and specific polarity conditions, filtering out a significant number of FVGs.
Very Defensive Filte r: Further refines filtering by ensuring the first and third candles are not small-bodied doji candles, retaining only the highest quality signals.
🟣 Alert Settings
Alert Inversion FVG Mitigation : Enables alerts for Inversion FVG mitigation.
Message Frequency : Determines the frequency of alerts. Options include 'All' (every function call), 'Once Per Bar' (first call within the bar), and 'Once Per Bar Close' (final script execution of the real-time bar). Default is 'Once per Bar'.
Show Alert Time by Time Zone : Configures the time zone for alert messages. Default is 'UTC'.
Display More Info : Provides additional details in alert messages, including price range, date, hour, and minute. Set to 'Off' to exclude this information.
🔵 Conclusion
The ICT Balanced Price Range is a powerful and reliable tool for identifying key points on price charts. This strategy can be applied across various time frames and serves as a complementary tool alongside other indicators and technical analysis methods.
The most crucial aspect of utilizing this strategy effectively is correctly identifying FVGs and their overlapping areas, which comes with practice and experience.

Order Block Overlapping Drawing [TradingFinder]🔵 Introduction
Technical analysis is a fundamental tool in financial markets, helping traders identify key areas on price charts to make informed trading decisions. The ICT (Inner Circle Trader) style, developed by Michael Huddleston, is one of the most advanced methods in this field.
It enables traders to precisely identify and exploit critical zones such as Order Blocks, Breaker Blocks, Fair Value Gaps (FVGs), and Inversion Fair Value Gaps (IFVGs).
To streamline and simplify the use of these key areas, a library has been developed in Pine Script, the scripting language for the TradingView platform. This library allows you to automatically detect overlapping zones between Order Blocks and other similar areas, and visually display them on your chart.
This tool is particularly useful for creating indicators like Balanced Price Range (BPR) and ICT Unicorn Model.
🔵 How to Use
This section explains how to use the Pine Script library. This library assists you in easily identifying and analyzing overlapping areas between Order Blocks and other zones, such as Breaker Blocks and Fair Value Gaps.
To add "Order Block Overlapping Drawing", you must first add the following code to your script.
import TFlab/OrderBlockOverlappingDrawing/1
🟣 Inputs
The library includes the "OBOverlappingDrawing" function, which you can use to detect and display overlapping zones. This function identifies and draws overlapping zones based on the Order Block type, trigger conditions, previous and current prices, and other relevant parameters.
🟣 Parameters
OBOverlappingDrawing(OBType , TriggerConditionOrigin, distalPrice_Pre, proximalPrice_Pre , distalPrice_Curr, proximalPrice_Curr, Index_Curr , OBValidGlobal, OBValidDis, MitigationLvL, ShowAll, Show, ColorZone) =>
OBType (string)
TriggerConditionOrigin (bool)
distalPrice_Pre (float)
proximalPrice_Pre (float)
distalPrice_Curr (float)
proximalPrice_Curr (float)
Index_Curr (int)
OBValidGlobal (bool)
OBValidDis (int)
MitigationLvL (string)
ShowAll (bool)
Show (bool)
ColorZone (color)
In this example, various parameters are defined to detect overlapping zones and draw them on the chart. Based on these settings, the overlapping areas will be automatically drawn on the chart.
OBType : All order blocks are summarized into two types: "Supply" and "Demand." You should input your Current order block type in this parameter. Enter "Demand" for drawing demand zones and "Supply" for drawing supply zones.
TriggerConditionOrigin : Input the condition under which you want the Current order block to be drawn in this parameter.
distalPrice_Pre : Generally, if each zone is formed by two lines, the farthest line from the price is termed Pervious "Distal." This input receives the price of the "Distal" line.
proximalPrice_Pre : Generally, if each zone is formed by two lines, the nearest line to the price is termed Previous "Proximal" line.
distalPrice_Curr : Generally, if each zone is formed by two lines, the farthest line from the price is termed Current "Distal." This input receives the price of the "Distal" line.
proximalPrice_Curr : Generally, if each zone is formed by two lines, the nearest line to the price is termed Current "Proximal" line.
Index_Curr : This input receives the value of the "bar_index" at the beginning of the order block. You should store the "bar_index" value at the occurrence of the condition for the Current order block to be drawn and input it here.
OBValidGlobal : This parameter is a boolean in which you can enter the condition that you want to execute to stop drawing the block order. If you do not have a special condition, you should set it to True.
OBValidDis : Order blocks continue to be drawn until a new order block is drawn or the order block is "Mitigate." You can specify how many candles after their initiation order blocks should continue. If you want no limitation, enter the number 4998.
MitigationLvL : This parameter is a string. Its inputs are one of "Proximal", "Distal" or "50 % OB" modes, which you can enter according to your needs. The "50 % OB" line is the middle line between distal and proximal.
ShowAll : This is a boolean parameter, if it is "true" the entire order of blocks will be displayed, and if it is "false" only the last block order will be displayed.
Show : You may need to manage whether to display or hide order blocks. When this input is "On", order blocks are displayed, and when it's "Off", order blocks are not displayed.
ColorZone : You can input your preferred color for drawing order blocks.
🟣 Output
Mitigation Alerts : This library allows you to leverage Mitigation Alerts to detect specific conditions that could lead to trend reversals. These alerts help you react promptly in your trades, ensuring better management of market shifts.
🔵 Conclusion
The Pine Script library provided is a powerful tool for technical analysis, especially in the ICT style. It enables you to detect overlapping zones between Order Blocks and other significant areas like Breaker Blocks and Fair Value Gaps, improving your trading strategies. By utilizing this tool, you can perform more precise analysis and manage risks effectively in your trades.

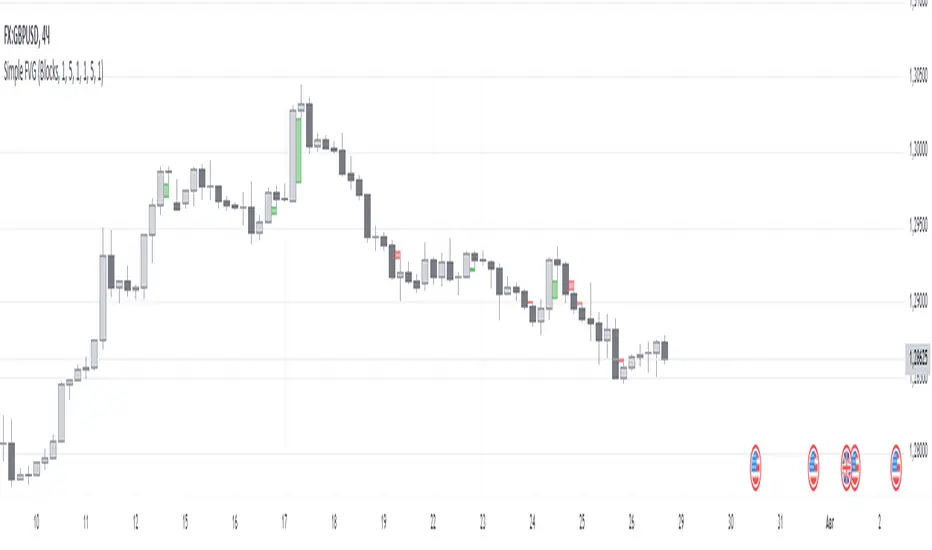
Simple FVGSimple FVG - Fair Value Gap Indicator
Overview:
The "Simple FVG" script is designed for use with TradingView to identify and visually display Fair Value Gaps (FVG) on a trading chart. This indicator highlights both bullish and bearish imbalances based on specific candlestick patterns, helping traders to quickly identify potential trading opportunities.
Key Features:
Bullish and Bearish Imbalances:
Bullish Imbalances: This script identifies bullish imbalances where the price exhibits a gap upward. The conditions for detecting a bullish imbalance are:
The high of the second candle is greater than the high of the first candle.
The low of the third candle is greater than the high of the first candle.
Bearish Imbalances: This script identifies bearish imbalances where the price exhibits a gap downward. The conditions for detecting a bearish imbalance are:
The low of the second candle is less than the low of the first candle.
The high of the third candle is less than the low of the first candle.
Customizable Display:
Bullish Blocks: Users can toggle the display of bullish imbalance blocks with customizable colors and border settings.
Bearish Blocks: Users can toggle the display of bearish imbalance blocks with customizable colors and border settings.
Color and Border Settings: Adjust the color, border color, and border width of the blocks for both bullish and bearish imbalances according to user preferences.
Visual Representation:
Drawing Blocks: The script draws filled boxes on the chart to represent identified imbalances. These blocks span from the start of the first candlestick to the end of the third candlestick, providing a clear visual indicator of the price gap.
How It Works:
Identification Logic:
The script analyzes three consecutive candles to determine if an imbalance exists.
It compares the highs and lows of these candles to establish bullish or bearish conditions.
Drawing Mechanism:
Once an imbalance condition is met, the script calculates the top and bottom levels of the imbalance block based on the high of the first candle and the low of the third candle for bullish imbalances, and vice versa for bearish imbalances.
It then draws these blocks on the chart using the specified colors and border settings.
Usage Instructions:
Add the Indicator:
Apply the "Simple FVG" indicator to your TradingView chart.
Customize Settings:
Use the input options to enable or disable the display of bullish and bearish blocks.
Adjust the colors and border settings for the imbalance blocks as needed.
Interpret Imbalances:
Look for the drawn blocks to identify potential areas where price imbalances have occurred.
Use this information to inform your trading decisions.
Originality and Value:
The "Simple FVG" script offers a unique approach to visualizing Fair Value Gaps by focusing on specific candlestick patterns. It provides traders with a tool to easily identify and analyze price imbalances, enhancing chart analysis and trading strategy development.
Chart Information:
Ensure to show the complete symbol, timeframe, and script name information on your chart for clarity and reference.
For further details and usage guidelines, refer to the TradingView House Rules.
Note: This script adheres to TradingView's guidelines for originality and usefulness, offering a practical tool for traders seeking to enhance their chart analysis.
This description adheres to TradingView's requirements by providing a detailed explanation of the script's functionality, how it works, and how users can benefit from it.
FVG (ICT) with Swing LevelsThis indicator, called "Fair Value Gaps (ICT) with Swing Levels", overlays on the main chart and does the following:
Initial Setup:
It defines user-adjustable parameters:
lookback: Lookback period to keep FVGs visible.
swingPeriod: Period for calculating swing highs and lows.
bullColor and bearColor: Colors for bullish and bearish FVGs.
Fair Value Gaps (FVGs) Detection:
Uses a function to identify FVGs by comparing candle high and low prices.
A bullish FVG forms when the low of two candles ago is higher than the high of the current candle.
A bearish FVG forms when the high of two candles ago is lower than the low of the current candle.
Swing Levels Calculation:
Calculates swing highs and lows over the specified period.
These swing levels define the current market range.
Current Range Verification:
Implements a function to check if an FVG is within the range defined by swing levels.
This ensures only the most relevant FVGs for the current market situation are displayed.
FVG Drawing:
When it detects an FVG (bullish or bearish) within the current range, it draws a box on the chart.
Boxes extend from the bar where the FVG formed to the current bar.
Bullish FVGs are drawn in green and bearish in red (colors are customizable).
Old FVGs Management:
On each new bar, the indicator checks all existing FVG boxes.
It removes boxes that are outside the specified lookback period.
It also removes boxes that are no longer within the current range of swing levels.
Swing Levels Visualization:
Draws lines on the chart to show swing highs (in blue) and swing lows (in purple).
These lines help visualize the current market range.
Continuous Update:
The indicator updates on each new candle, constantly refreshing FVGs and swing levels.
In summary, this indicator identifies and visualizes Fair Value Gaps according to the ICT methodology, filtering them based on higher timeframe swing levels. This helps traders focus on the most significant FVGs within the current market context, reducing visual noise and potentially improving trading decision-making.

FVG Instantaneous Mitigation Signals [LuxAlgo]The FVG Instantaneous Mitigation Signals indicator detects and highlights "instantaneously" mitigated fair value gaps (FVG), that is FVGs that get mitigated one bar after their creation, returning signals upon mitigation.
Take profit/stop loss areas, as well as a trailing stop loss are also included to complement the signals.
🔶 USAGE
Instantaneous Fair Value Gap mitigation is a new concept introduced in this script and refers to the event of price mitigating a fair value gap one bar after its creation.
The resulting signal sentiment is opposite to the bias of the mitigated fair value gap. As such an instantaneously mitigated bearish FGV results in a bullish signal, while an instantaneously mitigated bullish FGV results in a bearish signal.
Fair value gap areas subject to instantaneous mitigation are highlighted alongside their average level, this level is extended until reached in a direction opposite to the FVG bias and can be used as a potential support/resistance level.
Users can filter out less volatile fair value gaps using the "FVG Width Filter" setting, with higher values highlighting more volatile fair value gaps subject to instantaneous mitigation.
🔹 TP/SL Areas
Users can enable take-profit/stop-loss areas. These are displayed upon a new signal formation, with an area starting from the mitigated FVG area average to this average plus/minus N ATRs, where N is determined by their respective multiplier settings.
Using a higher multiplier will return more distant areas from the price, requiring longer-term variations to be reached.
🔹 Trailing Stop Loss
A trailing-stop loss is included, increasing when the price makes a new higher high or lower low since the trailing has been set. Using a higher trailing stop multiplier will allow its initial position to be further away from the price, reducing its chances of being hit.
The trailing stop can be reset on "Every Signal", whether they are bullish or bearish, or only on an "Inverse Signal", which will reset the trailing when a signal of opposite bias is detected, this will preserve an existing trailing stop when a new signal of the same bias to the present one is detected.
🔶 DETAILS
Fair Value Gaps are ubiquitous to price action traders. These patterns arise when there exists a disparity between supply and demand. The action of price coming back and filling these imbalance areas is referred to as "mitigation" or "rebalancing".
"Instantaneous mitigation" refers to the event of price quickly mitigating a prior fair value gap, which in the case of this script is one bar after their creation. These events are indicative of a market more attentive to imbalances, and more willing to correct disparities in supply and demand.
If the market is particularly sensitive to imbalances correction then these can be excessively corrected, leading to further imbalances, highlighting a potential feedback process.
🔶 SETTINGS
FVG Width Filter: Filter out FVGs with thinner areas from returning a potential signal.
🔹 TP/SL
TP Area: Enable take-profit areas for new signals.
Multiplier: Control the distance from the take profit and the price, with higher values returning more distant TP's.
SL Area: Enable stop-loss areas for new signals.
Multiplier: Control the distance from the stop loss and the price, with higher values returning more distant SL's.
🔹 Trailing Stop
Reset Trailing Stop: Determines when the trailing stop is reset.
Multiplier: Controls the initial position of the trailing stop, with higher values returning more distant trailing stops.

Fair Value Gap (FVG) Oscillator [UAlgo]The "Fair Value Gap (FVG) Oscillator " is designed to identify and visualize Fair Value Gaps (FVG) within a given lookback period on a trading chart. This indicator helps traders by highlighting areas where price gaps may signify potential trading opportunities, specifically bullish and bearish patterns. By leveraging volume and Average True Range (ATR) data, the FVG Oscillator aims to enhance the accuracy of pattern recognition and provide more reliable signals for trading decisions.
🔶 Identification of Fair Value Gap (FVG)
Fair Value Gaps (FVG) are specific price areas where gaps occur, and they are often considered significant in technical analysis. These gaps can indicate potential future price movements as the market may return to fill these gaps. This indicator identifies two types of FVGs:
Bullish FVG: Occurs when the current low price is higher than the high price two periods ago. This condition suggests a potential upward price movement.
Obtains with:
low > high
Bearish FVG: Occurs when the current high price is lower than the low price two periods ago. This condition suggests a potential downward price movement.
Obtains with:
high < low
The FVG Oscillator not only identifies these gaps but also verifies them using volume and ATR conditions to ensure more reliable trading signals.
🔶 Key Features
Lookback Period: Users can set the lookback period to determine how far back the indicator should search for FVG patterns.
ATR Multiplier: The ATR Multiplier is used to adjust the sensitivity of the ATR-based conditions for verifying FVG patterns.
Volume SMA Period: This setting determines the period for the Simple Moving Average (SMA) of the volume, which helps in identifying high volume conditions.
Why ATR and Volume are Used?
ATR (Average True Range) and volume are integrated into the Fair Value Gap (FVG) Oscillator to enhance the accuracy and reliability of the identified patterns. ATR measures market volatility, helping to filter out insignificant price gaps and focus on impactful ones, ensuring that the signals are relevant and strong. Volume, on the other hand, confirms the strength of price movements. High volume often indicates the sustainability of these movements, reducing the likelihood of false signals. Together, ATR and volume ensure that the detected FVGs are both significant and supported by market activity, providing more trustworthy trading signals.
Normalized Values: The FVG counts are normalized to enhance the visual representation and interpretation of the patterns on the chart.
Visual Customization and Plotting: Users can customize the colors for positive (bullish) and negative (bearish) areas, and choose whether to display these areas on the chart, also plots the bullish and bearish FVG counts, a zero line, and the net value of FVG counts. Additionally, it uses histograms to display the width of verified bullish and bearish patterns.
🔶 Disclaimer:
Use with Caution: This indicator is provided for educational and informational purposes only and should not be considered as financial advice. Users should exercise caution and perform their own analysis before making trading decisions based on the indicator's signals.
Not Financial Advice: The information provided by this indicator does not constitute financial advice, and the creator (UAlgo) shall not be held responsible for any trading losses incurred as a result of using this indicator.
Backtesting Recommended: Traders are encouraged to backtest the indicator thoroughly on historical data before using it in live trading to assess its performance and suitability for their trading strategies.
Risk Management: Trading involves inherent risks, and users should implement proper risk management strategies, including but not limited to stop-loss orders and position sizing, to mitigate potential losses.
No Guarantees: The accuracy and reliability of the indicator's signals cannot be guaranteed, as they are based on historical price data and past performance may not be indicative of future results.

Inversion Fair Value Gaps [TradingFinder] IFVG ICT Signal| Alert🔵 Introduction
🟣 Inversion Fair Value Gap (IFVG)
An ICT Inversion Fair Value Gap, or reverse FVG, occurs when a fair value gap fails to hold its price, resulting in the price moving beyond and breaking the gap. This situation marks the initial change in price momentum.
Generally, prices respect fair value gaps and continue in their trend direction. However, when a fair value gap is breached, it transforms into an inversion fair value gap, signaling a potential short-term reversal or a subsequent change in direction.
🔵 How to Use
🟣 Identifying an Inversion Fair Value Gap
To spot an IFVG, you must first identify a fair value gap.
Inversion fair value gaps can be categorized into two types :
🟣 Bullish Inversion Fair Value Gap
A bullish IFVG occurs when a bearish fair value gap is invalidated by the price closing above it.
Steps to identify it :
Identify a bearish fair value gap.
When the price closes above this gap, it becomes a bullish inversion fair value gap.
This gap acts as a support level, pushing the price upwards and indicating a shift in momentum from sellers to buyers.
🟣 Bearish Inversion Fair Value Gap
A bearish IFVG happens when a bullish fair value gap fails, with the price closing below it.
Steps to identify it :
Identify a bullish fair value gap.
When the price closes below this gap, it becomes a bearish inversion fair value gap.
This gap acts as a resistance level, pushing the price downwards and indicating a shift in momentum from buyers to sellers.
🔵 Settings
🟣 Global Settings
Show All Inversion FVG: If disabled, only the most recent FVG will be displayed.
IFVG Validity Period (Bar): Determines the maximum duration (in number of candles) that the FVG and IFVG remain valid.Switching Colors Theme Mode: Includes three modes: "Off", "Light", and "Dark". "Light" mode adjusts colors for light mode use, "Dark" mode adjusts colors for dark mode use, and "Off" disables color adjustments.
🟣 Logic Settings
FVG Filter : This refines the number of identified FVG areas based on a specified algorithm to focus on higher quality signals and reduce noise.
Types of FVG filters :
Very Aggressive Filter : Adds a condition where, for an upward FVG, the last candle's highest price must exceed the middle candle's highest price, and for a downward FVG, the last candle's lowest price must be lower than the middle candle's lowest price. This minimally filters out FVGs.
Aggressive Filte r: Builds on the Very Aggressive mode by ensuring the middle candle is not too small, filtering out more FVGs.
Defensive Filter : Adds criteria regarding the size and structure of the middle candle, requiring it to have a substantial body and specific polarity conditions, filtering out a significant number of FVGs.
Very Defensive Filter : Further refines filtering by ensuring the first and third candles are not small-bodied doji candles, retaining only the highest quality signals.
Mitigation Level FVG and IFVG : Options include "Proximal", "Distal", or "50 % OB" modes, which you can choose based on your needs. The "50 % OB" line is the midpoint between distal and proximal.
🟣 Display Settings
Show Bullish IFVG : Toggles the display of demand-related boxes.
Show Bearish IFVG : Toggles the display of supply-related boxes.
🟣 Alert Settings
Alert Inversion FVG Mitigation : Enables alerts for Inversion FVG mitigation.
Message Frequency : Determines the frequency of alerts. Options include 'All' (every function call), 'Once Per Bar' (first call within the bar), and 'Once Per Bar Close' (final script execution of the real-time bar). Default is 'Once per Bar'.
Show Alert Time by Time Zone : Configures the time zone for alert messages. Default is 'UTC'.
Display More Info : Provides additional details in alert messages, including price range, date, hour, and minute. Set to 'Off' to exclude this information.

FVG & IFVG ICT [TradingFinder] Inversion Fair Value Gap Signal🔵 Introduction
🟣 Fair Value Gap (FVG)
To spot a Fair Value Gap (FVG) on a chart, you need to perform a detailed candle-by-candle analysis.
Here’s the process :
Focus on Candles with Large Bodies : Identify a candle with a substantial body and examine it alongside the preceding candle.
Check Surrounding Candles : The candles immediately before and after the central candle should have long shadows.
Ensure No Overlap : The bodies of the candles before and after the central candle should not overlap with the body of the central candle.
Determine the FVG Range : The gap between the shadows of the first and third candles forms the FVG range.
🟣 ICT Inversion Fair Value Gap (IFVG)
An ICT Inversion Fair Value Gap, also known as a reverse FVG, is a failed fair value gap where the price does not respect the gap. An IFVG forms when a fair value gap fails to hold the price and the price moves beyond it, breaking the fair value gap.
This marks the initial shift in price momentum. Typically, when the price moves in one direction, it respects the fair value gaps and continues its trend.
However, if a fair value gap is violated, it acts as an inversion fair value gap, indicating the first change in price momentum, potentially leading to a short-term reversal or a subsequent change in direction.
🟣 Bullish Inversion Fair Value Gap (Bullish IFVG)
🟣 Bearish Inversion Fair Value Gap (Bearish IFVG)
🔵 How to Use
🟣 Identify an Inversion Fair Value Gap
To identify an IFVG, you first need to recognize a fair value gap. Just as fair value gaps come in two types, inversion fair value gaps also fall into two categories:
🟣 Bullish Inversion Fair Value Gap
A bullish IFVG is essentially a bearish fair value gap that is invalidated by the price closing above it.
Here’s how to identify it :
Identify a bearish fair value gap.
When the price closes above this bearish fair value gap, it transforms into a bullish inversion fair value gap.
This gap acts as support for the price and drives it upwards, indicating a reduction in sellers' strength and an initial shift in momentum towards buyers.
🟣 Bearish Inversion Fair Value Gap
A bearish IFVG is primarily a bullish fair value gap that fails to hold the price, with the price closing below it.
Here’s how to identify it :
Identify a bullish fair value gap.
When the price closes below this gap, it becomes a bearish inversion fair value gap.
This gap acts as resistance for the price, pushing it downwards. A bearish inversion fair value gap signifies a decrease in buyers' momentum and an increase in sellers' strength.
🔵 Setting
🟣 Global Setting
Show All FVG : If it is turned off, only the last FVG will be displayed.
S how All Inversion FVG : If it is turned off, only the last FVG will be displayed.
FVG and IFVG Validity Period (Bar) : You can specify the maximum time the FVG and the IFVG remains valid based on the number of candles from the origin.
Switching Colors Theme Mode : Three modes "Off", "Light" and "Dark" are included in this parameter. "Light" mode is for color adjustment for use in "Light Mode".
"Dark" mode is for color adjustment for use in "Dark Mode" and "Off" mode turns off the color adjustment function and the input color to the function is the same as the output color.
🟣 Logic Setting
FVG Filter
When utilizing FVG filtering, the number of identified FVG areas undergoes refinement based on a specified algorithm. This process helps to focus on higher quality signals and eliminate noise.
Here are the types of FVG filters available :
Very Aggressive Filter : Introduces an additional condition to the initial criteria. For an upward FVG, the highest price of the last candle must exceed the highest price of the middle candle. Similarly, for a downward FVG, the lowest price of the last candle should be lower than the lowest price of the middle candle. This mode minimally filters out FVGs.
Aggressive Filter : Builds upon the Very Aggressive mode by considering the size of the middle candle. It ensures the middle candle is not too small, thereby eliminating more FVGs compared to the Very Aggressive mode.
Defensive Filter : In addition to the conditions of the Very Aggressive mode, the Defensive mode incorporates criteria regarding the size and structure of the middle candle. It requires the middle candle to have a substantial body, with specific polarity conditions for the second and third candles relative to the first candle's direction. This mode filters out a significant number of FVGs, focusing on higher-quality signals.
Very Defensive Filter : Further refines filtering by adding conditions that the first and third candles should not be small-bodied doji candles. This stringent mode eliminates the majority of FVGs, retaining only the highest quality signals.
Mitigation Level FVG and IFVG : Its inputs are one of "Proximal", "Distal" or "50 % OB" modes, which you can enter according to your needs. The "50 % OB" line is the middle line between distal and proximal.
🟣 Display Setting
Show Bullish FVG : Enables the display of demand-related boxes, which can be toggled on or off.
Show Bearish FVG : Enables the display of supply-related boxes along the path, which can also be toggled on or off.
Show Bullish IFVG : Enables the display of demand-related boxes, which can be toggled on or off.
Show Bearish IFVG : Enables the display of supply-related boxes along the path, which can also be toggled on or off.
🟣 Alert Setting
Alert FVG Mitigation : If you want to receive the alert about FVG's mitigation after setting the alerts, leave this tick on. Otherwise, turn it off.
Alert Inversion FVG Mitigation : If you want to receive the alert about Inversion FVG's mitigation after setting the alerts, leave this tick on. Otherwise, turn it off.
Message Frequency : This parameter, represented as a string, determines the frequency of announcements. Options include: 'All' (triggers the alert every time the function is called), 'Once Per Bar' (triggers the alert only on the first call within the bar), and 'Once Per Bar Close' (activates the alert only during the final script execution of the real-time bar upon closure). The default setting is 'Once per Bar'.
Show Alert time by Time Zone : The date, hour, and minute displayed in alert messages can be configured to reflect any chosen time zone. For instance, if you prefer London time, you should input 'UTC+1'. By default, this input is configured to the 'UTC' time zone.
Display More Info : The 'Display More Info' option provides details regarding the price range of the order blocks (Zone Price), along with the date, hour, and minute. If you prefer not to include this information in the alert message, you should set it to 'Off'.

Double FVG-BPR [QuantVue]The Double FVG BPR Indicator is a versatile tool that helps traders identify potential support and resistance levels through the concept of balanced price ranges.
A Balanced Price Range (BPR) is a zone on a price chart where the market has found equilibrium after a period of price imbalance.
It is identified by detecting a Fair Value Gap (FVG) in one direction, followed by an overlapping Fair Value Gap in the opposite direction.
Components of a Balanced Price Range
Fair Value Gap (FVG): A FVG occurs when there is a rapid price movement, creating a gap in the price chart where minimal trading occurs. This gap represents an imbalance between supply and demand.
Bullish FVG: A bullish FVG is identified when the low of a candle is higher than the high of a candle two periods ago, and the close of the previous candle is higher than the high of that same period.
Bearish FVG: A bearish FVG is identified when the high of a candle is lower than the low of a candle two periods ago, and the close of the previous candle is lower than the low of that same period.
Overlapping Fair Value Gap: For a BPR to be formed, an initial FVG must be followed by an overlapping FVG in the opposite direction. This creates a balanced zone where the price has moved up (or down) quickly and then moved down (or up) with similar intensity, suggesting a temporary equilibrium.
The area between the high and low points of these overlapping FVGs forms the BPR. This zone represents a temporary market equilibrium where supply and demand have balanced out after a period of significant price movement in both directions.
How to Use
Support and Resistance Levels: The upper and lower boundaries of the BPR act as dynamic support and resistance levels. Traders can use these levels to place buy and sell orders, anticipating that the price may find support or face resistance within these zones.
Trend Reversal and Continuation: The BPR can signal potential trend reversals or continuations.
If the price moves back into the BPR after a breakout, it may indicate a reversal. Conversely, if the price breaks out of the BPR with strong momentum, it may signal a trend continuation.

ICT Balance Price Range [UAlgo]The "ICT Balance Price Range " indicator identifies and visualizes potential balance price ranges (BPRs) on a price chart. These ranges are indicative of periods where the market exhibits balance between bullish and bearish forces, often preceding significant price movements.
🔶 What is Balanced Price Range (BPR) ?
Balanced Price Range is a concept based on Fair Value Gap. Balanced price range (BPR) is the area on price chart where two opposite fair value gaps overlap.
When price approaches the Balanced Price Range (BPR), we assume that the price will react quickly and strongly here. This is because its the combination of two fair value gaps and being a good point of interest for smart money traders.
🔶 Key Features:
Bars to Consider: Determines the number of bars to evaluate for BPR conditions.
Threshold for BPR: Sets the minimum range required for a valid BPR to be identified.
Remove Old BPR: Option to automatically remove invalidated BPRs from the chart.
Bearish/Bullish Box Color: Customizable colors for visual representation of bearish and bullish BPRs.
🔶 Disclaimer
This indicator is provided for educational and informational purposes only.
It should not be considered as financial advice or a recommendation to buy or sell any financial instrument.
The use of this indicator involves inherent risks, and users should employ their own judgment and conduct their own research before making any trading decisions. Past performance is not indicative of future results.
🔷 Related Scripts
Fair Value Gaps (FVG)

Fair Value Gaps Setup 01 [TradingFinder] FVG Absorption + CHoCH🔵 Introduction
🟣 Market Structures
Market structures exhibit a fractal and nested nature, which leads us to classify them into internal (minor) and external (major) categories. Definitions of market structure vary, with different methodologies such as Smart Money and ICT offering distinct interpretations.
To identify market structure, the initial step involves examining key highs and lows. An uptrend is characterized by successive highs and lows that are higher than their predecessors. Conversely, a downtrend is marked by successive lows and highs that are lower than their previous counterparts.
🟣 Market Trends and Movements
Market trends consist of two primary types of movements :
Impulsive Movements : These movements align with the main trend and are characterized by high strength and momentum.
Corrective Movements : These movements counter the main trend and are marked by lower strength and momentum.
🟣 Break of Structure (BOS)
In a downtrend, a Break of Structure (BOS) occurs when the price falls below the previous low and establishes a new low (LL). In an uptrend, a BOS, also known as a Market Structure Break (MSB), happens when the price rises above the last high.
To confirm a trend, at least one BOS is necessary, which requires the price to close at least one candle beyond the previous high or low.
🟣 Change of Character (CHOCH)
Change of Character (CHOCH) is a crucial concept in market structure analysis, indicating a shift in trend. A trend concludes with a CHOCH, also referred to as a Market Structure Shift (MSS).
For example, in a downtrend, the price continues to drop with BOS, showcasing the trend's strength. However, when the price rises and exceeds the last high, a CHOCH occurs, signaling a potential transition from a downtrend to an uptrend.
It is essential to note that a CHOCH does not immediately indicate a buy trade. Instead, it is prudent to wait for a BOS in the upward direction to confirm the uptrend. Unlike BOS, a CHOCH confirmation does not require a candle to close; merely breaking the previous high or low with the candle's wick is sufficient.
🟣 Spike | Inefficiency | Imbalance
All these terms mean fast price movement in the shortest possible time.
🟣 Fair Value Gap (FVG)
To pinpoint the "Fair Value Gap" (FVG) on a chart, a detailed candle-by-candle analysis is necessary. This process involves focusing on candles with substantial bodies and evaluating them in relation to the candles immediately before and after them.
Here are the steps :
Identify the Central Candle : Look for a candle with a large body.
Examine Adjacent Candles : The candles before and after this central candle should have long shadows, and their bodies must not overlap with the body of the central candle.
Determine the FVG Range : The distance between the shadows of the first and third candles defines the FVG range.
This method helps in accurately identifying the Fair Value Gap, which is crucial for understanding market inefficiencies and potential price movements.
🟣 Setup
This setup is based on Market Structure and FVG. After a change of character and the formation of FVG in the last lag of the price movement, we are looking for trading positions in the price pullback.
Bullish Setup :
Bearish Setup :
🔵 How to Use
After forming the setup, you can enter the trade using a pending order or after receiving confirmation. To increase the probability of success, you can adjust the pivot period market structure settings or modify the market movement coefficient in the formation leg of the FVG.
Bullish Setup :
Bearish Setup :
🔵 Setting
Pivot Period of Market Structure Detector :
This parameter allows you to configure the zigzag period based on pivots. Adjusting this helps in accurately detecting order blocks.
Show major Bullish ChoCh Lines :
You can toggle the visibility of the Demand Main Zone and "ChoCh" Origin, and customize their color as needed.
Show major Bearish ChoCh Lines :
Similar to the Demand Main Zone, you can control the visibility and color of the Supply Main Zone and "ChoCh" Origin.
FVG Detector Multiplier Factor :
This feature lets you adjust the size of the moves forming the Fair Value Gaps (FVGs) using the Average True Range (ATR). The default value is 1, suitable for identifying most setups. Adjust this value based on the specific symbol and market for optimal results.
FVG Validity Period :
This parameter defines the validity period of an FVG in terms of the number of candles. By default, an FVG remains valid for up to 15 candles, but you can adjust this period as needed.
Mitigation Level FVG :
This setting establishes the basic level of an FVG. When the price reaches this level, the FVG is considered mitigated.
Level in Low-Risk Zone :
This feature aims to reduce risk by dividing the FVG into two equal areas: "Premium" (upper area) and "Discount" (lower area). For lower risk, ensure that "Demand FVG" is in the "Discount" area and "Supply FVG" in the "Premium" area. This feature is off by default.
Show or Hide :
Given the potential abundance of setups, displaying all on the chart can be overwhelming. By default, only the last setup is shown, but you can enable the option to view all setups.
Alert Settings :
On / Off : Toggle alerts on or off.
Message Frequency : Determine how often alerts are triggered.
Options include :
"All" (alerts every time the function is called)
"Once Per Bar" (alerts only on the first call within the bar)
"Once Per Bar Close" (alerts only at the last script execution of the real-time bar upon closing)
The default setting is "Once Per Bar".
Show Alert Time by Time Zone : Set the alert time based on your preferred time zone, such as "UTC-4" for New York time. The default is "UTC".
Display More Info : Optionally show additional details like the price range of the order blocks and the date, hour, and minute in the alert message. Set this to "Off" if you prefer not to receive this information.

FVG Positioning Average [LuxAlgo]The FVG Positioning Average indicator aims to uncover potential price levels of interest by averaging together recent Fair Value Gap (FVG) initiation levels.
This indicator is grounded in the theory that significant buying or selling activity is the primary catalyst for creating FVGs.
By averaging together the prices where each FVG initiated, we may potentially reveal where major participants are positioned.
🔶 USAGE
By analyzing the average price of bullish or bearish FVGs, users can identify potential support or resistance areas where the larger participants may re-enter or defend their positions.
These areas could be used to adjust entries and exits or assist with risk management such as take-profit or stop-loss levels.
The indicator displays 2 lines, the Bull Average and the Bear Average.
The Bull Average is only displayed when the price holds above the bull Average.
The Bear Average is only displayed when the price holds below the bear average.
When only one average is displayed alone, this level is seen as support or resistance, it is anticipated that this level would be defended for the current trend to stay valid.
When both averages are displayed simultaneously, it can be interpreted as one side attempting to take over the trend.
The movements and reactions during these attempts can be analyzed to provide helpful information about where the price might be headed.
Possible outcomes:
Trend Confirmation/Re-Entry (From Weak Attempts)
Trend Reversal (Creating Support or Resistance)
Consolidation (Oscillating between/around Bull & Bear Averages)
🔶 DETAILS
🔹 Lookback Types
This indicator includes 2 lookback types:
Bar Count: Uses Bars to determine what data to include. This type can be utilized for averages that are more locally relevant to the current chart data.
FVG Count: Uses a specific # of FVGs for calculations. This type can be utilized for a continuous & consistent view, typically relevant with longer term analysis.
Note: When using bar lookback, if no data is in range, no lines will be displayed.
Below is an example of the 'FVG Count' Display.
🔹 Initiation Levels
Initiation Levels are the specific price points where each FVG starts, these are the last points the price was traded at before creating the gap.
Bull Initiation Level: Lowest Point (Bottom) of FVG
Bear Initiation Level: Highest Point (Top) of FVG
🔹 FVG Display
Each FVG being used for the current calculation of averages is displayed on the chart for reference.
Note: If you prefer to not display the FVGs, they can be toggled off in the settings, uncheck "Show FVGs on Chart".
🔶 Settings
FVG Lookback: As mentioned above in the 'Lookback Types', this sets the number of FVGs or Bars to use for consideration.
Lookback Type: As also mentioned above in 'Lookback Types', this determines the method of lookback to be used.
ATR Multiplier: The FVGs are required to have a Greater Width than (ATR * Multiplier) in order to be used for calculations. This allows you to focus on the data being considered if needed.

ICT Silver Bullet | Flux Charts💎 GENERAL OVERVIEW
Introducing our new ICT Silver Bullet Indicator! This indicator is built around the ICT's "Silver Bullet" strategy. The strategy has 5 steps for execution and works best in 1-5 min timeframes. For more information about the process, check the "HOW DOES IT WORK" section.
Features of the new ICT Silver Bullet Indicator :
Implementation of ICT's Silver Bullet Strategy
Customizable Execution Settings
2 NY Sessions & London Session
Customizable Backtesting Dashboard
Alerts for Buy, Sell, TP & SL Signals
📌 HOW DOES IT WORK ?
ICT's Silver Bullet strategy has 5 steps :
1. Mark your market sessions open (This indicator has 3 -> NY 10-11, NY 14-15, LDN 03-04)
2. Mark the swing liquidity points
3. Wait for market to take down one liquidity side
4. Look for a market structure-shift for reversals
5. Wait for a FVG for execution
This indicator follows these steps and inform you step by step by plotting them in your chart. You can switch execution types between FVG and MSS.
🚩UNIQUENESS
This indicator is an all-in-one suit for the ICT's Silver Bullet concept. It's capable of plotting the strategy, giving signals, a backtesting dashboard and alerts feature. It's designed for simplyfing a rather complex strategy, helping you to execute it with clean signals. The backtesting dashboard allows you to see how your settings perform in the current ticker. You can also set up alerts to get informed when the strategy is executable for different tickers.
⚙️SETTINGS
1. General Configuration
Execution Type -> FVG execution type will require a FVG to take an entry, while the MSS setting will take an entry as soon as it detects a market structure-shift.
MSS Swing Length -> The swing length when finding liquidity zones for market structure-shift detection.
Breakout Method -> If "Wick" is selected, a bar wick will be enough to confirm a market structure-shift. If "Close" is selected, the bar must close above / below the liquidity zone to confirm a market structure-shift.
FVG Detection -> "Same Type" means that all 3 bars that formed the FVG should be the same type. (Bullish / Bearish). "All" means that bar types may vary between bullish / bearish.
FVG Detection Sensitivity -> You can turn this setting on and off. If it's off, any 3 consecutive bullish / bearish bars will be calculated as FVGs. If it's on, the size of FVGs will be filtered by the selected sensitivity. Lower settings mean less but larger FVGs.
2. TP / SL
TP / SL Method -> If "Fixed" is selected, you can adjust the TP / SL ratios from the settings below. If "Dynamic" is selected, the TP / SL zones will be auto-determined by the algorithm.
Risk -> The risk you're willing to take if "Dynamic" TP / SL Method is selected. Higher risk usually means a better winrate at the cost of losing more if the strategy fails.
Close Position @ Session End -> If this setting is enabled, the current position (if any) will be closed at the beginning of a new session, regardless if it hit the TP / SL zone. If it's off, the position will be open until it hits a TP / SL zone.
