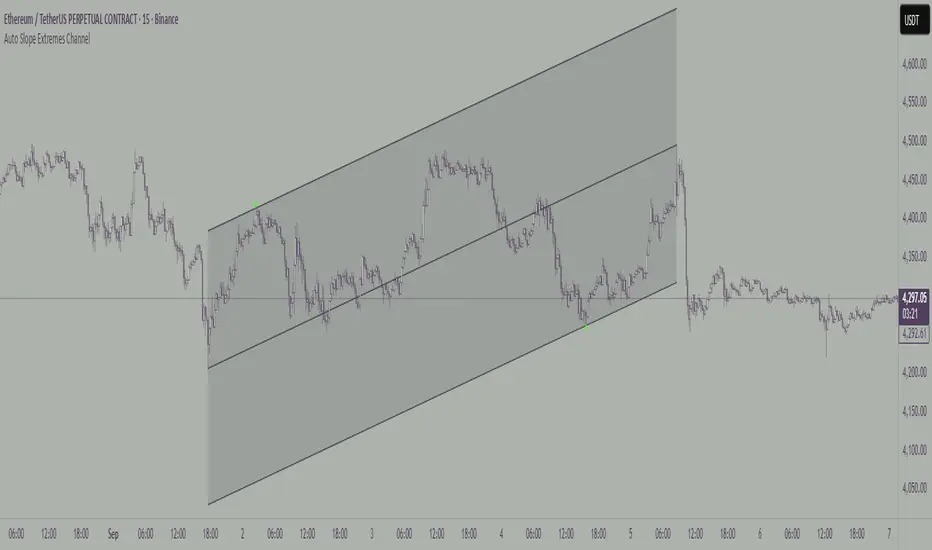
Auto Slope Extremes ChannelAuto Slope Extremes Channel
Expanding channel that locks onto the highest high and lowest low of the slope between A and B.
This indicator builds a dynamic channel between two anchors, A and B.
Unlike fixed-width channels, it adapts to the slope of the leg between A and B and expands until:
• The upper channel line touches the highest candle in that slope.
• The lower channel line touches the lowest candle in that slope.
This method ensures that the channel edges are defined only by the single most extreme high and the single most extreme low within the selected leg. No other candles in the range touch the edges.
A centerline is drawn midway between the two extremes, and small triangle markers highlight the exact candles that determine the upper and lower boundaries.
Features
• Anchored channel defined by two user-selected points (A and B).
• Expands to fit the highest high and lowest low of the slope between A and B.
• Optional centerline and channel fill.
• Extend lines left, right, or both.
• Customizable line widths and colours.
Extreme
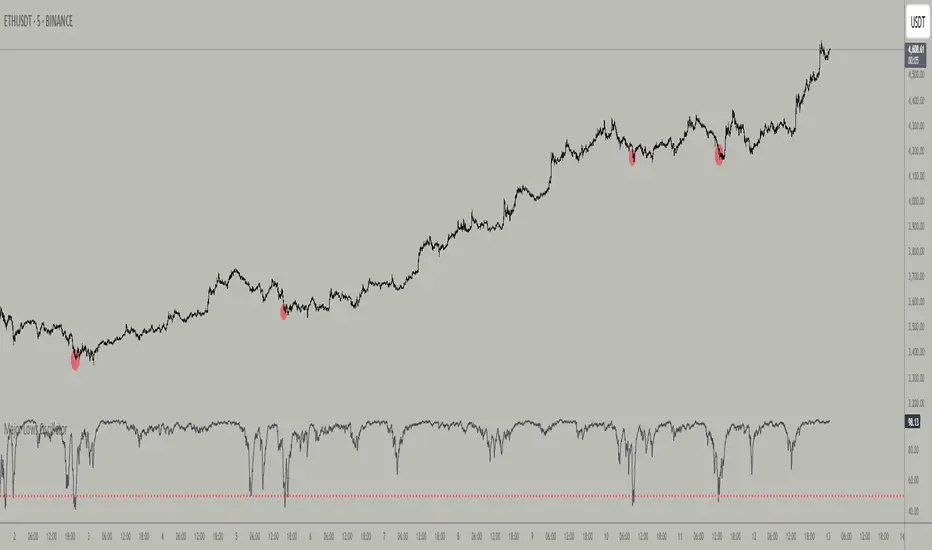
Major Lows OscillatorDescription
The Major Lows Oscillator is a custom technical indicator designed to identify significant low-price areas by normalizing the current closing price relative to recent lowest lows and highest highs. The oscillator calculates a normalized price percentage over a configurable lookback period, applies exponential moving averages for smoothing, and inverts the result to highlight potential market bottoms.
Calculation Details
Lowest Low Lookback : Finds the lowest low over a user-defined period (default 100 bars).
Highest High Lookback : Calculates the highest high over a short period (default 1 bar), providing a dynamic normalization range.
Normalization : Normalizes the current close within the range defined by the lowest low and highest high, scaled to 0-100.
Smoothing : Applies a 10-period EMA, inversion, and weighted smoothing combining the last valid value and current oscillator reading.
Final Output : Applies a final EMA (period 1) and inverts the oscillator (100 - value) to emphasize major lows.
Features
Customizable midline level for signal alerts (default 50).
Visual midline reference line.
Alerts trigger on oscillator crossing below midline for automated monitoring.
Usage
Useful for complementing existing setups or integration in algorithmic trading strategies.
Changing the input parameters opens new ways to leverage the asymmetric range concept, allowing adaptation to different market regimes and enhancing the oscillator’s sensitivity and utility.
Examples of input combinations and their potential purposes include:
Extremely Asymmetric Setting: Lowest Low Lookback = 200, Highest High Lookback = 1
Focuses on deep long-term lows contrasted with immediate highs, ideal for spotting strong oversold levels within an otherwise bullish short-term momentum.
Symmetric Lookbacks: Lowest Low Lookback = Highest High Lookback = 50
Balances the range equally, creating a normalized oscillator that treats recent lows and highs with the same weight — useful for markets with balanced volatility.
Short but Equal Lookbacks: Lowest Low Lookback = Highest High Lookback = 10
Highly sensitive to recent price swings, this setting can detect rapid shifts and is suited for intraday or very short-term trading.
Inverted Extreme: Lowest Low Lookback = 1, Highest High Lookback = 100
Highlights very recent lows against a long-term high range, possibly signaling quick dips in a generally overextended market.
Inputs
Midline Level : Threshold for alerts (default 50).
Lowest Low Lookback Period : Bars evaluated for lowest low (default 100).
Highest High Lookback Period : Bars evaluated for highest high (default 1).
Alerts
Configured to trigger once per bar close when the oscillator crosses below the midline level.
---
Disclaimer
This indicator is for educational and analytical use only.
K`s Extreme DurationExtreme duration uses a special combination of the RSI and its relative position to deliver a reversal signal.
The following are the conditions to generate signals:
* Bullish signal: The current 8-period RSI is below 50 and above 35 while the previous 5 RSI's are below 35.
* Bearish signal: The current 8-period RSI is above 50 and below 65 while the previous 5 RSI's are above 65.

Edri Extreme Points Buy & SellEDRI EXTREME POINTS BUY & SELL INDICATOR
This Buy and Sell (non-repainting) indicator uses signals based on the combined CCI/Momentum and RSI indicators and optional regular divergence.
The idea of the indicator is to look for a potential reversal after the price reached extreme points (overbought or oversold) and signals an entry when the price shows signs of momentum for reversal.
Optionally, it considers finding a divergence while RSI is at the extreme levels to improve the predictability of a possible reversal.
Additionally, the indicator includes a simple Mean Reversion visual on the chart to assist users in identifying extreme price levels and potential reversal opportunities. It features upper and lower bands that can be optionally plotted, showing calculated values where price bounces at those extreme levels.
The purpose of these bands is to help traders avoid getting trapped in the middle of a trend and to guide them to buy low and sell high. (It's important to note that this is purely a visual aid and does not impact the generation of trade signals.)
By utilizing the Mean Reversion bands alongside the entry conditions, traders can gain insights into potential price reversals and make more informed decisions about when to enter or exit trades.
Buy and Sell Entry conditions:
• The indicator looks at the CCI/Momentum indicator to turn positive (if buy) or negative (if sell) after the RSI was overbought or oversold in the recent past.
• It also checks if there is a 3-period regular bullish divergence in the RSI (if buy), or regular bearish divergence (if sell) and consider these in the entry condition.
• If these conditions are met, this indicator suggests that it may be a good time to enter a trade.
In summary this is how this indicator works:
• The indicator takes input settings such as the choice between using CCI or Momentum as the entry signal source, length parameters for CCI/Momentum, RSI levels for overbought and oversold conditions, RSI length, and options to plot mean reversion bands on the chart.
• It calculates the CCI and Momentum and RSI values based on user-defined length..
• It checks for regular bullish and bearish divergences (3 periods) in the RSI if the option is enabled.
• The script plots shapes on the chart to indicate the buy and sell signals based on the entry conditions.
• If the mean reversion bands option is enabled, it calculates the mean reversion, standard deviation, upper band, and lower band values.
• It also plots the upper band, mean reversion line, and lower band on the chart if the mean reversion bands option is enabled.
• This indicator includes alert conditions to generate alerts for the buy and sell signals.
• On top of that, users can opt to use only one alert for both buy and sell signals. (This can save Trading view subscribers with limited alerts.)
Important! Please do not consider everything you read here as financial advice. Additionally, do not rely solely on indicators for making your trading decisions. It is important to note that no indicator or strategy is perfect. Therefore, it is always recommended to backtest everything and practice proper risk management.
I appreciate your feedback on this indicator. As I am new to script development, I am open to comments and suggestions to improve it. If you encounter any issues while using this indicator, please let me know in the comments section. If you find it helpful, I kindly ask for your support in boosting it. Thank you for your cooperation.

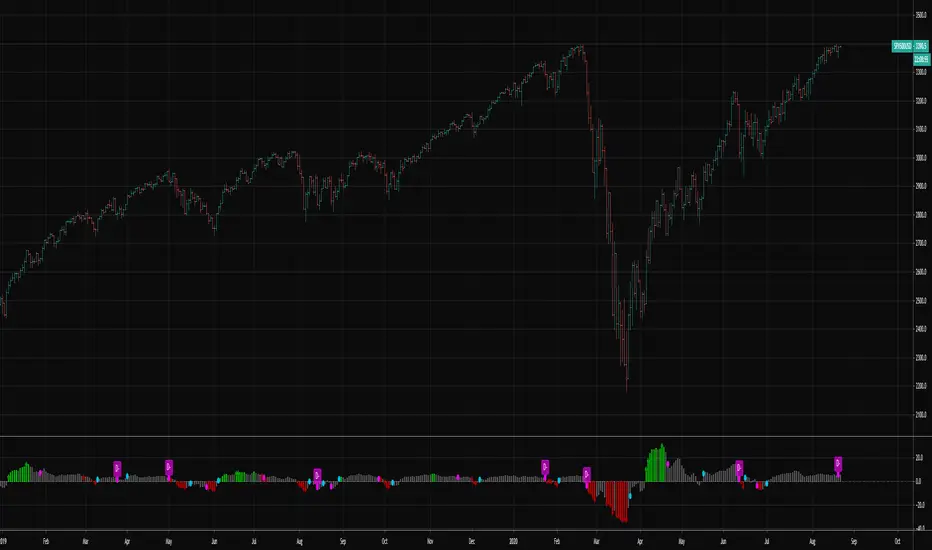
MTF Stationary Extreme IndicatorThe Multiple Timeframe Stationary Extreme Indicator is designed to help traders identify extreme price movements across different timeframes. By analyzing extremes in price action, this indicator aims to provide valuable insights into potential overbought and oversold conditions, offering opportunities for trading decisions.
The indicator operates by calculating the difference between the latest high/low and the high/low a specified number of periods back. This difference is expressed as a percentage, allowing for easy comparison and interpretation. Positive values indicate an increase in the extreme, while negative values suggest a decrease.
One of the unique features of this indicator is its ability to incorporate multiple timeframes. Traders can choose a higher timeframe to analyze alongside the current timeframe, providing a broader perspective on market dynamics. This feature enables a comprehensive assessment of extreme price movements, considering both short-term and longer-term trends.
By observing extreme movements on different timeframes, traders can gain deeper insights into market conditions. This can help in identifying potential areas of confluence or divergence, supporting more informed trading decisions. For example, when extreme movements align across multiple timeframes, it may indicate a higher probability of a significant price reversal or continuation.
To use the Multiple Timeframe Stationary Extreme Indicator effectively, traders should consider a few key points:
- Choose the Timeframes : Select the appropriate timeframes based on your trading strategy and objectives. The current timeframe represents the focus of your analysis, while the higher timeframe provides a broader context. Ensure the chosen timeframes align with your trading style and the asset you are trading.
- Interpret Extreme Movements : Pay attention to extreme movements that breach certain levels. Values above zero indicate a rise in the extreme, potentially signaling overbought conditions. Conversely, values below zero suggest a decrease, potentially indicating oversold conditions. Use these extreme movements as potential entry or exit signals, in conjunction with other indicators or confirmation signals.
- Validate with Price Action : Confirm the extreme movements observed on the indicator with price action. Look for confluence between the indicator's extreme levels and key support or resistance levels, trendlines, or chart patterns. This can provide added confirmation and increase the reliability of the signals generated by the indicator.
- Consider Volatility Filters : The indicator can be enhanced by incorporating volatility filters. By adjusting the sensitivity of the extreme differences calculation based on market volatility, traders can adapt the indicator to different market conditions. Higher volatility may require a longer lookback period, while lower volatility may call for a shorter one. Experiment with volatility filters to fine-tune the indicator's performance.
- Combine with Other Analysis Techniques : The Multiple Timeframe Stationary Extreme Indicator is most effective when used as part of a comprehensive trading strategy. Combine it with other technical analysis tools, such as trend indicators, oscillators, or chart patterns, to form a well-rounded approach. Consider risk management techniques and money management principles to optimize your trading strategy.
---------------------------------------------------------------------------------------------------------------------------------------------------------------
Remember that trading indicators, including the Multiple Timeframe Stationary Extreme Indicator, should not be used in isolation. They serve as tools to assist in decision-making, but they require proper context, analysis, and confirmation. Always conduct thorough analysis and consider market conditions, news events, and other relevant factors before making trading decisions.
It's recommended to backtest the indicator on historical data to assess its performance and effectiveness for your trading approach. This will help you understand its strengths and limitations, allowing you to refine and optimize your usage of the indicator.

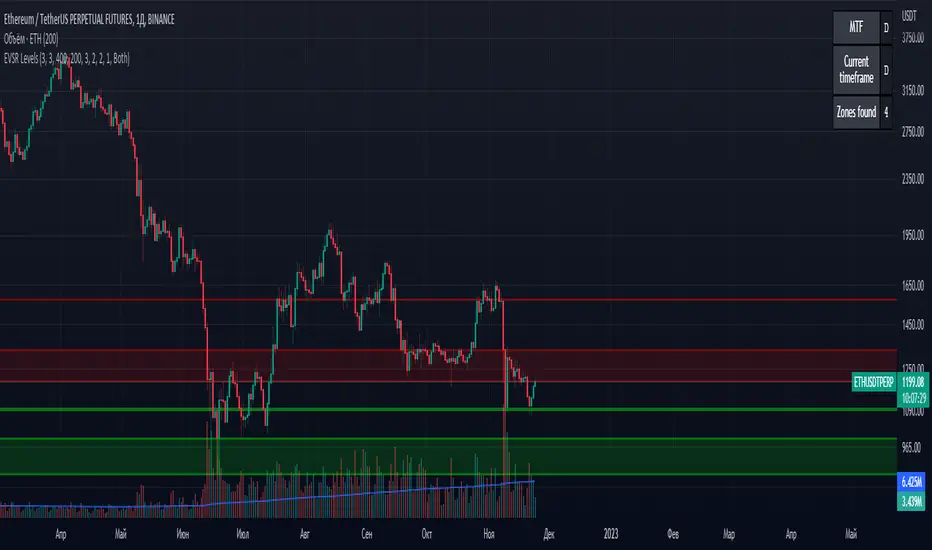
Extreme Volume Support Resistance LevelsExtreme Volume Support Resistance Levels are S/R levels(zones, basically), based on extreme volume .
Settings:
Lookback -- number of bars, which algorithm will be using;
Volume Threshold Period -- period of MA (Volume MA), which smoothers volume in order to find the extremes;
Volume Threshold Multiplier -- multiplier for Volume MA, which "lift" Volume MA and thus will provide the algorithm with more accurate extreme volume ;
Number of zones to show -- number of last S/R zones, which will be shown on the chart.
RU:
Extreme Volume Support Resistance Levels — это уровни S/R (зоны, в основном), основанные на избыточном объеме.
Параметры:
Lookback -- число баров, которое алгоритм будет использовать для расчётов;
Volume Threshold Period -- период MA (Volume MA), которая сглаживает объем для нахождения экстремумов объёма;
Volume Threshold Multiplier -- множитель для Volume MA, который "поднимает" Volume MA и тем самым обеспечивает алгоритм более точными значениями экстремального объёма;
Количество зон для отображения -- количество оставшихся зон S/R, которые отображаются на графике.
Volume In USDDisplay volume in fiat base currency so that we can compare symbols in a list to find healthy one to trade.
Add a label so that we can see the latest volume number easier on mobile phone.

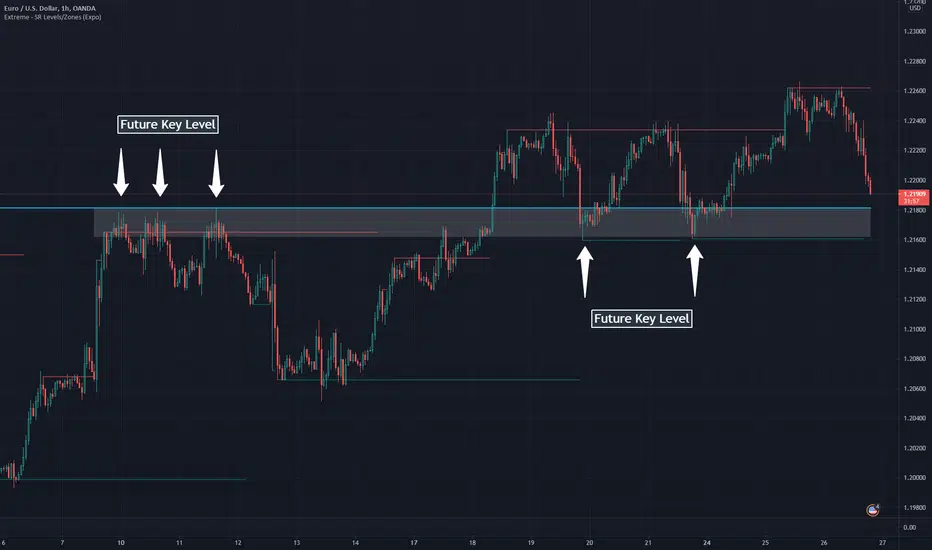
Extreme - SR Levels/Zones (Expo)Extreme - SR Levels/Zones (Expo) automatically searches and prints key support and resistance levels based on "extreme" high & low values.
When the extreme condition is met there is a high probability that the market pauses, makes a pullback, or that the trend change direction. If the current trend is strong, the price will breakout from the previous extreme level.
The indicator can be used standalone or as a part of your current trading strategy.
Real-time
No repainting
Works on any market
HOW TO USE
1. Use the indicator to identify key support and resistance levels.
2. Use the indicator to identify potential breakouts.
3. Use the indicator to identify potential reversal points.
INDICATOR IN ACTION
Daily chart
I hope you find this indicator useful , and please comment or contact me if you like the script or have any questions/suggestions for future improvements. Thanks!
I will continually work on this indicator, so please share your experience and feedback as it will enable me to make even better improvements. Thanks to everyone that has already contacted me regarding my scripts. Your feedback is valuable for future developments!
ACCESS THE INDICATOR
• Contact me on TradingView or use the links below
-----------------
Disclaimer
Copyright by Zeiierman.
The information contained in my scripts/indicators/ideas does not constitute financial advice or a solicitation to buy or sell any securities of any type. I will not accept liability for any loss or damage, including without limitation any loss of profit, which may arise directly or indirectly from the use of or reliance on such information.
All investments involve risk, and the past performance of a security, industry, sector, market, financial product, trading strategy, or individual’s trading does not guarantee future results or returns. Investors are fully responsible for any investment decisions they make. Such decisions should be based solely on an evaluation of their financial circumstances, investment objectives, risk tolerance, and liquidity needs.
My scripts/indicators/ideas are only for educational purposes!
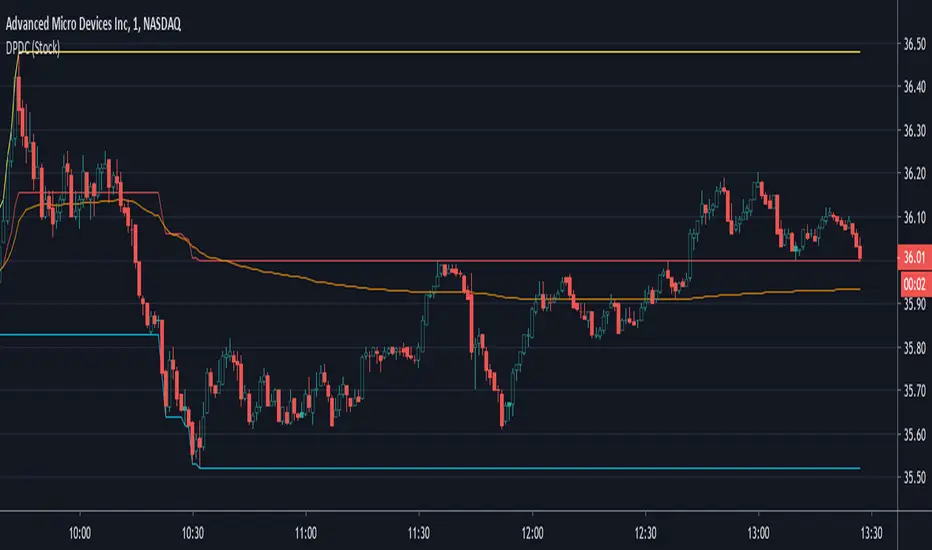
Daily Progressive Donchian ChannelsThis is the first script that I publish.
His main goal is to help identify the extreme of the day and to compare the VWAP with the average DPDC to find meaningful resistance and support.
Extreme ScalpingThis is a test of an easy scalping method: buy if actual close is below forecast close and sell if actual close is above forecast close. Take profit and stop loss shall be very small (few pips) as in most of scalping strategies.
No filter is used for only long or only short positions, but you can select buy only or sell only based on other indicators or whatever you feel is the direction of trading.
NOTE: you can add this strategy to your chart but you should modify the backtest day otherwise you will get an error due to calculation limits of pine script. For example, on one minute chart, you should set the backtest day from today only. For past days, set both start day and and day.
I have also a study with alarms.
Please use comment section for any feedback.


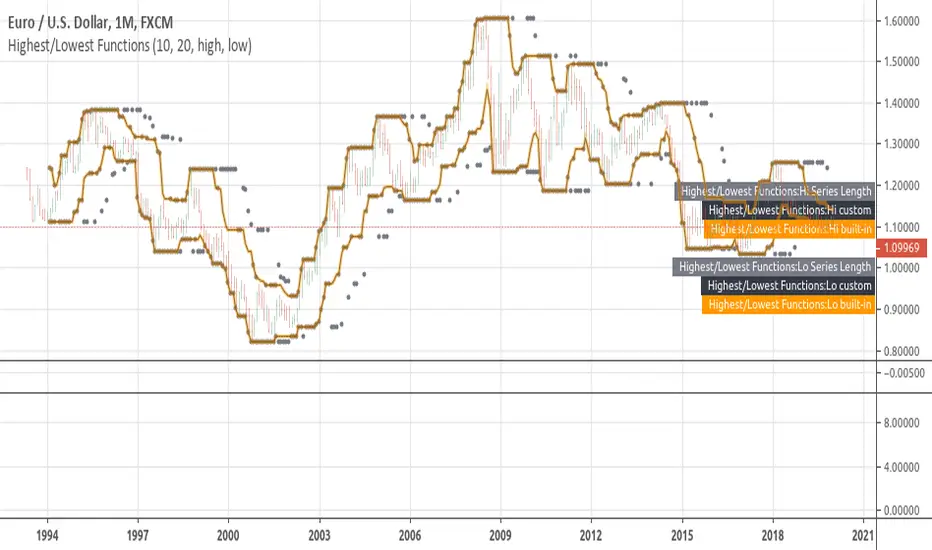
Extreme IndicatorIdentifies price extreme points based on a highest/lowest price lookback. There are many other goodies hidden in this indicator including a built in ATR trailing stop that will flip up and down.
The inspiration of this indicator is based on this idea .
PivotBoss TriggersI have collected the four PivotBoss indicators into one big indicator. Eventually I will delete the individual ones, since you can just turn off the ones you don't need in the style controller. Cheers.
Wick Reversal
When the market has been trending lower then suddenly forms a reversal wick candlestick , the likelihood of
a reversal increases since buyers have finally begun to overwhelm the sellers. Selling pressure rules the decline,
but responsive buyers entered the market due to perceived undervaluation. For the reversal wick to open near the
high of the candle, sell off sharply intra-bar, and then rally back toward the open of the candle is bullish , as it
signifies that the bears no longer have control since they were not able to extend the decline of the candle, or the
trend. Instead, the bulls were able to rally price from the lows of the candle and close the bar near the top of its
range, which is bullish - at least for one bar, which hadn't been the case during the bearish trend.
Essentially, when a reversal wick forms at the extreme of a trend, the market is telling you that the trend
either has stalled or is on the verge of a reversal. Remember, the market auctions higher in search of sellers, and
lower in search of buyers. When the market over-extends itself in search of market participants, it will find itself
out of value, which means responsive market participants will look to enter the market to push price back toward
an area of perceived value. This will help price find a value area for two-sided trade to take place. When the
market finds itself too far out of value, responsive market participants will sometimes enter the market with
force, which aggressively pushes price in the opposite direction, essentially forming reversal wick candlesticks .
This pattern is perhaps the most telling and common reversal setup, but requires steadfast confirmation in order
to capitalize on its power. Understanding the psychology behind these formations and learning to identify them
quickly will allow you to enter positions well ahead of the crowd, especially if you've spotted these patterns at
potentially overvalued or undervalued areas.
Fade (Extreme) Reversal
The extreme reversal setup is a clever pattern that capitalizes on the ongoing psychological patterns of
investors, traders, and institutions. Basically, the setup looks for an extreme pattern of selling pressure and then
looks to fade this behavior to capture a bullish move higher (reverse for shorts). In essence, this setup is visually
pointing out oversold and overbought scenarios that forces responsive buyers and sellers to come out of the dark
and put their money to work-price has been over-extended and must be pushed back toward a fair area of value
so two-sided trade can take place.
This setup works because many normal investors, or casual traders, head for the exits once their trade
begins to move sharply against them. When this happens, price becomes extremely overbought or oversold,
creating value for responsive buyers and sellers. Therefore, savvy professionals will see that price is above or
below value and will seize the opportunity. When the scared money is selling, the smart money begins to buy, and
Vice versa.
Look at it this way, when the market sells off sharply in one giant candlestick , traders that were short
during the drop begin to cover their profitable positions by buying. Likewise, the traders that were on the
sidelines during the sell-off now see value in lower prices and begin to buy, thus doubling up on the buying
pressure. This helps to spark a sharp v-bottom reversal that pushes price in the opposite direction back toward
fair value.
Engulfing (Outside) Reversal
The power behind this pattern lies in the psychology behind the traders involved in this setup. If you have
ever participated in a breakout at support or resistance only to have the market reverse sharply against you, then
you are familiar with the market dynamics of this setup. What exactly is going on at these levels? To understand
this concept is to understand the outside reversal pattern. Basically, market participants are testing the waters
above resistance or below support to make sure there is no new business to be done at these levels. When no
initiative buyers or sellers participate in range extension, responsive participants have all the information they
need to reverse price back toward a new area of perceived value.
As you look at a bullish outside reversal pattern, you will notice that the current bar's low is lower than the
prior bar's low. Essentially, the market is testing the waters below recently established lows to see if a downside
follow-through will occur. When no additional selling pressure enters the market, the result is a flood of buying
pressure that causes a springboard effect, thereby shooting price above the prior bar's highs and creating the
beginning of a bullish advance.
If you recall the child on the trampoline for a moment, you'll realize that the child had to force the bounce
mat down before he could spring into the air. Also, remember Jennifer the cake baker? She initially pushed price
to $20 per cake, which sent a flood of orders into her shop. The flood of buying pressure eventually sent the price
of her cakes to $35 apiece. Basically, price had to test the $20 level before it could rise to $35.
Let's analyze the outside reversal setup in a different light for a moment. One of the reasons I like this setup
is because the two-bar pattern reduces into the wick reversal setup, which we covered earlier in the chapter. If
you are not familiar with candlestick reduction, the idea is simple. You are taking the price data over two or more
candlesticks and combining them to create a single candlestick . Therefore, you will be taking the open, high, low,
and close prices of the bars in question to create a single composite candlestick .
Doji Reversal
The doji candlestick is the epitome of indecision. The pattern illustrates a virtual stalemate between buyers
and sellers, which means the existing trend may be on the verge of a reversal. If buyers have been controlling a
bullish advance over a period of time, you will typically see full-bodied candlesticks that personify the bullish
nature of the move. However, if a doji candlestick suddenly appears, the indication is that buyers are suddenly
not as confident in upside price potential as they once were. This is clearly a point of indecision, as buyers are no
longer pushing price to higher valuation, and have allowed sellers to battle them to a draw-at least for this one
candlestick . This leads to profit taking, as buyers begin to sell their profitable long positions, which is heightened
by responsive sellers entering the market due to perceived overvaluation. This "double whammy" of selling
pressure essentially pushes price lower, as responsive sellers take control of the market and push price back
toward fair value.

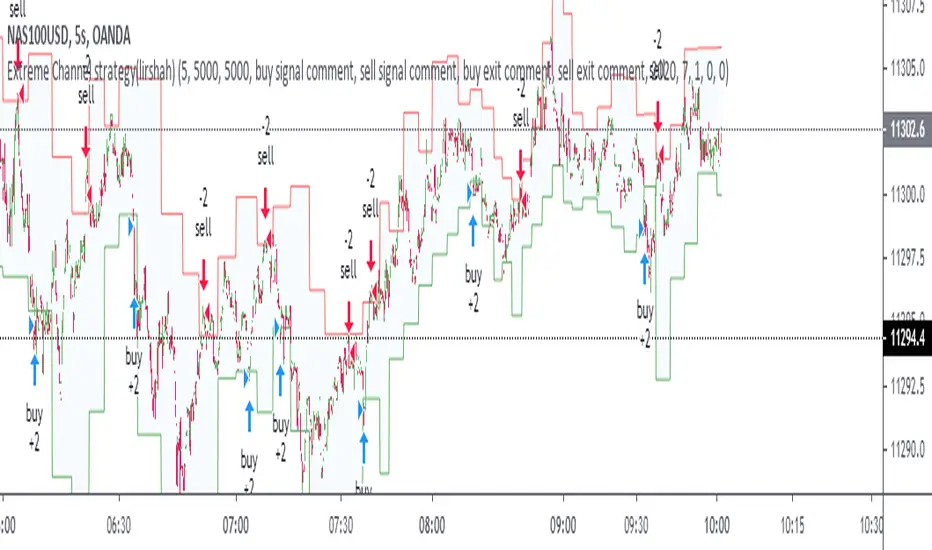
Extreme Channel(lirshah)Extreme channel strategy gives buy and sell signals according to given period volatility range(default is Daily).
buying above upper channel while selling below lower channel.
good results on different markets.
xbtusd xlmusd xrpusd bchusd ltcusd …
Extreme Channel strategy(lir)A strategy according to extreme channel by lirshah
the result of back test on btcusd H1 time frame

Extreme Channel(lir)extreme channel is a powerful indicator which plot the extremes according to previous period input,
the default value is D which means the channel is plotted according to previous day and is constant until next day,
the input can be changed to minutes,W,M and ...

Reversal Candle Pattern SetUp
An outside reversal candle set up script with buy/sell signals. Looks simple but it's pretty powerful especially if combined with your choice confirming indicator.
The pattern psychology is this one (Frank Ochoa explanation): " The power behind this pattern lies in the psychology behind the traders involved in this setup. If you have ever participated in a breakout at support or resistance only to have the market reverse sharply against you, then you are familiar with the market dynamics of this setup.
[Basically, market participants are testing the waters above resistance or below support to make sure there is no new business to be done at these levels. When no initiative buyers or sellers participate in range extension, responsive participants have all the information they need to reverse price back toward a new area of perceived value.
As you look at a bullish outside reversal pattern, you will notice that the current bar's low is lower than the
prior bar's low. Essentially, the market is testing the waters below recently established lows to see if a downside
follow-through will occur. When no additional selling pressure enters the market, the result is a flood of buying
pressure that causes a springboard effect, thereby shooting price above the prior bar's highs and creating the
beginning of a bullish advance."

RSI Stochastic Extreme Combo alertThis script will give you red or green columns as an indication for oversold/overbought based upon the rsi and stochastic both being at extreme levels (you set). The default oversold is at 35. If Stochastic and RSI fall below 35, you will get a green column (Both indicators at the extreme). Play with your levels to see how your stock reacts. RSI and Stochastic can both be changed along with each of the levels you would like the color change. I have set mine at RSI low: 37, RSI high: 63, Stoch low: 10, and Stoch high: 90. These levels have been working well for me on AAPL. Enjoy and don't forget to leave a comment if it helps your trading or you have other ideas about what is working for you.

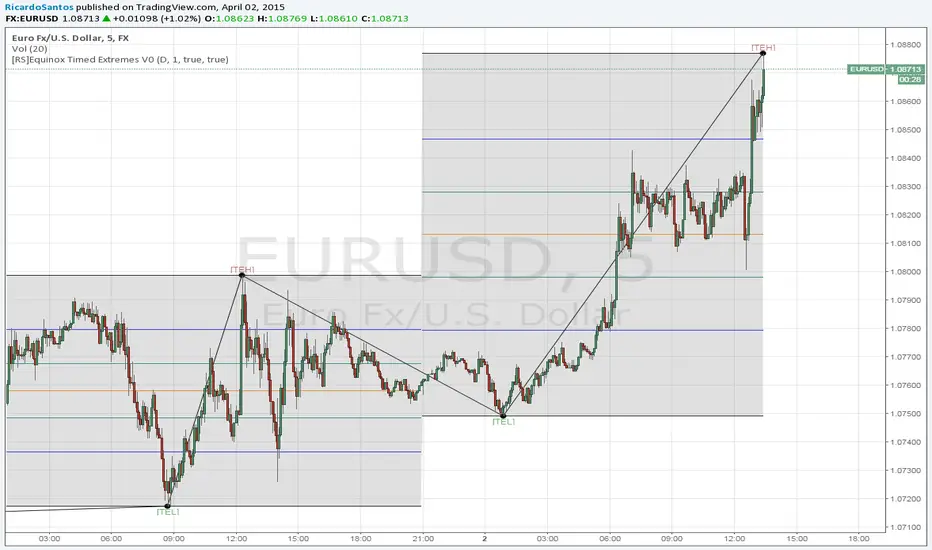
[RS]Temporal Extreme Spliter V0EXPERIMENTAL: this script can be used as a trend follower if bgcolor is active, it can be used to catch extremes and target levels for a pull back to the mean, can be used as support and resistance with the time period open price and extreme. other uses, improvements let me know :p.
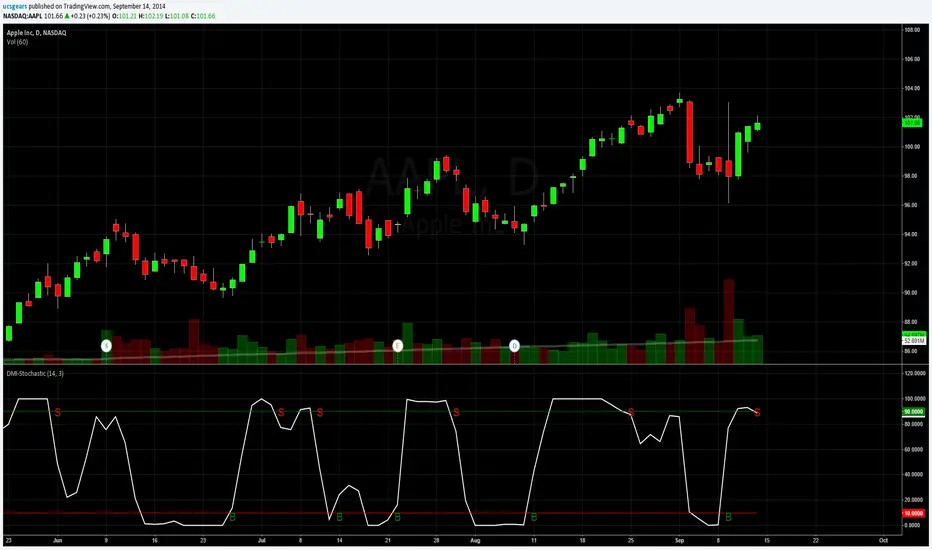
DMI Stochastic Extreme - DMI Stochastic Extreme - Version 2
- Replaced B with , Replaced S with
- Ability to change Overbought and Oversold Levels
- Clean PineScript
List of All my Indicators - www.tradingview.com

DMI Stochastic ExteremeUSed the DMI Oscillator created by LARK "https://www.tradingview.com/v/T79b6F5n/" to create this DMI Stochastic Extreme. You can also use the DMI Stochastic by Lark
Updated Version -