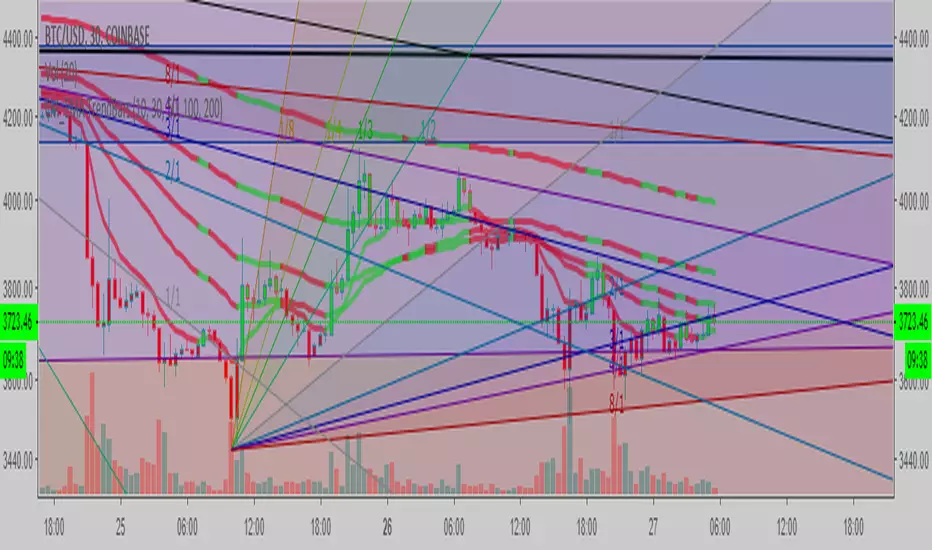
Rainbow Trend IndicatorThis is an indicator based on the MA rainbow concept. It is possible to choose between 15 or 20 MA's and if all 15 MA's is picked, the calculation will be calculated on 15 MA's and if 20 is picked the calculation is calculated on 20 MA's. The indicator will then be a line which is assigned a value from the calculation based on the MA's. If the line is above the dashed zero line, meaning the line's last value is a positive value, the price is in a uptrend and if the line is below the dashed zero line, meaning the line's last value is a negative value, the price is in a downtrend.
In short
If the line is green, the price is in a uptrend. If the line is red, the price is in a downtrend.
Exponential

Exponential Deviation Bands Width [ChuckBanger]This indicator is a compliment to Exponential Deviation Bands . It is the difference between the upper and the lower bands divided by the middle band. It is an easy way to visualize consolidation before price movements or periods of higher volatility.
How it works
During a period of high volatility, the distance between the two bands will widen and Exponential Deviation Bands width will increase. And the opposite occurs during a period of low volatility, the distance between the two bands will contract and Exponential Deviation Bands width will decrease. Meaning there is a tendency for bands to alternate between expansion and contraction.
When the bands are relatively far apart, that is often is a sign that the current trend is ending. When the distance between the two bands is relatively narrow that often is a sign that the market is about to initiate a bigger move in either direction.


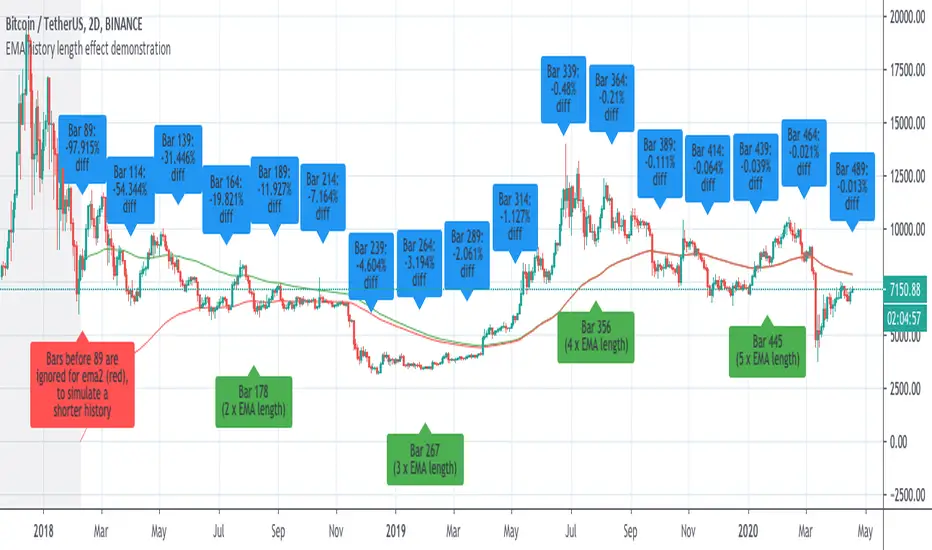
Demonstration of how history length affects all EMA valuesI saw some discussion of this so I whipped up an example to prove the that effect of history length on EMA values is pronounced, even for bars much further than the EMA length from the first candle of the chart.
This chart has two 89-bar EMAs of the close: a green one and a red one. However, for the red one, the first 89 bars of the graph are considered to have a close of "0", which is exactly whatTradingView's EMA calculation uses for bars before the start of the graph.
This is because unlike other moving averages, which reference the price of previous bars, the EMA references the EMA of previous bars. Therefore, bars closer to the beginning of the chart, where TradingView can't calculate an EMA because there is no previous EMA and therefore uses 0, will return substantially different values for the EMA() function that the same cart would with more history.
The further a bar is back in history, the less influence it has. However, every single historical bar has some influence on the EMA of every later bar.
To allow you to see this for yourself, this script contains the following inputs which you can change to see the effect:
-EMA period (default 89)
-Number of bars to ignore for EMA2 (default 89)
-decimal precision to show differences in. By making this a large number you can see that, although the effects diminish, history length affects all EMA values for the char.
-label spacing (increase this if you have a long history and run into TV's 50-label limit)
6 Moving Averages with MTF v1.0This indicator is a collection of 6 different period Moving Averages. It has support for different time-frame resolution for all of them individually.
Also, it has 11 different type of Moving Average calculation functions:
1. Simple Moving Average (SMA)
2. Exponential Moving Average (EMA)
3. Weighted Moving Average (WMA)
4. Volume Weighted Moving Average (VWMA)
5. Smoothed Moving Average (SMMA)
6. Double Exponential Moving Average (DEMA)
7. Triple Exponential Moving Average (TEMA)
8. Hull WMA Moving Average (HullMA)
9. Triangular Moving Average (TMA)
10. Super Smoother Moving Average (SSMA)
11. Zero Lag Exponential Moving Average (ZEMA)
Note: The Moving Average calculation function is adapted from @JustUncleL
Happy trading 😉
Thank you.

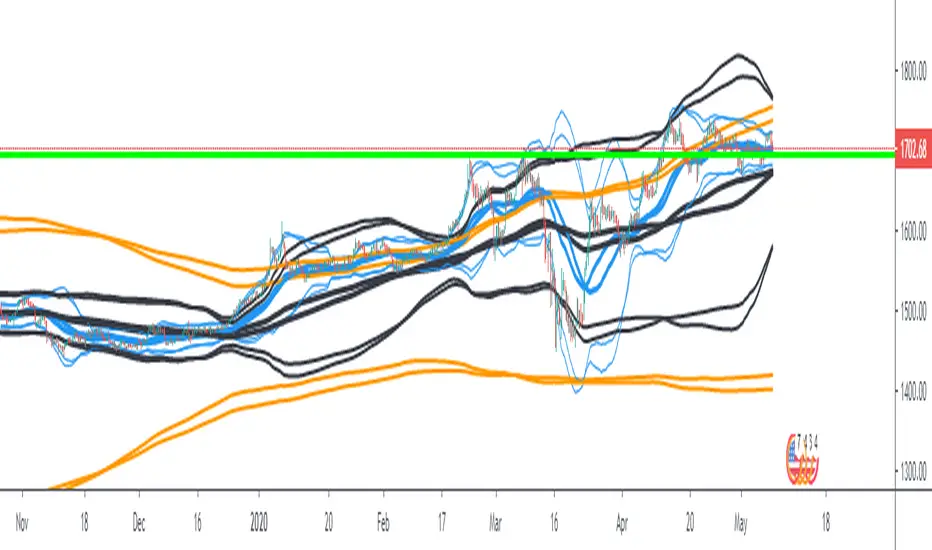
Bollinger Bands Ema 50,200,800EMAs converted to Bollinger Bands The bands are 50, 200 and 800 period, forming a strategy and having clear trends and stronger supports and resistances (when the lines converge the area is stronger).
Bitcoin Power Law CorridorOpen-source live tracker of Harold Burger's Bitcoin "Power Law Corridor".
Added optional chart fill and labels to show the percentage delta to the regression center-line, support and resistance.


Alpha-Decreasing Exponential Moving AverageThe alpha parameter of this moving average decreases with every new bar on the chart, so it will become more slowly and slowly in course of time. Can act like additional support/resistance line but works in an acceptable way on weekly and monthly timeframes only.

EMA 21,13,8 - scalping3 EMAs will help identify and predict uptrends and downtrends
-If EMAs are all above the candles it a sign to sell & if the EMAs are below its a sign to buy
- If the Green-8 EMA crosses or touches red candle then flips under the other EMAs & candles then it's time to sell
-If the Green-8 EMA crosses or touches green candle then flips above the other EMAs & candles then it's time to buy
- how far is the EMAs from the candle it'll show how strong the trend. combine this strategy with the stochastic oscillator & RSI to get the maximum benefit


4 Fibonacci EMAsAdd 4 Fibonacci EMAs to your charts with one indicator.
Configureable by value, so they don't necessarily have to use Fibonacci numbers, and by colors.

AntiRekt RibbonThis script is a fork of the Madrid Ribbon, the only difference is that you can color your bars depending on the trend.

Multiple EMAMultiple EMA. Color switch of slowest EMA (def=200) when price close below or above. Trend marker when fastest EMA (def=9) cross slowest EMA (def=200).
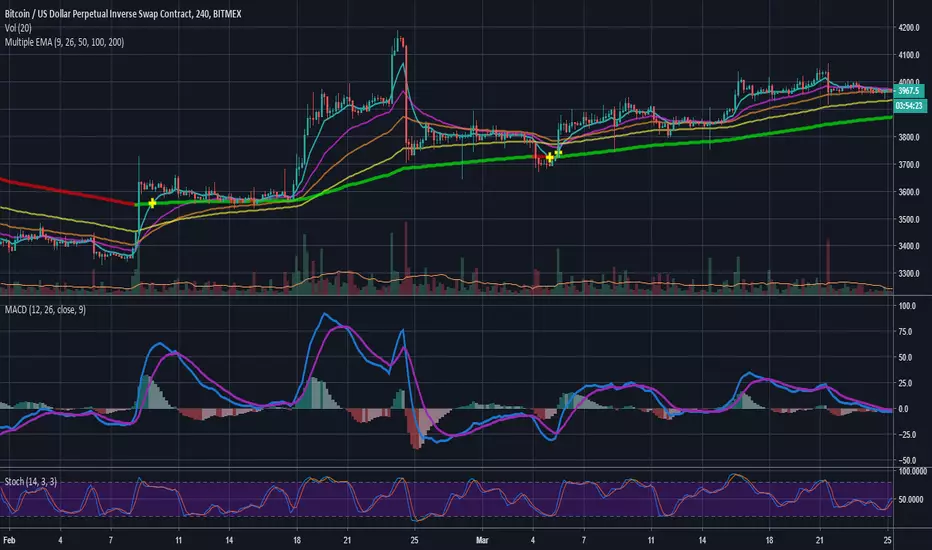
Multiple EMAMultiple EMA lines. Color switch of slowest EMA (def=200) when price close above or below. Trend marker when fastest EMA (def=9) cross slowest one.

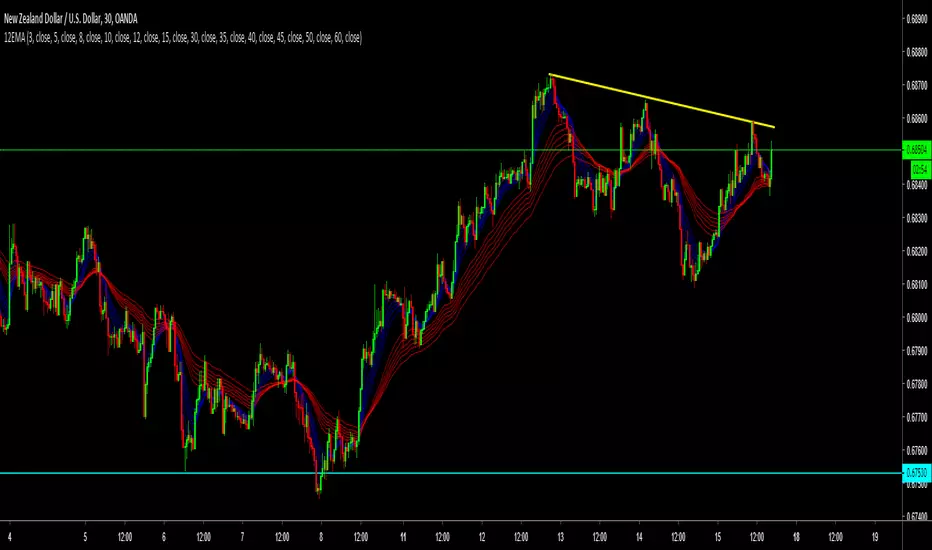
12 Exponential Moving AveragesThe Guppy Multiple Moving Average (GMMA). The short-term MAs are typically set at 3, 5, 8, 10, 12, and 15 periods. The longer-term MAs are typically set at 30, 35, 40, 45, 50, and 60.

12 Exponential Moving Averages Guppy The Guppy Multiple Moving Average (GMMA). The short-term MAs are typically set at 3, 5, 8, 10, 12, and 15 periods. The longer-term MAs are typically set at 30, 35, 40, 45, 50, and 60.
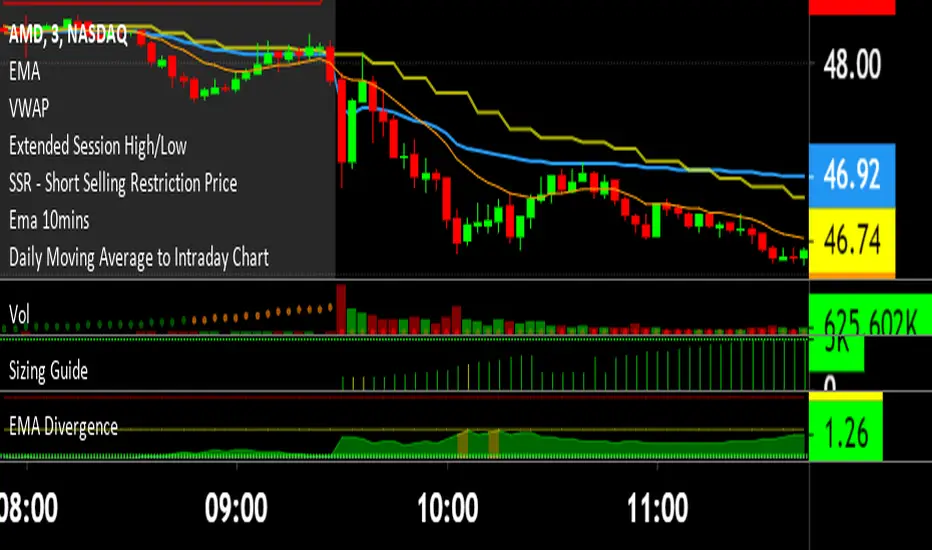
EMA DivergenceThis script automatically calculates the divergence between your favorite exponential moving average and the current price (13 ema default).
Additionally, it displays the area in yellow once the first threshold gets reached (1.5% divergence default) and in red once the second threshold gets reached (1.5% divergence default).
Higher Timeframe EMAThis script plots a higher timeframe EMA to your chart.
You can specify the timeframe and the length of the EMA in the settings.
This chart demonstrates the 5-minute 50EMA (black) combined with the 1-hour 50EMA (colored) on the 1 minute timeframe.

Meister Shredder - Exponential Moving Averages x4 ForecastShows the 21, 50, 100, 200 Exponential Moving Average + 6 bar forecast