Yen Carry Composite Index + Macro Flow GaugeWhat This Indicator Does
This chart visualizes the strength, trend, and macro conditions supporting or weakening the yen carry trade a strategy where investors borrow in low yielding yen to invest in higher yielding assets
How It Works: Core Components
Composite Index (Blue Line):
A weighted blend of z-scores from:
USD/JPY (strength of USD vs JPY)
10Y yield spread (US – Japan)
AUD/JPY (risk proxy for carry appetite)
VIX (global risk sentiment, inverted)
Z-scores normalize each input to show how far it deviates from recent history (not raw values).
Positive composite trend ⬅️ strong carry environment
Negative composite trend ➡️ signs of unwind or stress
Individual Z-Score Lines:
🟥 USD/JPY
🟩 Yield Spread (US10Y − JP10Y)
🟪 FX Proxy (AUD/JPY)
🟦 VIX (risk sentiment)
Threshold Lines & Signal Markers:
Green 🟢⬅️🟢🟢 “carry active” threshold (+1.5 std dev)
Red dashed line 🔴➡️🔴🔴→ “carry unwind risk” (−1.5 std dev)
Carry Trade Strength Gauge (Horizontal Bar, Bottom-Right) www.tradingview.com
Slots:
🟢 = strong carry inflow conditions
⚪ = neutral midpoint
🔴 = outflow / unwind pressure
A directional arrow (⬅️ or ➡️) shows momentum:
➡️ = composite rising → improving carry environment
⬅️ = composite falling → deteriorating carry conditions
Arrow is placed at the current strength level, visually combining position + momentum
Labels “Inflows” and “Outflows” flank the bar for clarity
Use Case Summary
Macro risk overlay for JPY pairs, EM FX, bond carry strategies
Detect early unwind phases (e.g. if arrow ⬅️ appears in red zone)
Confirm entry/exit in directional JPY trades or expected liquidity to enter the markets
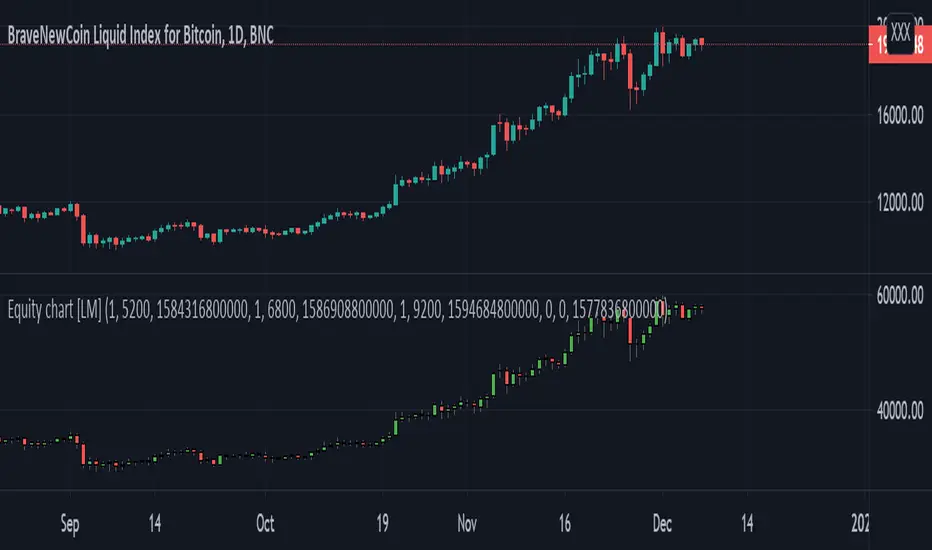
Equitytrading

Equity chart [LM]Hey Guys,
I have created draft version of chart where you can put your position amount and position price and position date for each entry and it will chart your equity as candle stick chart. There are currently possible to include 4 positions but you can add as many you like by modyfing the code.
It will calculate your average entry based on your input and in date where you add other entry it will create gap. I have already plan to include there also leverage on each position. The idea is that you should trade your equity and with this indicator you will be able to create your custom indicator based on equity chart and not price chart.
!! Unless you will enter position nothing will be rendered
Indicator is under breadth indicator because didn't know where to put it.
I release this script for collaboration and improving the idea with new features
Cheers,
Lukas