Multi-Average Trend Indicator (MATI)[FibonacciFlux]Multi-Average Trend Indicator (MATI)
Overview
The Multi-Average Trend Indicator (MATI) is a versatile technical analysis tool designed for traders who aim to enhance their market insights and streamline their decision-making processes across various timeframes. By integrating multiple advanced moving averages, this indicator serves as a robust framework for identifying market trends, making it suitable for different trading styles—from scalping to swing trading.
MATI 4-hourly support/resistance
MATI 1-hourly support/resistance
MATI 15 minutes support/resistance
MATI 1 minutes support/resistance
Key Features
1. Diverse Moving Averages
- COVWMA (Coefficient of Variation Weighted Moving Average) :
- Provides insights into price volatility, helping traders identify the strength of trends in fast-moving markets, particularly useful for 1-minute scalping .
- DEMA (Double Exponential Moving Average) :
- Minimizes lag and quickly responds to price changes, making it ideal for capturing short-term price movements during volatile trading sessions .
- EMA (Exponential Moving Average) :
- Focuses on recent price action to indicate the prevailing trend, vital for day traders looking to enter positions based on current momentum.
- KAMA (Kaufman's Adaptive Moving Average) :
- Adapts to market volatility, smoothing out price action and reducing false signals, which is crucial for 4-hour day trading strategies.
- SMA (Simple Moving Average) :
- Provides a foundational view of the market trend, useful for swing traders looking at overall price direction over longer periods.
- VIDYA (Variable Index Dynamic Average) :
- Adjusts based on market conditions, offering a dynamic perspective that can help traders capture emerging trends.
2. Combined Moving Average
- The MATI's combined moving average synthesizes all individual moving averages into a single line, providing a clear and concise summary of market direction. This feature is especially useful for identifying trend continuations or reversals across various timeframes .
3. Dynamic Color Coding
- Each moving average is visually represented with color coding:
- Green indicates bullish conditions, while Red suggests bearish trends.
- This visual feedback allows traders to quickly assess market sentiment, facilitating faster decision-making.
4. Signal Generation and Alerts
- The indicator generates buy signals when the combined moving average crosses above its previous value, indicating a potential upward trend—ideal for quick entries in scalping.
- Conversely, sell signals are triggered when the combined moving average crosses below its previous value, useful for exiting positions or entering short trades.
Insights and Applications
1. Scalping on 1-Minute Charts
- The MATI excels in fast-paced environments, allowing scalpers to identify quick entry and exit points based on short-term trends. With dynamic signals and alerts, traders can react swiftly to price movements, maximizing profit potential in brief price fluctuations.
2. Day Trading on 4-Hour Charts
- For day traders, the MATI provides essential insights into intraday trends. By analyzing the combined moving average and its relation to individual moving averages, traders can make informed decisions on when to enter or exit positions, capitalizing on daily price swings.
3. Swing Trading on Daily Charts
- The MATI also serves as a valuable tool for swing traders. By evaluating longer-term trends through the combined moving average, traders can identify potential swing points and adjust their strategies accordingly. The flexibility of adjusting the lengths of the moving averages allows for tailored approaches based on market volatility.
Benefits
1. Clarity and Insight
- The combination of diverse moving averages offers a clear visual representation of market trends, aiding traders in making informed decisions across multiple timeframes.
2. Flexibility and Customization
- With adjustable parameters, traders can adapt the MATI to their specific strategies, making it suitable for various market conditions and trading styles.
3. Real-Time Alerts and Efficiency
- Built-in alerts minimize response times, allowing traders to capitalize on opportunities as they arise, regardless of their trading style.
Conclusion
The Multi-Average Trend Indicator (MATI) is an essential tool for traders seeking to enhance their technical analysis capabilities. By seamlessly integrating multiple moving averages with dynamic color coding and real-time alerts, this indicator provides a comprehensive approach to understanding market trends. Its versatility makes it an invaluable asset for scalpers, day traders, and swing traders alike.
Important Note
As with any trading tool, thorough analysis and risk management are crucial when using this indicator. Past performance does not guarantee future results, and traders should always be prepared for market fluctuations.
EMAS

Adaptive Fibonacci Trend Ribbon[FibonacciFlux]Adaptive Fibonacci Trend Ribbon (FibonacciFlux)
Overview
The Adaptive Fibonacci Trend Ribbon is a versatile technical analysis tool designed for traders who want to leverage the power of multiple moving averages while integrating Fibonacci numbers. This indicator provides a dynamic visual representation of market trends, enhancing decision-making processes in trading.
Key Features
1. Multi-Moving Averages
- The indicator calculates eight different moving averages based on user-defined periods, including Fibonacci numbers such as 5, 8, 13, 21, 34, 55, 89, and 144.
- Traders can choose from various moving average types, including EMA, HMA, WMA, VWMA, ALMA, SMA, RMA, and TMA , allowing for tailored analysis based on market conditions.
2. Trend Detection
- Each moving average is color-coded based on its trend direction, with green indicating an upward trend and red indicating a downward trend.
- This visual clarity helps traders quickly assess market sentiment and make informed decisions.
3. Fill Areas for Enhanced Insight
- The indicator features fill areas between the moving averages, which dynamically change color according to their relative positions.
- This provides a clear visual cue of trend strength and potential reversal points, allowing traders to identify key areas of interest.
4. Customizable Inputs
- Users can easily adjust the source data, moving average lengths, and ALMA parameters (offset and sigma) to fit their trading strategies.
- This flexibility ensures that traders can adapt the tool to various market conditions and personal preferences.
Insights and Applications
1. Fibonacci Integration
- By incorporating Fibonacci numbers into the moving average periods, this indicator allows traders to align their strategies with key levels of support and resistance.
- This can enhance the accuracy of entry and exit points, particularly in trending markets.
2. Trend Continuation and Reversal Analysis
- The adaptive nature of the moving averages provides insights into potential trend continuations or reversals.
- Traders can use the indicator to identify when to enter or exit positions based on the interaction between the moving averages.
3. Visual Clarity for Quick Decisions
- The color-coded moving averages and fill areas offer immediate visual feedback on market conditions, helping traders react swiftly to changing dynamics.
- This is especially useful in fast-moving markets where timely decisions are critical.
Conclusion
The Adaptive Fibonacci Trend Ribbon is an essential tool for traders looking to enhance their technical analysis capabilities. By combining multiple moving averages with Fibonacci integration and dynamic visual cues, this indicator offers a robust framework for understanding market trends. Its flexibility and clarity make it an invaluable asset for both novice and experienced traders alike.
Open Source Contribution
This indicator is open source, inviting contributions and improvements from the trading community. Feel free to fork, enhance, and share your insights with the world, helping to foster a collaborative environment for traders everywhere.

Distance between EMA 50-100/100-150This script calculates and plots the percentage difference between the 50-period, 100-period, and 150-period Exponential Moving Averages (EMA) on a TradingView chart. The aim is to provide a clear visual representation of the market's momentum by analyzing the distance between key EMAs over time.
Key features of this script:
1. EMA Calculation : The script computes the EMA values for 50, 100, and 150 periods and calculates the percentage difference between EMA 50 and 100, and between EMA 100 and 150.
2. Custom Threshold : Users can adjust a threshold percentage to highlight significant divergences between the EMAs. A default threshold is set to 0.1%.
3. Visual Alerts : When the percentage difference exceeds the threshold, a visual marker appears on the chart:
Green Circles for bullish momentum (positive divergence),
Red Circles for bearish momentum (negative divergence),
Diamonds to indicate the first occurrence of new bullish or bearish signals, allowing users to catch fresh market trends.
4. Dynamic Plotting : The script plots two lines representing the percentage difference for each EMA pair, offering a quick and intuitive way to monitor trends.
Ideal for traders looking to gauge market direction using the relationship between multiple EMAs, this script simplifies analysis by focusing on key moving average interactions.

Support Resistance Pivot EMA Scalp Strategy [Mauserrifle]A strategy that creates signals based on: pivots, EMA 9+20, RSI, ATR, VWAP, wicks and volume.
The strategy is developed as a helper for quick long option scalping. This strategy is primarily designed for intraday trading on the 2m SPY chart with extended hours. However, users can adapt it for use on different symbols and timeframes. These signals are meant as a helper rather than fully automated trading bots.
One of the key elements is its pivot-based calculation, driven by my integrated indicator "Support and Resistance Pivot Points/Lines ". It enables multi-timeframe pivot calculations which are used to generate the signals and offers customizability, allowing you to define rounding methods and cooldown periods to refine pivot levels. The pivots, in combination with EMA crossovers, VWAP trend, and additional filters (RSI, ATR, VWAP, wicks and volume), create an entry and exit strategy for scalping opportunities that is useful for 0/1 DTE options with an average trade time of six minutes with the default setup for SPY. Option trading should be done outside TradingView. At this moment of release there is no option trading support.
All parameters used in the strategy are tweaked based on deep backtests results and real-time behavior. Be mindful that past performance does not guarantee future results.
The strategy is designed for intermediate and advanced users who are familiar intraday option scalping techniques.
How It Works
The strategy identifies entries based on multiple conditions, including: recently above pivot, recent EMA crossovers, RSI range, candle patterns, and VWAP uptrend. It avoids trades below the VWAP lower band due to poor backtesting results in those conditions. It creates a great number of signals when it detects an uptrend, which entails: VWAP and its lower/upper band slopes are going up, and the number of next high pivot points is greater than the number of lower pivot points. This indicates that we hope it will keep going up. In historical testing, this showed favorable results. This uptrend criteria runs on 15m charts max (where up to the VWAP effectiveness is the greatest).
The strategy also checks for candle and volume patterns, identified in backtesting to improve entry levels on historic data. Which include:
A red candle after multiple green ones, hoping to jump on a trend during a small pullback
Zero lower wick
Percentage and volume is up after lower volume candles
Percentage is up and the first and second EMA slopes are going up
Percentage is up, the first EMA is higher than the second, the price low is below the second EMA and price close above it
The VWAP uptrend overrules the candle and volume conditions (thus lots of signals during those moments).
The above is the base for many signals. There is a strict mode that adds extra checks such as:
not trading when there is no next low or high pivot
requiring a VWAP uptrend only
minimum candle percentages
This mode is for analyzing history and seeing performance during these conditions. It is worth it to create a separate alert for strict mode so you are aware of these conditions during trading.
When no stop has been defined, exits will always happen on pivot crossunder confirmations. If a stop is defined (default config), the strategy exits a position when:
the position is negative or no trail has been set
at least 1 bar has past
OR no stop has been defined (overrules previous)
trail has not been activated
The second exit condition happens when the close is below first EMA(9 by default) and when:
the position has been above first EMA
the gap between close and last pivot isn't small
the position is negative or no trail has been set
OR no stop has been defined (overrules above)
trail has not been activated
There are some more variations on this but the above are the most common. These exit conditions are a safety net because the strategy heavily relies on and favors stops. The settings allow changing stops, profit takers and trails. You can configure it to always sell without the conditions above.
The script will paint the pivot lines, trailing activation/stops, EMAs and entry/exits; with extra information in the data panel. For a complete view add VWAP and RSI to your chart, which are available from TradingView official indicator library. The strategy will not rely on those added indicators since VWAP and RSI are programmed in. You can add them to track the behavior of the signals based on these filters you have configured and have a complete view trading this strategy.
As mentioned earlier, the default settings are built for SPY 2m charts, with extended hours and real-time data. Open the strategy on this chart to study how all input parameters are used. If you don't have real-time data you need to adjust the minimum volume settings (set it to 0 at first).
The backtest
The default backtest configuration is set up to simulate SPY option trading.
Start capital is set to 10,000 and we risk around 5% of that per trade (1 contract)
Commission is set to 0.005%. The reason: at the time of this publication the SPY index price is approximately $580. Two ITM 0/1 DTE options contracts, each priced around $280, which is approximately $560. The typical commission for such a trade is around $3. To simulate this commission in the backtest on the SPY index itself, a commission of 0.005% per trade has been applied, approximating the options trading costs.
Slippage of 3 is set reflecting liquid SPY
The bar magnifier feature is turned on to have more realistic fills
Trading
In backtesting, setting commission and slippage to 0 on the SPY 2m chart shows many trades result around breaking even. Personally, I view them as an opportunity and safety net to help manage emotional decisions for exits. The signals are designed for short option scalps, allowing traders to take small profits and potentially re-enter during the strategy’s position window. It's advisable to take small potential profits, such as 4%, whenever the opportunity arises and consider re-entering if the setup still looks favorable, for example price still above ema9. Exiting a long position below ema9 is a common strategy for 2m scalping.
The average trade duration is approximately 6 minutes (3 bars). The choice between ITM (in-the-money), ATM (at-the-money), or OTM (out-of-the-money) options will depend on your trading style. Personally, I’ve seen better results with ITM options because they tend to move more in sync with the underlying index, thanks to their higher delta.
It’s important to note that the signals are designed to be a helper for manual trading rather than to automate a bot. Users are encouraged to take small profits and re-enter positions if favorable conditions persist. Be mindful that past performance does not guarantee future results.
For the default SPY setup the losses will mostly be 4-10% for ITM options. Be mindful of extreme volatile conditions where losses may reach 30% quickly, especially when trading ATM/OTM options.
The following settings can be changed:
8 pivot timeframes with left/right bars and days rendered
Here you can configure the timeframes for the pivots, which are crucial. The strategy wants that a crossover has happened recently (so it might enter after a crossunder if the crossover was recent) or the price is still above the crossed pivot.
When you decide to use a pivot timeframe higher than your chart, make sure it aligns the same starting point as the chart timeframe. As stated in the 43000478429 docs, there is a dependency between the resolution and the alignment of a starting point:
1–14 minutes — aligns to the beginning of a week
15–29 minutes — aligns to the beginning of a month
from 30 minutes and higher — aligns to the beginning of a year
This alignment also affects the setting of rendered days. I recommend a max value of 5 days for 1-14 minutes timeframes.
Also make sure a higher pivot timeframe can be divided by the lower. For instance I had repaint issues using 3m pivots on a 2m chart. But 4m pivots work fine.
Please look up docs 43000478429 to make sure this information is still up to date.
Pivot rounding
The pivot rounding option is used to add pivots based on a rounded price and limit the number of pivots. While this feature is disabled by default it can be useful with tweaking strategy variations, because many orders are placed at rounded levels and tend to act as strong price barriers.
There are multiple rounding methods: round, ceil/floor, roundn (decimal) and rounding to the minimal tick.
The next feature is a powerful extension called "Cooldown rounding":
Pivot cooldown rounding
This rounds new pivot levels for a cooldown period to keep the previous pivot line instead of adding a new line when they match the rounded value within the cooldown period. The existing line will be extended. This feature is useful because it makes sure the initial line is added to the exact high/low pivot level but any future lines within the rounding will just extend the existing line. This limits the number of pivots while still having precise levels (which normal rounding lacks) and allows more precise pivot trading.
This feature also helps ensure that the number of rendered lines will not exceed 500 too much, which is the render limit on TradingView.
You can set a maximum minutes for the cooldown. The default is 3 years which will enable the cooldown rounding permanently on the intraday (due to the max bar limit).
Pivot always added when new higher/lower pivot
When using cooldown rounding, one may find it useful to override this behavior when a new lower or higher pivot level has been reached. When enabled the new level will be added despite the fact that they may be rounded the same in the cooldown check. This is a good balance between limiting pivots but also allowing preciser trading.
VWAP bands multiplier
This is used to tweak the inner VWAP working for the upper and lower band. The default VWAP multiplier (0.9) is set based on backtesting since it performed better on historic data (the strategy does not trade below the lowerband). When you add the VWAP indicator from the TradingView library to the chart, make sure it uses the same multiplier setting as within this strategy so you have a correct view of the conditions the strategy acts on.
ATR EMA smoothing length
Used to tweak the ATR EMA smoothing. By default it is set up to 4 based on deep backtesting historic data.
EMA lengths
Changing the EMA length allows you to fine tune the EMA crossing behavior. By default the strategy is set up to EMA 9 and 20 which are considered commonly used values on the 2-minute chart.
Trading intraday time restrictions
For intraday charts you can configure when the strategy starts trading after market open and when it stops, including a hard sell. This makes sure there are no open positions left for the day during backtesting and can also aid in your trading style. For example some scalpers will not trade in the first two hours. Having no signals during this time can be beneficial. It is possible to configure these settings based on the number of bars or minutes.
Not trading on days the market closes earlier
By default the strategy does not trade on days the market closes earlier in the US. This makes sure there are no open positions left open during backtesting. Make sure to change it when using it on such a day. The days are: day before independence day, day after thanksgiving, Christmas eve and new years eve.
Not trading below VWAP lowerband
Backtesting has shown poor performance when trading below the VWAP lowerband but you are free to allow it to trade in such conditions. Past performance does not guarantee future results.
Minimum volume
A minimum volume can be set up. The current value is based on better deep backtest results for SPY using real-time data (48000). When you do not have a data plan for SPY, please set it to 0 and tweak based on backtests.
Minimum ATRP
The strategy has shown during my trading that it is sensitive to higher ATRP values and more volatile market conditions. There is more chance the index moves and we can profit from this during option scalping (if it moves in your favor). The default is based on SPY backtesting (0.04%), as a balance to have a lot of trades but also capture minimal movement.
RSI range
A RSI range can be set using a minimum and maximum value so we can limit trading during overbought/oversold conditions. Backtesting for SPY has shown the strategy performs better on historic data within a tighter range, so a default range has been set to 40-65.
Allow orders on every tick (no effect on stop/profit/trail)
This setting is used to allow orders on every tick. The strategy has been developed without trading on every tick but you can change this, for example when you have configured a setup different than the default configuration that you know works well with this. The default setup will not work well with it due to too many constant signals.
Stop percentage + ATRP threshold
One of the most important settings for managing the risk. I recommend setting a stop percentage first and later the ATRP threshold where the stop is calculated based on the current ATRP value. The calculated value will only be in effect when it is greater than the normal stop--the normal stop acts as baseline. The default stop is low (0.03). With a default ATRP threshold stop of 1.12, the calculated value overrules the normal stop when the value is greater. 0.03 acts as a minimum value but in reality the stop will most likely be higher on average for SPY with the default ATRP threshold.
For the default SPY setup the losses will be around 4-10% for ITM options. Be mindful of extreme volatile conditions where losses may reach 30% quickly, especially when trading ATM/OTM options.
Profit taker percentage + ATRP threshold
Same principles as the stop percentage above, but for profit taking. There is a very high ATRP threshold of 4 set by default. Backtests showed that trailing stops perform better on historic data.
Trailing stop
Used to set up a trailing stop. A useful feature to secure profit after a run-up, or get out with a small loss after initial activation. It is important to not use too tight values because they will give unrealistic backtest results and trigger too fast in real-time. Both the trail activation level and trail stop itself can be configured with a percentage value and ATRP value. I recommend setting up the ATRP last. By default the values are 0.05 for activation and 0.03 for the stop based on SPY real-time behavior.
Always sell on pivot crossunder confirmation
The strategy includes pivot crossunder confirmations as sell condition. By default it will not sell on every crossunder confirmation but checks for different conditions (explained in detail earlier in this description). You can change this behavior.
Always sell below first EMA when position has been above
The strategy sells below the first EMA when the position has been above it. By default it will not always sell but checks for different conditions (mentioned earlier in this description). You can change this behavior.
Buy modes pivot
By default the strategy buys between pivots as long as there has been a pivot crossover and EMAs crossover recently or price is still above it. You can change the behavior so it only buys on pivot crossovers or pivot crossover confirmations. Backtesting on the default setup shows decreased performance but for other strategy variations and pivot setups this feature can be useful since many scalpers do not buy between pivots.
Strict mode
There is a strict mode that adds extra checks such as not trading when there is no next low or high pivot, requiring a VWAP uptrend only and minimum candle percentages. This mode is for analyzing history and seeing performance during these conditions. It is worth it to create a separate alert for strict mode so you are aware of these conditions during trading. The deep backtests improved with these setting but past performance does not guarantee future results.
In the strict mode section you can override the stop, minimum ATRP, set up a minimum percentage, only trade VWAP uptrends and to not trade candles without a wick.
A summary and some extra detail
At the time of release only long trades are supported
The strategy is meant for quick scalping but one might find other uses for it
Enable extended hours on intraday charts so it captures more pivots
It does not trade extended hours (pre and post market) since options do not trade during those times
real-time data is recommended and required if a symbol has delayed data by default
You can configure that it trades minutes after market open and hard sells minutes after market open
The entries have a specific label text, example: "833 LE1 / 569.71 / P:569.8". This means: / / . The condition number is only for development/debug purposes for me when you have an issue.
The strategy cannot be tweaked to work on multiple symbols and timeframes with a single config. So you will have to make a config for every timeframe and symbol. I recommend using the Indicator Templates feature of TradingView. This way you can save the settings per timeframe and symbol
The strategy is per default config very dependent on (trailing) stops because it trades between pivots too. It wants that a pivot and EMA crossover has happened more recently than a crossunder. But you can change this behavior to always force crossover buys and crossunder sells.
It’s recommended to set up alerts to notify you of entry and exit signals. Watching the chart alone might cause you to miss trades, especially in fast-moving markets.
Only a max of 500 lines can be rendered on the chart, but the strategy will function with more under the hood. When you exceed 500 you will notice the beginning of the chart has no pivots, but beneath everything functions for backtesting.
Changing settings
Changing the settings for a different symbol and/or timeframe can be a challenging task. Here's a how-to you could use the first time to help you get going:
Set commission and slippage to 0. I prefer to do this so it is more clear whether you are balancing on break-even trades
Enable the pivot timeframe equal or above your chart timeframe. Avoid repainting as discussed earlier by choosing timeframes that align with the same timeframe
Set all volume, ATR, stop, profit takers and trail values to 0
Make sure strict mode is disabled at the bottom of the settings
You now have a clean state and you should see the backtest results purely based on pivot and EMA conditions
Tweak the stop and profit taker, beginning with the simple values and then ATRP threshold
At the last moment tweak the trailing stops. Tight trailing stops create an unrealistic backtest so you will need to tweak them based on real-time behavior of the symbol you're using which you will have to monitor during signals while the market is open. The default values are low (2m intraday SPY). Only with the bar magnifier feature it is somewhat possible to tweak realistic with history data. The tighter they are, the more unrealistic your backtest results. As a starting point, set the trailing stop low and find the highest activation level that doesn't change the results drastically, then increase the stop to the value you think reflects real-time behavior.
Keep refining by testing it during real-time behavior. Does it exit too early according to your own judgment? You need to increase the stop and maybe the activation level.
I hope you will find this useful!
DISCLAIMER
Trading is risky & most day traders lose money. This indicator is purely for informational & educational purposes only. Past performance does not guarantee future results.

RupaliStocksThe RupaliStocks indicator is a comprehensive tool for technical analysis, designed to combine key trading signals, moving averages, volume analysis, and price action. It provides valuable insights into market trends, momentum, and potential entry/exit points. The script incorporates ATR trailing stops, EMA crossovers, volume signals, and pivot levels for well-rounded market analysis.
Key Features:
ATR Trailing Stop:
Uses the Average True Range (ATR) to set trailing stops for positions, helping traders identify potential reversal points or trailing stop losses.
The trailing stop is calculated with a configurable period (default 20) and a multiplier (default 4.5).
Buy/Sell Signals:
Buy and Sell signals are generated based on price crossing above or below the trailing stop level, making it easier to follow trends.
These signals are displayed with triangle shapes on the chart, marking potential trade entry or exit points.
Exponential Moving Averages (EMA):
Plots different EMAs across multiple time frames to identify trend direction.
Includes 9 EMA, 15 EMA, 72 EMA, and 89 EMA, allowing traders to spot short-term and long-term trends.
Crossover signals are used to define trend shifts, with colored backgrounds indicating bullish or bearish conditions.
VWAP (Volume Weighted Average Price):
The script plots the VWAP, which helps traders assess the average price weighted by volume.
It is particularly useful for determining the market's overall trend or fair value price.
Unusual Volume Detection:
Identifies unusual trading volume spikes that may indicate significant price movements or market sentiment changes.
Unusual volume up or down is detected when the volume is 1.2 times higher than the 20-period SMA of the volume.
Pivot Points:
The script calculates Pivot, Top Central (TC), and Bottom Central (BC) levels based on daily high, low, and close prices.
These pivot levels are essential for identifying potential support and resistance areas.
Daily Open, Previous Day High/Low/Close:
Tracks and plots the daily open price, as well as the previous day’s high, low, and close prices.
These levels are displayed as circles on the chart, helping traders visualize key levels from previous sessions.
Customizable MA Lengths:
Provides options to plot various simple moving averages (SMA) with customizable lengths (21, 50, 100, 200) for short, medium, and long-term trends.
EMA Pipeline:
Displays a combination of high and low EMAs (default period 90) to give a smoothed view of price movements, further helping traders understand market flow.
Candle Color Customization:
Changes the color of candles based on their relationship to the EMA (72 or 89). Green indicates bullish sentiment, red for bearish, and yellow for indecision.
Additional Features:
Multi-timeframe support: The script allows pulling data from different timeframes (1 minute, 3 minute, etc.), making it versatile for intraday and longer-term traders.
EMA Cross Highlighting: Highlights key EMA crossovers with colored areas to indicate bullish (green) or bearish (red) momentum.
Background Color Shading: Provides visual cues for price movements relative to EMA, enhancing the readability of trends.
This indicator is particularly useful for trend-following strategies, breakout trading, and volume-based decision-making.
Suggested Uses:
Trend Following: Use EMA crossovers and ATR trailing stops to ride trends and manage risk with stop-loss levels.
Volume Analysis: Identify market sentiment shifts using unusual volume spikes.
Pivot Points: Determine intraday support and resistance using calculated pivot levels.
VWAP Trading: Trade around the VWAP to find fair value entry or exit points.

Bias TF TableThis indicator is a technical analysis tool designed to evaluate the price trend of an asset across multiple time frames (5 minutes, 15 minutes, 30 minutes, 1 hour, 4 hours, daily, and weekly).
Main Functions:
Directional Bias: Displays whether the trend is bullish (Up) or bearish (Down) for each time frame, using the closing price in comparison to a 50-period exponential moving average (EMA).
Table Visualization: Presents the results in a table located in the bottom right corner of the chart, making it easy to read and compare trends across different time intervals.
This indicator provides a quick and effective way to assess market direction and make informed trading decisions based on the trend in various time frames.

Sigma 2.0 - Advanced Buy and Sell Signal IndicatorOverview:
Sigma 2.0 is a sophisticated trading indicator designed to help traders identify potential buy and sell opportunities across various financial markets. By leveraging advanced mathematical calculations and incorporating multiple analytical tools, Sigma 2.0 aims to enhance trading strategies by providing precise entry and exit signals.
Key Features:
Advanced Sigma Calculations:
Utilizes a combination of Exponential Moving Averages (EMAs) and price deviations to calculate the Sigma lines (sigma1 and sigma2).
Detects potential trend reversals through the crossover of these Sigma lines.
Customizable Signal Filtering:
Offers the ability to filter buy and sell signals based on user-defined thresholds.
Helps reduce false signals in volatile markets by setting overbought and oversold levels.
Overbought and Oversold Detection:
Identifies extreme market conditions where price reversals are more likely.
Changes the background color of the chart to visually indicate overbought or oversold states.
Integration of Exponential Moving Averages (EMAs):
Includes EMAs of different lengths (10, 21, 55, 200) to assist in identifying market trends.
EMAs act as dynamic support and resistance levels.
Higher Timeframe Signal Incorporation:
Allows users to include signals from a higher timeframe to align trades with the broader market trend.
Enhances the reliability of signals by considering multiple timeframes.
Custom Alerts:
Provides alert conditions for both buy and sell signals.
Enables traders to receive notifications, ensuring timely decision-making.
How It Works:
Sigma Calculation Methodology:
The indicator calculates an average price (ap) and applies EMAs to derive the Sigma lines.
sigma1 represents the smoothed price deviation, while sigma2 is a moving average of sigma1.
A crossover of sigma1 above sigma2 generates a buy signal, indicating potential upward momentum.
Conversely, a crossover of sigma1 below sigma2 generates a sell signal.
Signal Filtering and Thresholds:
Users can enable filtering to only consider signals when sigma1 is below or above certain thresholds.
This helps in focusing on more significant market movements and reducing noise.
Overbought/Oversold Levels:
The indicator monitors sigma1 to detect when the market is in extreme conditions.
Background color changes provide a quick visual cue for these conditions.
EMA Analysis:
The plotted EMAs help in confirming the trend direction.
They can be used alongside Sigma signals to validate trade entries and exits.
Higher Timeframe Signals:
Incorporates signals from a user-selected higher timeframe.
Helps in aligning trades with the overall market trend, increasing the potential success rate.
How to Use:
Adding the Indicator to Your Chart:
Search for "Sigma 2.0" in the TradingView Indicators menu and add it to your chart.
Configuring the Settings:
Adjust the Sigma configurations (Channel Length, Average Length, Signal Line Length) to suit your trading style.
Set the overbought and oversold levels according to your risk tolerance.
Choose whether to filter signals by thresholds.
Select the higher timeframe for additional signal confirmation.
Interpreting the Signals:
Buy Signals:
Indicated by a green triangle below the price bar.
Occur when sigma1 crosses above sigma2 and other conditions are met.
Sell Signals:
Indicated by a red triangle above the price bar.
Occur when sigma1 crosses below sigma2 and other conditions are met.
Higher Timeframe Signals:
Plotted with lime (buy) and maroon (sell) triangles.
Help confirm signals in the current timeframe.
Utilizing EMAs:
Observe the EMAs to gauge the overall trend.
Consider aligning buy signals when the price is above key EMAs and sell signals when below.
Setting Up Alerts:
Use the built-in alert conditions to receive notifications for buy and sell signals.
Customize alert messages as needed.
Credits:
Original Concept Inspiration:
This indicator is inspired by the WaveTrend oscillator and other momentum-based indicators.
Special thanks to the original authors whose work laid the foundation for this enhanced version.
Disclaimer:
Trading involves significant risk, and past performance is not indicative of future results.
This indicator is a tool to assist in analysis and should not be the sole basis for any trading decision.
Always perform thorough analysis and consider multiple factors before entering a trade.
Note:
Ensure your chart is clean and only includes this indicator when publishing.
The script is open-source and can be modified to fit individual trading strategies.
For any questions or support, feel free to reach out or comment.

Fibonacci Retracements & Trend Following Strategy V2This Pine Script strategy generates trading signals using Fibonacci levels and trend-following indicators.
1. Strategy Summary
This strategy analyzes price movements using a combination of Fibonacci levels and trend-following indicators, providing potential trading signals. The strategy includes Fibonacci levels as well as EMA (Exponential Moving Average) and ADX (Average Directional Index) indicators.
2. Indicators and Parameters
Fibonacci Levels
Fibonacci Level 1, Level 2, Level 3, Level 4: Used as Fibonacci retracement levels. These levels are typically set at 0.236, 0.382, 0.618, and 0.786. Users can adjust these values according to their preferences.
Trend-Following Indicator
Trend Length: The period for calculating the EMA used as the trend-following indicator. For example, if set to 20, the EMA will be calculated over 20 periods.
ADX (Average Directional Index)
ADX Length: The period for calculating the ADX. ADX measures the strength of the price trend and is usually set to 14 periods.
ADX Threshold: A threshold value for the ADX. This value determines when trading signals will be activated.
3. Usage Steps
Displaying the Indicator on the Chart:
On the TradingView platform, paste the code into the Pine Editor and click the "Add to Chart" button to add it to the chart.
Analyzing the Indicators:
Fibonacci Levels: Show retracement levels of price movements. When the price reaches one of these levels, potential reversals may occur.
Trend-Following Indicator: EMAs determine the direction of the trend. Green EMA represents an uptrend, while red EMA represents a downtrend.
ADX: Measures the strength of the trend. When ADX surpasses the threshold value, it indicates a strong trend.
Trading Signals:
Long Signal: Generated when the price is above the second Fibonacci level and the trend is upward. Additionally, the ADX value must be above the set threshold.
Short Signal: Generated when the price is below the second Fibonacci level and the trend is downward. Additionally, the ADX value must be above the set threshold.
Target Prices:
Long Targets: Determines upward targets based on Fibonacci levels. These targets indicate expected prices if the price reverses from Fibonacci levels.
Short Targets: Determines downward targets based on Fibonacci levels. These targets indicate expected prices if the price reverses from Fibonacci levels.
4. Chart Displays
Trend Up (Green Line): Shows the rising EMA.
Trend Down (Red Line): Shows the falling EMA.
Fibonacci Levels (Blue Lines): Shows Fibonacci retracement levels.
Long Targets (Green Circles): Shows targets for long positions.
Short Targets (Red Circles): Shows targets for short positions.
Long Signal (Green Label): Buy signal.
Short Signal (Red Label): Sell signal.
5. Important Notes
Retracement and Target Levels: Fibonacci levels can act as potential retracement or support/resistance levels. However, they should always be used in conjunction with other technical analysis tools.
Trend and ADX: ADX is used to determine the strength of the trend. Be aware that when ADX is low, trends may be weak.
6. Example Scenarios
Example 1: If the trend is upward (green EMA) and the price is above the second Fibonacci level, you may receive a long position signal. If the ADX value is above the threshold, the signal may be stronger.
Example 2: If the trend is downward (red EMA) and the price is below the second Fibonacci level, you may receive a short position signal. If the ADX value is above the threshold, the signal may be stronger.
This updated version contains significant improvements in both technical aspects and user experience. Innovations such as ADX calculations and dynamic Fibonacci levels make the strategy more robust and flexible. The code's readability and comprehensibility have been enhanced, and errors have been corrected.
This guide will help you understand the basic operation of the strategy. It is always recommended to conduct your own research and test the strategy before using it.
GOOD LUCK. // halilvarol

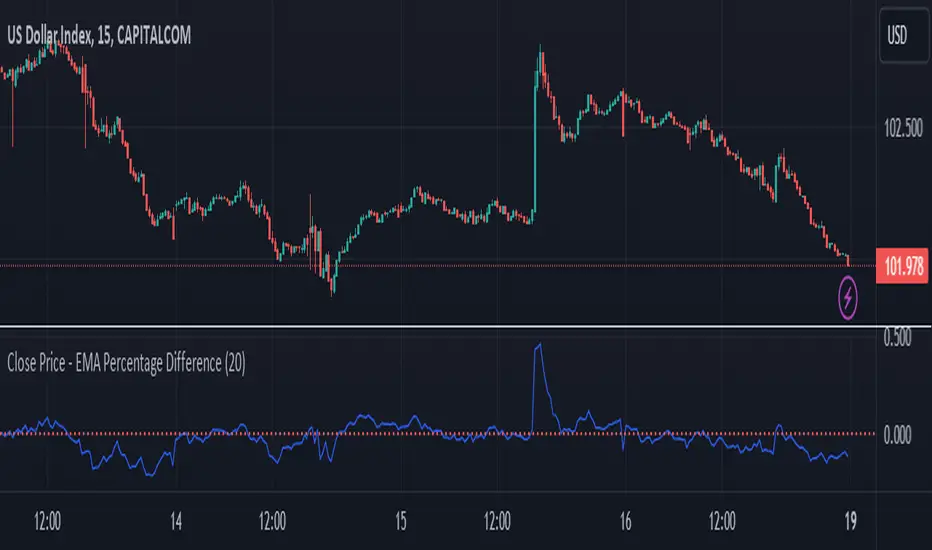
Close Price - EMA Percentage Difference
Title: Close Price - EMA Percentage Difference Indicator
Description:
The Close Price - EMA Percentage Difference Indicator is an essential tool designed to calculate and display the percentage difference between the closing price of a security and its Exponential Moving Average (EMA). This indicator is particularly useful for traders and analysts who want to understand how far the current price is from its EMA, providing insights into potential price trends and reversals.
Key Features:
Customizable EMA Period: Easily adjust the EMA period to match your trading strategy. Whether you're focusing on short-term trends with a 20-period EMA or analyzing long-term trends with a 200-period EMA, this indicator is flexible to suit your needs.
Percentage Difference Calculation: The indicator computes the percentage difference between the closing price and the selected EMA, allowing you to see how much the current price deviates from its moving average in percentage terms. This calculation helps in identifying potential buying or selling opportunities based on price movements relative to the EMA.
Zero Line Reference: A dotted red line at the zero level is included for quick visual reference. This line helps you instantly identify when the closing price is equal to the EMA, and whether the price is above or below the EMA.
Visual Representation: The percentage difference is plotted on a separate panel below the price chart, providing a clear and intuitive visualization that aids in decision-making.
How to Use:
Adjust the EMA period to fit your analysis or trading strategy.
Observe the percentage difference to understand the strength of the current price in relation to the EMA.
Use the zero line as a reference point to determine whether the price is above (positive values) or below (negative values) the EMA, which can help in identifying overbought or oversold conditions.
This indicator is suitable for all types of traders, from day traders to long-term investors, offering valuable insights into the price dynamics relative to the EMA.
Custom EMA Multi-Timeframe Indicator [Pineify]
This innovative indicator combines Exponential Moving Averages (EMAs) across multiple timeframes to provide traders with a comprehensive view of market trends and potential trading opportunities. By analyzing short, medium, and long-term EMAs simultaneously, this indicator offers valuable insights into market dynamics and helps identify high-probability entry and exit points.
Key Features
Multi-timeframe analysis using customizable EMAs
Visual representation of trend alignment across different timeframes
Customizable EMA lengths and sources for each timeframe
Buy and sell signals based on EMA crossovers
Alert functionality for real-time trade notifications
How It Works
The Custom EMA Multi-Timeframe Indicator calculates three separate EMAs:
1. Short-term EMA: Represents immediate market sentiment
2. Medium-term EMA: Captures intermediate trend direction
3. Long-term EMA: Reflects the overall market trend
These EMAs are plotted on the chart using different colors for easy identification. The indicator generates buy and sell signals based on the relative positions of these EMAs, providing traders with clear visual cues for potential trade entries and exits.
Trading Ideas and Insights
This indicator offers several powerful trading concepts:
Trend Alignment: When all three EMAs are aligned (short above medium above long), it indicates a strong trend. Traders can look for pullbacks to enter in the direction of the trend.
Trend Reversal: When the short-term EMA crosses above or below both the medium and long-term EMAs, it may signal a potential trend reversal. This can be used to exit existing positions or enter new trades in the opposite direction.
Range-bound Markets: When the EMAs are tightly grouped together, it suggests a consolidation phase. Traders can wait for a breakout or use range-trading strategies.
Momentum Confirmation: The speed at which the short-term EMA diverges from or converges with the longer-term EMAs can indicate the strength of the current move.
Unique Aspects
What sets this indicator apart is its ability to synthesize information from multiple timeframes into a single, easy-to-interpret visual display. Unlike traditional single-timeframe EMAs, this indicator provides a more holistic view of market trends, reducing false signals and improving trade timing.
The customizable nature of the indicator allows traders to adapt it to various trading styles and market conditions. By adjusting the EMA lengths and sources, traders can fine-tune the indicator to their specific needs and preferences.
How to Use
1. Apply the indicator to your chart
2. Customize the timeframes and EMA settings as desired
3. Look for buy signals when the short and medium EMAs cross above the long EMA
4. Look for sell signals when the short and medium EMAs cross below the long EMA
5. Use the relative positions of the EMAs to gauge overall trend strength and direction
6. Combine with other technical analysis tools for confirmation
Customization
The indicator offers extensive customization options:
Short, medium, and long timeframes can be adjusted
EMA lengths for each timeframe are customizable
EMA source (close, open, high, low, etc.) can be selected for each timeframe
Colors and line styles can be modified to suit personal preferences
Alert settings can be configured for automated trade notifications
Conclusion
The Custom EMA Multi-Timeframe Indicator is a powerful tool for traders seeking to gain a comprehensive understanding of market trends across different time horizons. By combining multiple EMAs and timeframes, it provides a unique perspective on market dynamics, helping traders make more informed decisions and potentially improve their trading results.
Whether you're a day trader looking for short-term opportunities or a swing trader focusing on longer-term trends, this indicator offers valuable insights that can enhance your trading strategy. Its flexibility and customization options make it suitable for a wide range of trading styles and market conditions.
Remember: While this indicator can be a valuable tool in your trading arsenal, it should not be used in isolation. Always combine it with other forms

Multiple EMA Indicator [Pineify]TradingView Multiple EMA Indicator: A Comprehensive Trend Analysis Tool
The TradingView Multiple EMA Indicator is a powerful and versatile tool designed to provide traders with a comprehensive view of market trends across multiple timeframes. By incorporating five Exponential Moving Averages (EMAs) with customizable lengths and sources, this indicator offers a nuanced approach to trend analysis, suitable for both novice and experienced traders.
Key Features:
Five customizable EMAs for multi-timeframe analysis
Flexible source inputs for each EMA
Color-coded plots for easy visual interpretation
Overlay functionality for direct price action comparison
How It Works:
This indicator calculates and displays five separate EMAs on your chart, each with its own customizable length and source. The EMAs are color-coded for easy identification:
EMA-1: Red
EMA-2: Light Green
EMA-3: Light Blue
EMA-4: Purple
EMA-5: Yellow
By default, the indicator uses the following settings:
EMA-1: 10-period EMA of close price
EMA-2: 20-period EMA of close price
EMA-3: 50-period EMA of close price
EMA-4: 100-period EMA of close price
EMA-5: 200-period EMA of close price
However, users can easily adjust these settings to suit their specific trading strategies and preferences.
Trading Ideas and Insights:
The Multiple EMA Indicator offers several ways to analyze market trends and generate trading signals:
Trend Identification: The alignment of the EMAs can help identify the overall trend. When shorter-term EMAs are above longer-term EMAs, it suggests an uptrend, and vice versa for a downtrend.
Dynamic Support and Resistance: Each EMA can act as a dynamic support or resistance level. Price bouncing off these levels can indicate potential entry or exit points.
Crossovers: When a shorter-term EMA crosses above a longer-term EMA, it may signal a bullish trend change. Conversely, a bearish signal may occur when a shorter-term EMA crosses below a longer-term EMA.
Trend Strength: The spacing between the EMAs can indicate trend strength. Wide spacing suggests a strong trend, while narrow spacing or intertwining EMAs may indicate consolidation or a weakening trend.
Multi-Timeframe Analysis: By using different EMA lengths, traders can gain insights into short-term, medium-term, and long-term trends simultaneously.
How to Use the Indicator:
Add the indicator to your chart and adjust the input parameters as needed.
Observe the relative positions of the EMAs to identify the overall trend direction.
Look for potential entry signals when price or shorter-term EMAs cross above or below longer-term EMAs.
Use the EMAs as dynamic support and resistance levels for setting stop-loss and take-profit orders.
Combine the Multiple EMA Indicator with other technical analysis tools, such as oscillators or volume indicators, for more comprehensive trading decisions.
Customization Options:
The indicator offers extensive customization options, allowing traders to tailor it to their specific needs:
Adjust the length of each EMA to focus on different timeframes
Change the source of each EMA (e.g., close, open, high, low, HL2, HLC3, OHLC4)
Modify the color and line thickness of each EMA for better visibility
Conclusion:
The TradingView Multiple EMA Indicator is a versatile and powerful tool for trend analysis and trade decision-making. By providing a multi-faceted view of market trends, it enables traders to make more informed decisions based on a comprehensive understanding of price action across various timeframes.
Remember that while this indicator can be a valuable tool in your trading arsenal, it should not be used in isolation. Always combine it with other forms of analysis and proper risk management techniques for the best results.
We hope this indicator enhances your trading experience and contributes to your success in the markets. Happy trading!

Multi-Timeframe EMA Distance & % Change TableDescription of Multi-Timeframe EMA Distance & % Change Table
The Multi-Timeframe EMA Distance & % Change Table indicator is designed to display the distance and percentage change between the current price and the Exponential Moving Averages (EMAs) on multiple timeframes. It creates a table to show these values, with customizable options for decimal precision .
Key Features:
Inputs:
- Timeframes (tf1, tf2, tf3, tf4): User-defined timeframes for EMA calculations (e.g., 1 minute, 15 minutes, daily, etc.).
- EMA Levels (emaLevel, emaLevel2, emaLevel3): User-defined periods for three different EMAs.
EMA Calculations:
- Computes EMAs for the specified levels (50, 100, 200) on each of the user-selected timeframes.
Plotting:
- Plots the EMAs on the chart with distinct colors: Orange, Teal, and Green for different EMAs.
Display Options:
- Checkbox (displayAsPercentage): Allows the user to toggle between displaying distances or percentage changes.
- Decimal Precision:
- decimalPlacesDistance: Specifies the number of decimal places for rounded distance values.
- decimalPlacesPercentage: Specifies the number of decimal places for rounded percentage values.
Table Creation:
- Location: Table is placed in the top-right corner of the chart.
- Headers: Includes columns for each timeframe and EMA distance/percentage.
Distance and Percentage Calculations:
- Distances: Calculated as the difference between the current price and the EMA values for each timeframe.
- Percentages: Calculated as the distance divided by the EMA value, converted to a percentage.
Decimal Rounding:
- Custom Rounding Function: Ensures that distance and percentage values are displayed with the user-specified number of decimal places.
Color Coding:
- Distance Values: Colored green if positive, red if negative.
- Table Entries: Display either the rounded distance or percentage, based on user selection.
Table Update:
- The table is dynamically updated with either distance or percentage values based on the user's choice and rounded to the specified number of decimal places.
This indicator provides a comprehensive overview of EMA distances and percentage changes across multiple timeframes, with detailed control over the precision of the displayed values.

Dysmen signalsDysmen Signals Indicator
The "Dysmen Signals" indicator is designed to provide clear buy and sell signals based on the crossover of various Exponential Moving Averages (EMAs). This indicator employs a combination of short-term and long-term EMA crossovers to identify potential trading opportunities, while also highlighting significant market movements through specific signals such as the Golden Cross and Death Cross.
Indicator Components
1. Exponential Moving Averages (EMAs)
- EMA 14: A short-term EMA calculated over 14 periods.
- EMA 20: Another short-term EMA calculated over 20 periods.
- EMA 50: A mid-term EMA used as a trend filter.
- EMA 200: A long-term EMA representing the overall trend.
2. Buy and Sell Signals
- Buy Signal: This is triggered when the EMA 14 crosses above the EMA 20 and the closing price is above the EMA 50. This suggests a bullish trend in the market.
- Sell Signal: This is triggered when the EMA 14 crosses below the EMA 20 and the closing price is below the EMA 50. This indicates a bearish trend in the market.
3. Golden Cross and Death Cross
- Golden Cross (GC): Occurs when the EMA 50 crosses above the EMA 200. This is a strong bullish signal indicating a potential long-term upward trend.
- Death Cross (DC): Occurs when the EMA 50 crosses below the EMA 200. This is a strong bearish signal suggesting a potential long-term downward trend.
4. Signal Visualization
- Buy and Sell signals are marked on the chart with green and red triangles respectively. These signals help traders identify potential entry and exit points.
- Golden Cross and Death Cross signals are indicated with yellow and purple diamonds respectively, providing insight into major market trend shifts.
5. Candle Coloring
- Candles are colored green if a buy signal is active and red if a sell signal is active. This visual aid helps in quickly identifying the prevailing market sentiment.
6. EMA 200 Plotting
- The EMA 200 is plotted as a white, semi-thick line on the chart. This line serves as a reference for the overall long-term trend.
Detailed Code Explanation
- EMA Calculations: The script calculates the EMA for 14, 20, 50, and 200 periods using the ta.ema function.
- Crossover Conditions: It uses the ta.crossover and ta.crossunder functions to detect when the EMAs cross each other, triggering buy and sell signals.
- Plotting Signals: The plotshape function is utilized to display BUY and SELL signals as well as Golden Cross and Death Cross signals on the chart.
- Candle Coloring Logic: A variable direction is used to store the current market direction based on the latest signal, which then determines the candle colors using the barcolor function.
- EMA 200 Display: The plot function is used to draw the EMA 200 line on the chart with the specified color and thickness.
By employing this indicator, traders can gain valuable insights into potential market trends and make more informed trading decisions based on the crossover of key EMAs.

MTF-Colored EMA Difference and Stochastic indicatorThis indicator combines two popular technical analysis tools: the Exponential Moving Average (EMA) and the Stochastic Oscillator, with the added flexibility of analyzing them across multiple time frames. It visually represents the difference between two EMAs and the crossover signals from the Stochastic Oscillator, providing a comprehensive view of the market conditions.
Components:
EMA Difference Histogram :
EMA Calculation : The indicator calculates two EMAs (EMA1 and EMA2) for the selected time frame.
EMA Difference : The difference between EMA1 and EMA2 is plotted as a 4 coloured histogram.
Stochastic Oscillato r:
Calculation : The %K and %D lines of the Stochastic Oscillator are calculated for the selected time frame.
Additional Confirmation via Colors :
Green: %K is above %D, indicating a bullish signal.
Red: %K is below %D, indicating a bearish signal.
Entry and Exit Strategies
Entry Strategy :
Bullish Entry :
Condition 1: The histogram is Dark green (indicating a strong upward trend).
Condition 2: The Stochastic colour is green (%K is above %D).
Bearish Entry :
Condition 1: The histogram is Dark Red (indicating a strong downward trend).
Condition 2: The Stochastic colour is red (%K is below %D).
Exit Strategy:
Bullish Exit:
Condition: The Stochastic colour turns red (%K crosses below %D).
Bearish Exit:
Condition: The Stochastic colour turns green (%K crosses above %D).
Additional Considerations:
Time Frame Selection : The chosen time frame for both the EMA and Stochastic calculations should align with the trader’s strategy (e.g., daily for swing trading, hourly for intraday trading).
Risk Management : Implement stop-loss orders to manage risk effectively. The stop-loss can be placed below the recent swing low for long positions and above the recent swing high for short positions.
Confirmation : Consider using this indicator in conjunction with other technical analysis tools to confirm signals and reduce the likelihood of false entries and exits.

Pivot Points with MID LevelsThis indicator shows the Standard Pivot Points level based on daily values that can act as support and resistance. It is used by a variety of traders around the world. You can select which time frame Pivot Point Levels you'd like. Daily, weekly etc... Perfect for swing trading or day trading.
Pivot Points- Shows 3 levels of resistance, the Pivot Point and 3 levels of support
(R3, R2, R1, PIVOT POINT, S1, S2, S3
MID Levels- The MID levels are 50% retracement from the pivot point level above it and below
Example- R3, MID, R2, MID, R1, MID, PIVOT POINT, MID, S1, MID, S2, MID, S3
With this indicator you will also have the option to show the Previous days High and Low that are also important levels. On gap up/down days it is always interesting to see if price will close the gap, hence the important level to note.
PDH= Previous Days High
PDL= Previous Days Low
I have added a feature that you can now select specific color to each level and the line style for each level to help understand which levels are being show by personal needs.
Happy Trading

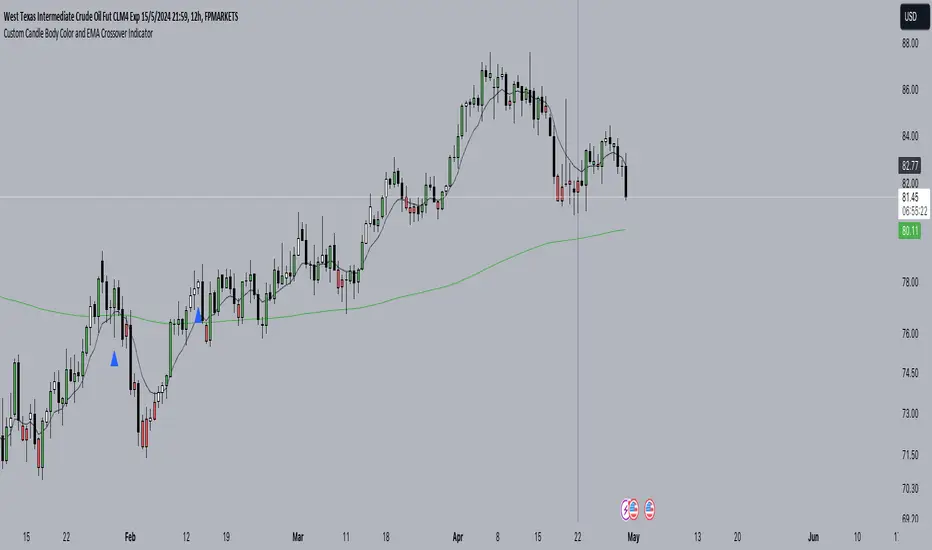
Custom Candle Body Color and EMA Crossover IndicatorWe determine if the price is below EMA 9 by comparing the close price with EMA 9.
We determine if the current candle body is huge compared to the previous candle's body.
We plot EMA 9 in black color and EMA 200 in green color.
We plot blue triangles below the bars for EMA crossover above and red triangles above the bars for EMA crossover below.
We set the color of the candle body to red if the price is below EMA 9 and to green if the price is above EMA 9, only when the current candle body is huge compared to the previous candle's body.
MTF_Super_Uzun_v5_AlarmThis Pine Script code is an indicator named "MTF_Super" (Multi-Timeframe Super) designed for TradingView. It plots exponential moving averages (EMAs) of different lengths on multiple timeframes (MTF). Users can select various time resolutions for the EMAs, such as 4 hours, 12 hours, 1 day, 1 week, 1 month, 6 months, and 3 months.
The indicator calculates EMAs based on the chosen length parameter (`ma_len`) and source data (`src`). It then requests the corresponding security data for each selected timeframe (`ferit`, `eser1`, `eser2`, etc.) and plots the EMAs with different colors for each timeframe.
By using this indicator, traders can analyze the trend of a security on multiple timeframes simultaneously, helping them make more informed trading decisions.
---
Bu Pine Script kodu, TradingView için tasarlanmış "MTF_Super" (Çok Zaman Dilimli Süper) adlı bir göstergeyi oluşturur. Birden fazla zaman diliminde (MTF) farklı uzunluklardaki üssel hareketli ortalamaları (EMA) çizer. Kullanıcılar 4 saatlik, 12 saatlik, 1 günlük, 1 haftalık, 1 aylık, 6 aylık ve 3 aylık gibi çeşitli zaman çözünürlükleri için EMA'ları seçebilirler.
Göstergenin hesaplamaları seçilen uzunluk parametresi (`ma_len`) ve kaynak veri (`src`) üzerinden yapılır. Daha sonra her seçilen zaman dilimi için karşılık gelen güvenlik verisi (`ferit`, `eser1`, `eser2` vb.) istenir ve EMA'lar farklı renklerle her zaman dilimi için çizilir.
Bu göstergeyi kullanarak, tüccarlar bir güvenliğin trendini aynı anda birden fazla zaman diliminde analiz edebilir ve daha bilinçli ticaret kararları alabilirler.

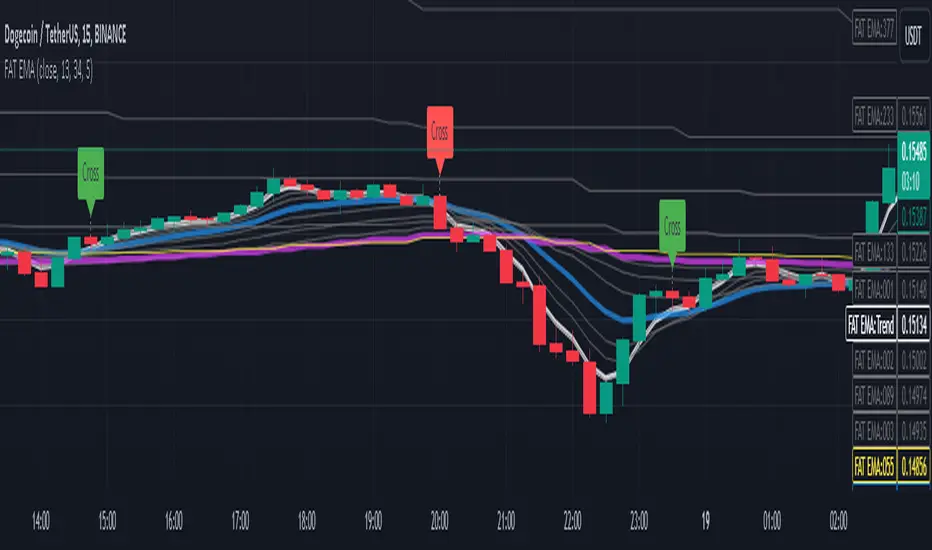
Fibonacci Adaptive Timeframe EMA (FAT EMA)The "Fibonacci Adaptive Timeframe EMA" is a sophisticated trading indicator designed for the TradingView platform, leveraging the power of Exponential Moving Averages (EMAs) determined by Fibonacci sequence lengths to provide traders with dynamic market insights. This indicator overlays directly on the price chart, offering a unique blend of trend analysis, smoothing techniques, and timeframe adaptability, making it an invaluable tool for traders looking to enhance their technical analysis strategy.
Key Features
1. Fibonacci-Based EMA Lengths: Utilizes the Fibonacci sequence to select EMA lengths, incorporating natural mathematical ratios believed to be significant in financial markets. The available lengths range from 1 to 987, allowing for detailed trend analysis over various periods.
2. Multiple Smoothing Methods: Offers the choice between several smoothing techniques, including Simple Moving Average (SMA), Exponential Moving Average (EMA), Smoothed Moving Average (SMMA or RMA), Weighted Moving Average (WMA), and Volume Weighted Moving Average (VWMA). This versatility ensures that users can tailor the indicator to suit their analytical preferences.
3. Timeframe Adaptability: Features the ability to fetch and calculate EMAs from different timeframes, providing a multi-timeframe analysis within a single chart view. This adaptability gives traders a broader perspective on market trends, enabling more informed decision-making.
4. Dynamic Visualization Options: Traders can customize the display to suit their analysis needs, including toggling the visibility of Fibonacci EMA lines, EMA prices, and smoothed EMA lines. Additionally, forecast lines can be projected into the future, offering speculative insights based on current trends.
5. Ema Tail Visualization: An innovative feature allowing for the visualization of the 'tail' or the continuation of EMA lines, which can be particularly useful for identifying trend persistence or reversal points.
6. User-friendly Customization: Through a series of input options, traders can easily adjust the source data, Fibonacci lengths, smoothing method, and visual aspects such as line colors and transparency, ensuring a seamless integration into any trading strategy.
Application and Use Cases
The "Fibonacci Adaptive Timeframe EMA" indicator is designed for traders who appreciate the significance of Fibonacci numbers in market analysis and seek a flexible tool to analyze trends across different timeframes. Whether it's for scalping, day trading, or long-term investing, this indicator can provide valuable insights into price dynamics, trend strengths, and potential reversal points. Its adaptability makes it suitable for various asset classes, including stocks, forex, commodities, and cryptocurrencies.
Fibonacci Timeframe Adaptive EMAThe "Fibonacci Timeframe Adaptive EMA" is a sophisticated trading indicator designed for the TradingView platform, leveraging the power of Exponential Moving Averages (EMAs) determined by Fibonacci sequence lengths to provide traders with dynamic market insights. This indicator overlays directly on the price chart, offering a unique blend of trend analysis, smoothing techniques, and timeframe adaptability, making it an invaluable tool for traders looking to enhance their technical analysis strategy.
Key Features
1. Fibonacci-Based EMA Lengths: Utilizes the Fibonacci sequence to select EMA lengths, incorporating natural mathematical ratios believed to be significant in financial markets. The available lengths range from 1 to 987, allowing for detailed trend analysis over various periods.
2. Multiple Smoothing Methods: Offers the choice between several smoothing techniques, including Simple Moving Average (SMA), Exponential Moving Average (EMA), Smoothed Moving Average (SMMA or RMA), Weighted Moving Average (WMA), and Volume Weighted Moving Average (VWMA). This versatility ensures that users can tailor the indicator to suit their analytical preferences.
3. Timeframe Adaptability: Features the ability to fetch and calculate EMAs from different timeframes, providing a multi-timeframe analysis within a single chart view. This adaptability gives traders a broader perspective on market trends, enabling more informed decision-making.
4. Dynamic Visualization Options: Traders can customize the display to suit their analysis needs, including toggling the visibility of Fibonacci EMA lines, EMA prices, and smoothed EMA lines. Additionally, forecast lines can be projected into the future, offering speculative insights based on current trends.
5. Ema Tail Visualization: An innovative feature allowing for the visualization of the 'tail' or the continuation of EMA lines, which can be particularly useful for identifying trend persistence or reversal points.
6. User-friendly Customization: Through a series of input options, traders can easily adjust the source data, Fibonacci lengths, smoothing method, and visual aspects such as line colors and transparency, ensuring a seamless integration into any trading strategy.
Application and Use Cases
The "Fibonacci Timeframe Adaptive EMA" indicator is designed for traders who appreciate the significance of Fibonacci numbers in market analysis and seek a flexible tool to analyze trends across different timeframes. Whether it's for scalping, day trading, or long-term investing, this indicator can provide valuable insights into price dynamics, trend strengths, and potential reversal points. Its adaptability makes it suitable for various asset classes, including stocks, forex, commodities, and cryptocurrencies.

EMA Cross Dashboard | Flux Charts💎 GENERAL OVERVIEW
Introducing our new Exponential Moving Average (EMA) Cross Dashboard! This dashboard let's you select a source for the calculation of the EMA of it, then let's you enter 2 lengths for up to 5 timeframes, plotting their crosses in the chart.
Features of the new EMA Cross Dashboard :
Shows EMA Crosses Across Up To 5 Different Timeframes.
Select Any Source, Including Other Indicators.
Customizable Dashboard.
📌 HOW DOES IT WORK ?
EMA is a widely used indicator within trading community, it is similar to a Simple Moving Average (SMA) but places more weight on recent prices, making it more reactive to current trends. Crosses of EMA lines can be helpful to determine strong bullish & bearish movements of an asset. This indicator shows finds crosses across 5 different timeframes in a dashboard and plots them in your chart for ease of use.
🚩UNIQUENESS
This dashboard cuts through the hassle of manual EMA cross calculations and plotting. It offers flexibility by allowing various data sources (even custom indicators) and customization through enabling / disabling individual timeframes. The clear visualization lets you see EMA crosses efficiently.
⚙️SETTINGS
1. Timeframes
You can set up to 5 timeframes & 2 lenghts to detect crosses for each timeframe here. You can also enable / disable them.
2. General Configuration
EMA Source -> You can select the source for the calculation of the EMA here. You can select sources from other indicators as well as more general sources like close, high and low price.

EMA 20/50/100/200 PricesDescription:
Introducing the EMA Indicator with Dynamic Labels, a unique addition to the TradingView Public Library. This innovative script enhances trend analysis and decision-making by overlaying four Exponential Moving Averages (EMAs) – 20, 50, 100, and 200 periods – on your chart, each with a distinct color for quick identification.
What sets this script apart?
Unlike standard EMA indicators, this script includes dynamic labels that display the current price level of each EMA at the latest price bar. This feature provides an instant snapshot of market sentiment, offering insights into potential dynamic support or resistance levels.
Key Features:
Customizable EMA Periods: Tailor the EMA periods according to your trading strategy, allowing for flexibility across different timeframes and assets.
Adaptive Label Sizes: A unique function adjusts label sizes based on user input, ensuring optimal readability across various display settings.
Color-Coded EMAs: Quickly differentiate between the EMAs with pre-defined colors, enhancing visual clarity and trend recognition.
How to Use:
Trend Analysis: Use the EMAs to identify the overall market trend. When shorter EMAs are above longer ones, it suggests a bullish trend, and vice versa.
Trade Entries and Exits: Look for crossovers of the EMAs as potential entry or exit signals. Dynamic labels will help you pinpoint the exact levels.
Customization: Adjust the EMA periods and label sizes under the indicator settings to match your trading style and preferences.
Underlying Concepts:
This script utilizes the classic EMA calculation but innovates by integrating dynamic, real-time labels and customizable periods. The choice of four different periods allows for a nuanced analysis of trend strength and direction, catering to both short-term traders and long-term investors.
Originality and Contribution:
The "Advanced EMA Indicator with Dynamic Labels" is original in its approach to providing real-time, actionable data through dynamic labels. It caters to the community's need for more interactive and informative indicators that go beyond basic trend analysis.
Conclusion:
Whether you're a novice trader seeking to understand market trends or an experienced investor looking for nuanced analysis tools, this script offers valuable insights and flexibility. It stands as a testament to the power of Pine Script in creating practical, user-centric trading tools.
Dual SMA/EMA BandsThe Dual SMA/EMA Bands indicator provides a clear view of market trends, combining Simple Moving Averages (SMA) and Exponential Moving Averages (EMA) in one customizable tool. Designed for any timeframe, it features Aqua and Purple Bands for 50-period and 200-period averages , respectively, aiding in trend analysis and volatility insights.
Features:
Adaptive Timeframes : Automatically aligns with the chart’s timeframe or can be manually set for cross-timeframe analysis.
Customization : Offers easy adjustments for colors, line thickness, and opacity to suit personal preferences and enhance readability.
Insights : Facilitates trend confirmation and volatility assessment, essential for informed trading decisions.
Usage Tips:
Use the bands to gauge market direction; above the bands suggests bullish conditions, below them indicates bearish trends.
The gap between EMA and SMA within each band can signal market volatility.
Apply customizable timeframes for a comprehensive market overview.
Conclusion:
With its straightforward setup and versatile application, the Dual SMA/EMA Bands indicator is a valuable tool for traders looking to deepen their market analysis and uncover trading opportunities.

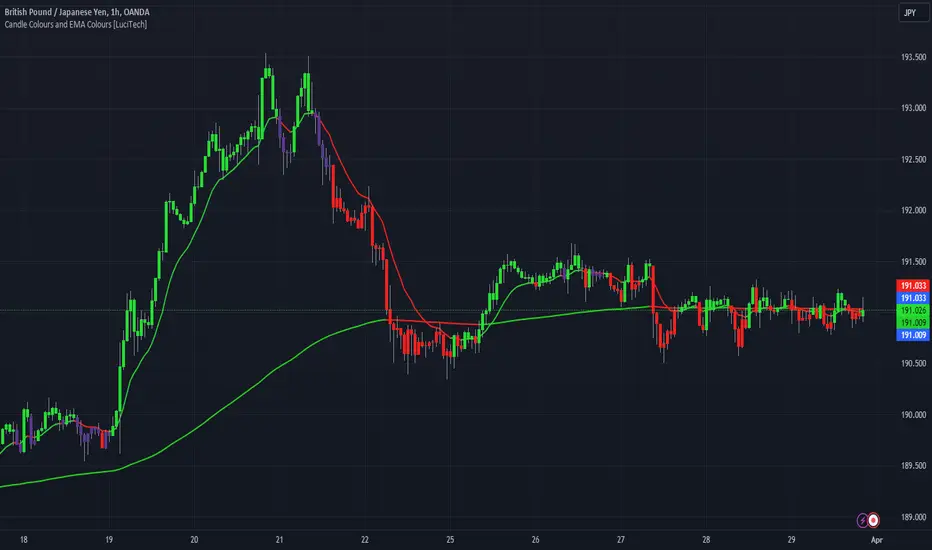
Candle Colours and EMA Colours [LuciTech]this indicator assigns a colour to each candle based on the relationship between the price and the EMAs, The indicator first checks whether the close price is above or below the first EMA, If the close price is above the first EMA the candle is coloured green. If the close price inbetween both EMAs the candle is colored gray. If the close price is below the second EMA, the candle is coloured red.
the indicator also colours the EMAs based on the closed price, if closed price is above the EMAs its coloured green and if price is closed below the EMA is coloured red.
The colours of the candles and EMAs can be changed in "style" and the periods of the EMAs can be changed in inputs.