TopTenAlg0 1. Sentiment & MomentumEN: Mum Sentiment & Momentum is an indicator that measures the psychological thresholds of the O candle and the rate of change of the price (Rate of Chance / Bar Momentum). Each price action is a separate action with flexibility. Mum Sentiment & Momentum shows you the speed and direction of this price action. If sentiment and momentum are green, the rise will continue, if it is much above momentum sentiment, it indicates the presence of an enthusiastic psychological movement. If sentiment and momentum are red, a correction may come and a decrease is expected, and if momentum is well below sentiment, there is an enthusiastic sale.
This algorithm is prepared with @Top10Algo ... Optimization periods
TR: Mum Sentiment & Momentum her barda ayrı ayrı olmak üzere O muma ait psikolojik eşikleri ve fiyatın değişim hızını ( Rate of Chance / Mum Momentumu ) ölçen bir göstergedir. Her bir fiyat hareketi esnekliği olan ayrı birer aksiyondur. Mum Sentiment & Momentum size bu fiyat aksiyonunun hızını ve yönünün ne olduğunu gösterir. Eğer sentiment ve momentum yeşil ise yükselişin devam edeceğini, momentum sentiment’ in çok üstünde ise coşkulu bir psikolojik hareketin varlığını gösterir. Eğer sentiment ve momentum kırmızı ise düzeltme gelebileceğini ve düşüş beklenildiğini, momentum ise sentiment’in çok altında ise coşkulu bir satış’ ın olduğunu gösterir.
Bu algoritma @Top10Algo ile beraber hazırlanmıştır... Periyotlar optimize edilmiştir.
Elliottwaves_trader

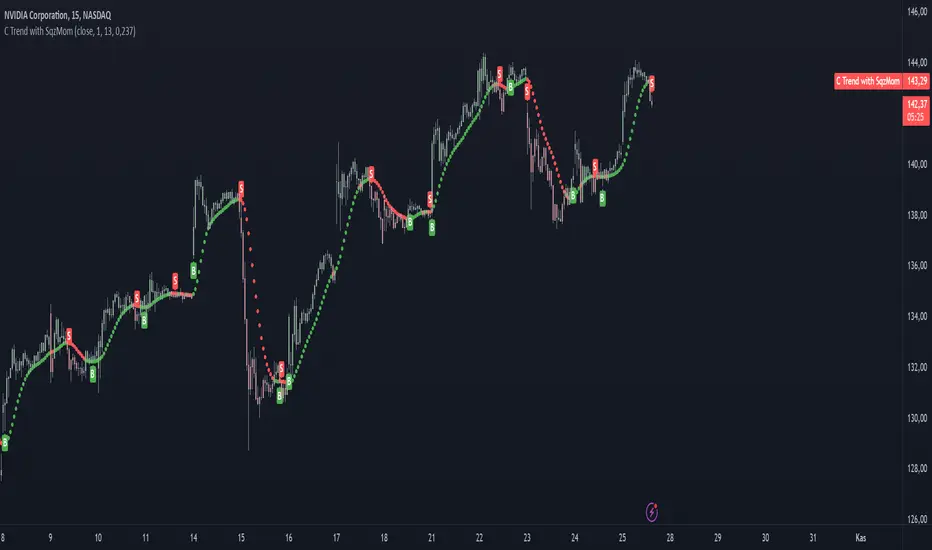
TopTenAlgo 3. Cursor Trend with SQZ MOM(Without Volume Ind.)EN: Indicator Trend is a momentum algorithm that measures the direction of the trend. It recalculates the Volume Weighted Moving Average and Tilson functions included with a certain frequency value according to the closing price and this trend helps us determine trend times. The size of the frequency correction motion. It Looks at the Logarithmic to functions. Is the zigzag of argument correction? otherwise it is a shortcut for a flat / flat correction . You can use the minus frequency value minus in zigzags, while it is handled with lower frequencies in flat or flat corrections . For symbols for which the Volume Indicator cannot be read.
This algorithm is prepared with @Top10Algo ... Improvements have been made regarding short periods.
TR: Gösterge Trend, trendin yönünü ölçen bir momentum algoritmasıdır. İçeriğinde bulunan Volume Weighted Moving Average ve Tilson fonksiyonlarını belli bir frekans değeri ile kapanış fiyatına göre yeniden hesaplar ve bu sayede trend değişim zamanlarını belirlememize yardımcı olur. Frekans değeri düzeltme hareketinin boyutuna göre değişiklik gösterir. Fonsiyonlara Logaritmik bakar.Frekans değerini belirlememizde yardımcı olan argüman düzeltmenin zigzag mı? yoksa yassı/flat bir düzeltmemi olacağını kestirmektir. Zigzaglarda frekans değeri eksi yönde daha fazla büyürken yassı yada flat düzeltmelerde daha düşük frekanslarla ele alınır. Hacim Göstergesinin okunamadığı semboller içindir.
Bu algoritma @Top10Algo ile beraber hazırlanmıştır... Kodlamadaki katkılarından ve yol göstericiliğinden dolayı teşekkürü bir borç bilirim. Kısa Periyotlar için iyileştirmeler yapıldı...

TopTenAlgo 3. Cursor Trend with SQZ MOM (Include Volume Ind.)EN: Indicator Trend is a momentum algorithm that measures the direction of the trend. It recalculates the Volume Weighted Moving Average and Tilson functions included with a certain frequency value according to the closing price and this trend helps us determine trend times. The size of the frequency correction motion. It Looks at the Logarithmic to functions. Is the zigzag of argument correction? otherwise it is a shortcut for a flat / flat correction . You can use the minus frequency value minus in zigzags, while it is handled with lower frequencies in flat or flat corrections .
This algorithm is prepared with @Top10Algo ... Improvements have been made regarding short periods.
TR: Gösterge Trend, trendin yönünü ölçen bir momentum algoritmasıdır. İçeriğinde bulunan Volume Weighted Moving Average ve Tilson fonksiyonlarını belli bir frekans değeri ile kapanış fiyatına göre yeniden hesaplar ve bu sayede trend değişim zamanlarını belirlememize yardımcı olur. Frekans değeri düzeltme hareketinin boyutuna göre değişiklik gösterir. Fonsiyonlara Logaritmik bakar.Frekans değerini belirlememizde yardımcı olan argüman düzeltmenin zigzag mı? yoksa yassı/flat bir düzeltmemi olacağını kestirmektir. Zigzaglarda frekans değeri eksi yönde daha fazla büyürken yassı yada flat düzeltmelerde daha düşük frekanslarla ele alınır.
Bu algoritma @Top10Algo ile beraber hazırlanmıştır... Kodlamadaki katkılarından ve yol göstericiliğinden dolayı teşekkürü bir borç bilirim. Kısa Periyotlar için iyileştirmeler yapıldı...
TopTenAlgo 4. Trend Velocity & Quality with Missmatch AlertEN: The Trend Velocity & Quality oscillator, in addition to a classic Rsi indicator, precisely measures the speed and quality of the trend. Rsi is actually a tense indicator that makes technical analysis difficult. For this reason, it makes it difficult for you to get false signals and trade the trend by not being able to analyze the direction of the trend clearly. The Rsi Trend Velocity & Quality oscillator produces more meaningful thresholds with the functions it contains, showing tighter postures that are not tense. It also causes Rsi to move faster without fear of distortion due to excessive noise, causing you to receive signals earlier. In short, it is a smoother oscillator that produces tighter postures, better thresholds, a faster Rsi and early signals.
This algorithm is prepared with @Top10Algo ... Add Mismatch Alerts
TR: Trend Velocity & Quality osilatörü klasik bir Rsi indikatörüne ek olarak trendin hızını ve kalitesini hassas bir biçimde ölçer. Rsi aslında teknik analizi zorlaştıran gergin bir indikatördür. Bu sebeple yanlış sinyaller almanıza ve trendin yönünü net analiz edememenize sebep olarak trade etmenizi zorlaştırır. Rsi Trend Velocity & Quality osilatörü içerdiği fonksiyonlar ile gergin olmayan daha sıkı duruşlar sergileyerek daha anlamlı eşikler üretir. Ayrıca aşırı gürültüye bağlı bozulma korkusu olmadan Rsi’ ın daha hızlı hareket etmesine sebep olarak daha erken sinyal almanıza vesile olur. Yani özetle daha sıkı duruşlar, daha iyi eşikler, daha hızlı bir Rsi ve erken sinyaller üreten pürüzsüz bir osilatördür.
Bu algoritma @Top10Algo ile beraber hazırlanmıştır... Uyumsuzluk Uyarıları ve Alarmları Eklendi...

TopTenAlgo 5. Missmatch OscillatorEN: The Incompatibility Oscillator is an indicator used to detect trend turns and to catch mismatches in rising or falling waves. The Incompatibility Oscillator measures the mismatch between artificial pricing and actual price with a trend in the market compared to a Center Of Gravity . When designing the oscillator, my goal was to catch positive or negative mismatches as in RSI . Because most of the RSI incompatibilities are not working or running late, especially on short term charts. My goal was to eliminate the illusion here. I do not use any predefined indicators ( RSI etc.) in the Incompatibility Osilautre. It consists of a multiline mathematical function that scans the oscillator price movement in 100 steps. The aim here is to measure the price and the speed of the trend at the same time and catch the mismatches at the end of the trend.
This algorithm is prepared with @Top10Algo ...
TR: Uyumsuzluk Osilatörü trend dönüşlerini tespit etmek için ve yükseliş yada düşüş dalgalarındaki uyumsuzlukları yakalamak için kullanılan bir göstergedir. Uyumsuzluk Osilatörü piyasada trendle birlikte oluşa yapay fiyatlama ile gerçek fiyat arasındaki uyumsuzluğu bir ağırlık merkezine göre(Center Of Gravity ) ölçer. Osilatörü tasarlarken amacım RSI’ daki gibi pozitif yada negatif uyumsuzlukları yakalamaktı. Çünkü RSI uyumsuzlukların çoğu özelliklede kısa vade grafiklerde ya çalışmıyor yada geç çalışıyor. Amacım burdaki yanılgıyı ortadan kaldırmaktı. Uyumsuzluk Osilaötründe herhangi bir ön tanımlı gösterge( RSI vs.) kullanmıyorum. Osilatör fiyat hareketini 100 adımda tarayan bir multiline matemetiksel fonksiyondan oluşuyor. Burada amaç fiyat ile trendin hızını aynı anda ölçmek ve trend sonlarındaki uyumsuzlukları yakalamaktır.
Bu algoritma @Top10Algo ile beraber hazırlanmıştır...

TopTenAlgo 6. Trading IndexEN: Trend & Trading Index Oscillator is an indicator developed using Stochastic which makes your day trading easier. Is it to measure price swings with a more sensitive and close to zero error margin, and is the price movement and the direction of the trend compatible? is the ideal guide to look at. The oscillator consists of a 5 step system. Depressions below -0.85 are measured to determine the intake region (Lowlander 2) at the bottom of the step. At the top of the step, enthusiastic movements above 0.90 are detected to determine the sales region(Highlander 2). The buffer zone is the BALANCE "0" zone and its highlander "0. 40 zone close to enthusiasm, and the Lowlander "-0.50" zone close to depression.
This algorithm is prepared with @Top10Algo ... Study modify...
TR: Trend & Trading Index Osiatörü Stochastic kullanırak geliştirilen ve gün içi al satlarınızı kolaylaştıran bir göstergedir. Fiyat salınımlarını daha hassas ve sıfıra yakın bir hatalama payıyla ölçmek ve fiyat hareketi ile trendin yönü uyumlu mu? bakmak için en ideal yol göstericidir. Osilatör 5 basamaklı bir sistemden oluşmaktadır. Basamağın en altında alım bögesini belirlemek için -0.85 değerinin altındaki depresyonlar(Lowlander 2) ölçülür. Basamağın en üstünde ise satış bölgesini belirlemek için 0.90 değerinin üstündeki coşkulu hareketler (Highlander 2) tespit edilir. Ara bölge ise BALANCE “0” bögesi ve onun coşkuya yakın Highlander 1 “0.40" bölgesi ile depresyona yakın Lowlander 1 “-0.50" bölgesi yer alır.
Bu algoritma @Top10Algo ile beraber hazırlanmıştır... Çalışma Prensipleri modifiye edildi...

TopTenAlgo 7. Linear Trend Tracking (Without Volume & Coloring)EN:
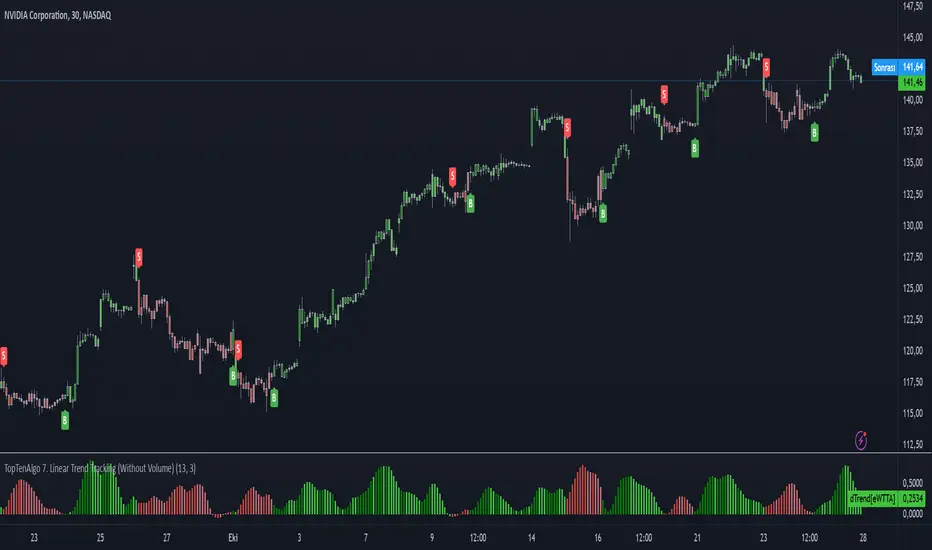
Dogrusal Trend Takipcisi is used in conjunction with Gosterge Trend. Both indicators are for approval of each other. While the Indicator looks at Logarithmic to prices, It looks at Linear. Although its mathematical function is stuck between two trend lines like Gösterge Trend, the Dogrusal Trend Takipcisi can also be used as the main histogram, the absolute value of the difference between the trend and the down trend line .
If the uptrend line is larger than the downtrend, histogram bars are light green or dark green areas. When the bullish trend line now crosses the down trend line , the bar is dark green. When the up trend line is larger than the down trend line and the up trend line increases, the bars also become dark green. This tendency starts to keep getting stronger. If the bullish trend line is larger than the bearish trend line but decreases, the bars are light green. This is when the bullish trend loses strength, So, Uptrend is weakening.
If the downtrend line is larger than the bullish trend line , a negative occur, and the bars become red or light red. If the bearish trend line has exceeded the bullish trend line or the value is increasing, the bar is in red. If the bearish trend line is larger than the bullish trend line but the value is decreasing, the bars are light red. This comes when the downward trend is losing power. So, Downtrend is weakening. For symbols for which the Volume Indicator cannot be read.
This algorithm is prepared with @Top10Algo ...
TR: Doğrusal Trend Takipçisi Gösterge Trendle ile beraber kullanılır. Her iki göstergede birbirinin onayını almak içindir. Gösterge Trend fiyatlara logaritmik bakarken, Doğrusal Tren Takipçisi Linear bakar. Matematiksel fonsiyonu Gösterge Trend gibi iki trend çizgisi arasına sıkışmış olsada Doğrusal Trend Takipçisi ayrıca ana histogram olarak gösterilen yukarı trend ve aşağı trend çizgisi arasındaki farkın mutlak değerini linear olarak hesaplayarak momentumun gücünü ölçer ve size zayıflayan trendleri haber eder.gösterir.
Yukarı trend çizgisi aşağı trendden büyükse (bu nedenle pozitif hareketi gösterir), histogram çubukları açık yeşil veya koyu yeşil olacaktır. Artış trendi çizgisi şimdi aşağı trend çizgisini geçtiğinde, çubuk koyu yeşil olacaktır. Yukarı trend çizgisi aşağı trend çizgisinden daha büyük olduğunda ve yukarı trend çizgisi arttığında çubuklar da koyu yeşil olur. Bu eğilimin güçlenmeye devam ettiği anlamına geliyor. Yükseliş trendi çizgisi düşüş trendi çizgisinden büyükse ancak azalıyorsa, çubuklar açık yeşil olacaktır. Bu yükseliş eğiliminin güç kaybettiği anlamına gelir.Yani yükseliş trendi zayıflıyordur.
Düşüş trendi çizgisi yükseliş trendi çizgisinden büyükse, olumsuz bir eğilim oluşur ve çubuklar kırmızı veya açık kırmızı olur. Düşüş trendi çizgisi yükseliş trendi çizgisini aştıysa veya değer artıyorsa, çubuk kırmızı olacaktır. Düşüş trendi çizgisi yükseliş trendi çizgisinden büyükse, ancak değer azalıyorsa, çubuklar açık kırmızı olacaktır. Bu düşüş eğiliminin güç kaybettiği anlamına gelir. Yani düşüş trendi zayıflıyordur. Hacim Göstergesinin okunamadığı semboller içindir.
Bu algoritma @Top10Algo ile beraber hazırlanmıştır...
TopTenAlgo 7. Linear Trend Tracking (Include Volume & Coloring)EN:
Dogrusal Trend Takipcisi is used in conjunction with Gosterge Trend. Both indicators are for approval of each other. While the Indicator looks at Logarithmic to prices, It looks at Linear. Although its mathematical function is stuck between two trend lines like Gösterge Trend, the Dogrusal Trend Takipcisi can also be used as the main histogram, the absolute value of the difference between the trend and the down trend line .
If the uptrend line is larger than the downtrend, histogram bars are light green or dark green areas. When the bullish trend line now crosses the down trend line , the bar is dark green. When the up trend line is larger than the down trend line and the up trend line increases, the bars also become dark green. This tendency starts to keep getting stronger. If the bullish trend line is larger than the bearish trend line but decreases, the bars are light green. This is when the bullish trend loses strength, So, Uptrend is weakening.
If the downtrend line is larger than the bullish trend line , a negative occur, and the bars become red or light red. If the bearish trend line has exceeded the bullish trend line or the value is increasing, the bar is in red. If the bearish trend line is larger than the bullish trend line but the value is decreasing, the bars are light red. This comes when the downward trend is losing power. So, Downtrend is weakening.
This algorithm is prepared with @Top10Algo ...
TR: Doğrusal Trend Takipçisi Gösterge Trendle ile beraber kullanılır. Her iki göstergede birbirinin onayını almak içindir. Gösterge Trend fiyatlara logaritmik bakarken, Doğrusal Tren Takipçisi Linear bakar. Matematiksel fonsiyonu Gösterge Trend gibi iki trend çizgisi arasına sıkışmış olsada Doğrusal Trend Takipçisi ayrıca ana histogram olarak gösterilen yukarı trend ve aşağı trend çizgisi arasındaki farkın mutlak değerini linear olarak hesaplayarak momentumun gücünü ölçer ve size zayıflayan trendleri haber eder.gösterir.
Yukarı trend çizgisi aşağı trendden büyükse (bu nedenle pozitif hareketi gösterir), histogram çubukları açık yeşil veya koyu yeşil olacaktır. Artış trendi çizgisi şimdi aşağı trend çizgisini geçtiğinde, çubuk koyu yeşil olacaktır. Yukarı trend çizgisi aşağı trend çizgisinden daha büyük olduğunda ve yukarı trend çizgisi arttığında çubuklar da koyu yeşil olur. Bu eğilimin güçlenmeye devam ettiği anlamına geliyor. Yükseliş trendi çizgisi düşüş trendi çizgisinden büyükse ancak azalıyorsa, çubuklar açık yeşil olacaktır. Bu yükseliş eğiliminin güç kaybettiği anlamına gelir.Yani yükseliş trendi zayıflıyordur.
Düşüş trendi çizgisi yükseliş trendi çizgisinden büyükse, olumsuz bir eğilim oluşur ve çubuklar kırmızı veya açık kırmızı olur. Düşüş trendi çizgisi yükseliş trendi çizgisini aştıysa veya değer artıyorsa, çubuk kırmızı olacaktır. Düşüş trendi çizgisi yükseliş trendi çizgisinden büyükse, ancak değer azalıyorsa, çubuklar açık kırmızı olacaktır. Bu düşüş eğiliminin güç kaybettiği anlamına gelir. Yani düşüş trendi zayıflıyordur.
Bu algoritma @Top10Algo ile beraber hazırlanmıştır...

TopTenAlgo 8. Elliottwave Cycle EN: The Elliottwaves Cycle Oscillator is an indicator that allows the detection of impulsive (impulsive / ascend) or corrective (correction / fall) waves, ie each cycle (cycle) in Elliott Waves . The aim is to measure the speed of a real trend and to predict returns. In the uptrend or impulsive movement, Cycle continues its movement in the upper band after the price is set on a certain band, while in the downtrend or corrective move, the Cycle continues its movement in the lower band.
This algorithm is prepared with @Top10Algo ...
TR: Elliottwaves Cycle Osilatörü Elliott Dalgalarında ki impulsive (itkisel/yükseliş) yada corrective (düzeltme/düşüş) dalgaların yani her bir siklus’ un (cycle) önceden tespit edilmesini sağlayan bir göstergedir. Amaç gerçek bir trendin hızını ölçmek ve geri dönüşleri önceden tespit etmektir. Yükseliş trendi içinde yada impulsive bir harekette fiyat belli bir banda oturduktan sonra Cycle üst band’ da hareketine devam ederken, düşüş trendi içinde yada corrective bir harekette fiyat belli bir banda oturduktan sonra Cycle alt bandda hareketine devam eder.
Bu algoritma @Top10Algo ile beraber hazırlanmıştır...

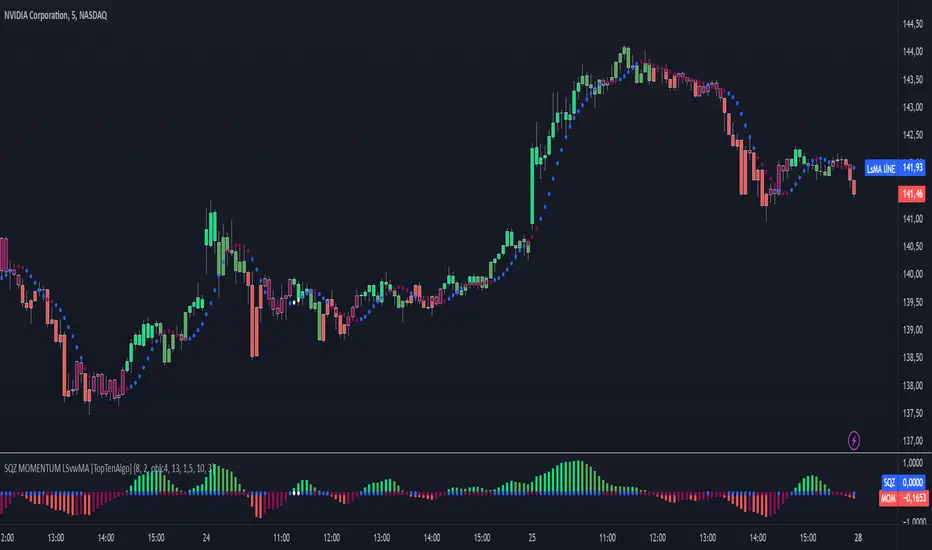
TopTenAlgo 10. SQZMOM_LSvwMA with Bar ColorEN: This Algorithm is a derivative of John Carter's "TTM Squeeze" volatility indicator. Many strategists have taken the indicator on Tradingview with simple moving averages and have looked at the biggest mistake only by dealing with squeeze and exit processes to squeeze. But I used the algorithm to determine where the markets would actually explode. For example, instead of using SMAs , I tested them on the Linear Regression Curve using Volume Weighted Moving Averages and Hull MAs. This gave me the opportunity to develop a more responsive algorithm and identify where the actual explosion would occur. The Gray Circles in the midline show that the market is entering a new jam (in the Bollinger Bands and Keltner Channel). This means low volatility , the market prepares itself for an explosive move (up or down). White Circles mean that it is about to get out of the jam. The Blue Circles, which no one can calculate, now inform that the exit is no longer jammed and that the explosion has taken place.
Mr. Carter recommends that you wait until the first gray after a gray cross and take a position in the momentum direction (for example, if the momentum value is above zero, relax). Exit position when the momentum changes (increase or decrease, this is indicated by a color change). In this algorithm, I tried to achieve good entry points using an additional indicator such as ADX and WaveTrend. To draw the histogram, I used a different method based on Linear Regression . Mr.Carter uses a simple momentum indicator .
In summary, this algorithm is a strict algorithm in which additional 4-5 indicators are blended. Conveniences for Everyone ...
This algorithm is prepared with @Top10Algo ...
TR: Bu Algoritma John Carter'ın "TTM Squeeze" volatilite göstergesinin bir türevidir. Bir çok stratejist Tradingview' de gösterge' yi basit hareketli ortalamalarla ele almış ve en büyük hatayı sadece sıkışma ve sıkışmadan çıkış süreçlerini ele alarak bakmışlardır. Fakat ben algoritmayı piyasaların asıl patlama yapacağı yeri tespit etmek için kullandım. Örneğin SMA' ları kullanmak yerine Hacim Ağırlıklı Hareketli Ortalamaları ve Hull MA' ları kullanarak onları Linerar Regresyon Eğrisinde stress testine tabi tuttum. Buda bana daha duyarlı bir algoritma geliştirmem ve asıl patlamanın olacağı yerleri tespit etmem için fırsat verdi. Orta hattaki Gri Daireler, piyasanın yeni bir sıkışmaya girdiğini gösteriyor ( Bollinger Bantları ve Keltner Kanalı'nda). Bu, düşük volatilite anlamına gelir, piyasa kendisini patlayıcı bir harekete hazırlar (yukarı veya aşağı). Beyaz Daireler ise sıkışmadan çıkmak üzere olduğu anlamına gelir. Hiç kimsenin hesap edemediği Mavi Daireler ise artık sıkışmadan çıkıldığını ve patlamanın gerçekleştiğini haber verir.
Mr.Carter, gri bir çarpı işaretinden sonra ilk griye kadar beklemenizi ve momentum yönünde bir pozisyon almanızı önerir (örneğin, momentum değeri sıfırın üstünde ise, rahat olun). Momentum değiştiğinde pozisyondan çıkın (artırma veya azaltma, bunu o bir renk değişikliği ile belirtilir). Bu algoritmada ben, ADX ve WaveTrend gibi ek bir gösterge kullanarak iyi giriş noktalarıelde etmeye çalıştım. Histogramı çizmek için ise Linear Regresyon tabanlı farklı bir yöntem kullandım. Mr.Carter basit bir momentum göstergesi kullanır.
Özetle bu algoritma ek 4-5 göstergenin harmanlandığı sıkı bir algoritmadır. Herkese Kolaylıklar dilerim...
Bu algoritma @Top10Algo ile beraber hazırlanmıştır... Kodlamadaki katkılarından ve yol göstericiliğinden dolayı teşekkürü bir borç bilirim.
TopTenAlgo 10. SQZMOM_LSvwMA with Bar Color (Not Based Volume)EN: This Algorithm is a derivative of John Carter's "TTM Squeeze" volatility indicator. Many strategists have taken the indicator on Tradingview with simple moving averages and have looked at the biggest mistake only by dealing with squeeze and exit processes to squeeze. But I used the algorithm to determine where the markets would actually explode. For example, instead of using SMAs , I tested them on the Linear Regression Curve using Volume Weighted Moving Averages and Hull MAs. This gave me the opportunity to develop a more responsive algorithm and identify where the actual explosion would occur. The Gray Circles in the midline show that the market is entering a new jam (in the Bollinger Bands and Keltner Channel). This means low volatility , the market prepares itself for an explosive move (up or down). White Circles mean that it is about to get out of the jam. The Blue Circles, which no one can calculate, now inform that the exit is no longer jammed and that the explosion has taken place.
Mr. Carter recommends that you wait until the first gray after a gray cross and take a position in the momentum direction (for example, if the momentum value is above zero, relax). Exit position when the momentum changes (increase or decrease, this is indicated by a color change). In this algorithm, I tried to achieve good entry points using an additional indicator such as ADX and WaveTrend. To draw the histogram, I used a different method based on Linear Regression . Mr.Carter uses a simple momentum indicator .
In summary, this algorithm is a strict algorithm in which additional 4-5 indicators are blended. Conveniences for Everyone ... (For Symbols that cannot be read on the Volume Indicator)
This algorithm is prepared with @Top10Algo ...
TR: Bu Algoritma John Carter'ın "TTM Squeeze" volatilite göstergesinin bir türevidir. Bir çok stratejist Tradingview' de gösterge' yi basit hareketli ortalamalarla ele almış ve en büyük hatayı sadece sıkışma ve sıkışmadan çıkış süreçlerini ele alarak bakmışlardır. Fakat ben algoritmayı piyasaların asıl patlama yapacağı yeri tespit etmek için kullandım. Örneğin SMA' ları kullanmak yerine Hacim Ağırlıklı Hareketli Ortalamaları ve Hull MA' ları kullanarak onları Linerar Regresyon Eğrisinde stress testine tabi tuttum. Buda bana daha duyarlı bir algoritma geliştirmem ve asıl patlamanın olacağı yerleri tespit etmem için fırsat verdi. Orta hattaki Gri Daireler, piyasanın yeni bir sıkışmaya girdiğini gösteriyor ( Bollinger Bantları ve Keltner Kanalı'nda). Bu, düşük volatilite anlamına gelir, piyasa kendisini patlayıcı bir harekete hazırlar (yukarı veya aşağı). Beyaz Daireler ise sıkışmadan çıkmak üzere olduğu anlamına gelir. Hiç kimsenin hesap edemediği Mavi Daireler ise artık sıkışmadan çıkıldığını ve patlamanın gerçekleştiğini haber verir.
Mr.Carter, gri bir çarpı işaretinden sonra ilk griye kadar beklemenizi ve momentum yönünde bir pozisyon almanızı önerir (örneğin, momentum değeri sıfırın üstünde ise, rahat olun). Momentum değiştiğinde pozisyondan çıkın (artırma veya azaltma, bunu o bir renk değişikliği ile belirtilir). Bu algoritmada ben, ADX ve WaveTrend gibi ek bir gösterge kullanarak iyi giriş noktalarıelde etmeye çalıştım. Histogramı çizmek için ise Linear Regresyon tabanlı farklı bir yöntem kullandım. Mr.Carter basit bir momentum göstergesi kullanır.
Özetle bu algoritma ek 4-5 göstergenin harmanlandığı sıkı bir algoritmadır. Herkese Kolaylıklar dilerim... (Hacim Göstergesi okunamayan Semboller için)
Bu algoritma @Top10Algo ile beraber hazırlanmıştır...
