GME Warrant Tracker [theUltimator5]The GME Warrant Tracker was designed to be used for GME warrants tracking. The theory behind this indicator is that warrants are priced similarly to options and generally follow the same Greeks. With that assumption, we can break down the price of the warrants by using known Greeks to estimate either the theoretical price, or even estimate Implied Volatility (IV).
The base settings for this indicator plot the calculated IV, the theoretical price (there are multiple methods of calculation which I will discuss later) and the current warrant price.
You can toggle on or off all of these plots to display only what you want to track.
For example, you can simply track the difference between the theoretical price and the current price to see if warrants are trading at a premium or a discount vs what the indicator calculates it to be.
Calculating implied volatility is extremely difficult and must be approximated.
The theoretical warrant price produced by this indicator depends primarily on the volatility input (σ) used in the Black–Scholes pricing model.
This script supports five distinct methods for approximating σ, each extracting different information from the market.
1) Close-to-Close Historical Volatility
Close-to-Close computes the standard deviation of daily close-to-close returns and uses a lookback window scaled to time-to-expiry. As the expiration approaches, the lookback window tightens, giving a more responsive volatility approximation relative to time-to-expiry.
This option produces conservative approximations for volatility, and may lag actual volatility intraday.
2) Parkinson High-Low Volatility
Parkinson High-Low volatility uses daily high and low prices to calculate intraday trading range for a more responsive estimation to volatility. It ignores opening and close gaps, so overnight volatility is not accounted for.
This option produces higher theoretical volatility during choppy price action and can over estimate actual volatility.
3) Garman–Klass Volatility
Garman–Klass volatility is a way to estimate how much price is fluctuating by using the open, high, low, and close for each period. Because it draws on multiple intraperiod price points (not just the range or close-to-close moves), it typically produces a tighter, more informative volatility estimate than simpler approaches. It’s often most helpful when gaps occur and when the open and close carry meaningful information about the session’s trading.
4)Yang–Zhang Volatility
The Yang–Zhang volatility estimator is designed to account for both opening jumps and price drift. It estimates volatility by combining overnight (close-to-open) variance, intraday (open-to-close) variance, and a weighted Rogers–Satchell component using OHLC data, often yielding a more robust measure than simpler close-to-close style estimators.
5) Option price
By default, the indicator uses the call option strike dated closest to the warrant expiration date. Since the Greeks for both the warrants and the
options are assumed to be equivalent with a minor difference in theta (time-to-expiry), the theoretical price of the warrants closely matches the trade price of the call strike chosen.
There is a table that can be enabled (off by default because it is large and fills entire screen on mobile) which shows all the configuration settings and Greeks.
You can also manually adjust the "dilution" factor for the warrants, which shifts the number of active warrants and moves the count into the shares outstanding for the underlying (GME). The reason for this is that as warrants get exercised, the total quantity of warrants in circulation decreases and the the total quantity of shares outstanding increases.
Since this indicator was built around the single warrant, ticker NYSE: GME/W, it is only meant to be used with NYSE:GME. Any other ticker will not work properly with this indicator.
Educational

Adaptive Trend-Based Fib Extension + TrendlinesThis advanced analysis tool is designed to take the guesswork out of Fibonacci trading. By combining Adaptive Fibonacci Extensions with multi-method Pivot Detection, Dynamic Trendlines, and Horizontal Support/Resistance, this indicator provides a comprehensive roadmap for any market trend.
Learn volume trading - @pricevolumetraders
Key Features
Adaptive Fibonacci Engine: Unlike static tools, this indicator uses an ATR-based adaptive factor to adjust extension levels according to current market volatility.
Smart Trend Detection: Automatically identifies trend direction using EMA cross-overs or Higher High/Higher Low sequences to determine whether to plot Bullish or Bearish extensions.
Multi-Method Pivots: Choose from six different pivot detection methods, including Volume-Based, Fractal, ATR-Based, and Long Wick detection, to suit your specific trading style.
Automated Trendlines & S/R: High-probability diagonal trendlines and horizontal S/R levels are drawn only when they meet a minimum "touch" requirement and volume confirmation.
Institutional Zones: Highlights the "Golden Zone" between the 127.2% and 161.8% extension levels, where trends often reach exhaustion or find major targets.
How to Use
Trend Alignment: Use the built-in Dashboard to quickly identify the current trend (Bull/Bear) and RSI momentum.
The 3-Point Setup: The indicator automatically finds Point 1 (Trend Start), Point 2 (Impulse End), and Point 3 (Retracement/Last Touch) to project future price targets.
Entry Confirmation: Look for price action near the 61.8% or 78.6% Retracement levels for high-probability entries in the direction of the trend.
Targeting: Use the extension levels (100%, 127.2%, 161.8%) as your primary Take Profit zones.
Confluence: The strongest setups occur when a Fibonacci level aligns perfectly with a Horizontal S/R line or a Diagonal Trendline.
Technical Settings
Pivot Settings: Adjust 'Left' and 'Right' bars to change the sensitivity of swing high/low detection.
Fib Timeframe: You can anchor Fibonacci levels to a higher timeframe (e.g., 1-hour levels) while trading on a lower timeframe (e.g., 5-minute).
Volume Multiplier: Filter for horizontal levels that were formed with significant institutional volume.
Disclaimer: Trading involves significant risk. This tool is for educational and analytical purposes only and should be used in conjunction with a complete trading plan.

Druckenmiller Alpha-Physics [Dual-Core]Stop trading in a vacuum. Start trading like a Macro Fund Manager.
The Druckenmiller Alpha-Physics engine is a professional-grade dashboard designed to solve the single biggest problem in trading: Context. Most traders buy a "dip" only to realize it was a crash, or sell a "rip" only to watch it fly higher.
This tool solves this by synthesizing Market Physics (Velocity & Acceleration) across two distinct timeframes (Weekly Macro & Daily Tactical) and filtering every signal through a Global Liquidity Shield.
It is engineered based on the trading philosophy of Stanley Druckenmiller: “I don’t care about the news. I care about the liquidity and the acceleration of the trend.”
How It Works (The Dual-Core Logic)
The engine runs 27 distinct sector assets through a dual-loop physics processor:
The Macro Core (Weekly): Analyzes the 18-month trend. Is the "Tide" coming in or going out?
The Tactical Core (Daily): Analyzes the 3-day price action. Is the "Wave" crashing or rising?
It then synthesizes these two data streams into a single Action Signal.
The Signals (How to Read)
The dashboard tells you exactly what to do based on the conflict between Macro and Micro:
🟢 BUY PULLBACK (The "Alpha" Trade):
Logic: Macro is RIPPING (Bullish) + Tactical is TOP/CRASH (Bearish).
Meaning: You are buying a long-term leader on a short-term discount.
🔵 STINK BID (The "Bottom" Trade):
Logic: Macro is TURNING UP + Tactical is CRASHING.
Meaning: The physics have shifted positive, but price is still dumping. Place limit orders -5% lower to catch the panic bottom.
🔴 SELL RIP (The "Trap" Trade):
Logic: Macro is TOPPING (Bearish) + Tactical is RIPPING (Bullish).
Meaning: The long-term trend is dead. Sell into this short-term rally immediately.
⚪ HOLD: All systems go. Sit on your hands and ride the trend.
The "Invisible" Liquidity Shield
The most dangerous time to buy is when the Fed is draining liquidity. This script monitors the 10-Year Treasury Yield (TNX) and VIX in real-time.
If Liquidity is OK (Navy Header): Signals are valid. Green means Go.
If Liquidity is TIGHT (Maroon Header): The entire dashboard enters "Defense Mode." Buy signals are tinted Maroon to warn you that you are fighting the Fed.
Included Universe (The "Ultimate" List)
Includes 27 institutional-grade tickers covering every corner of the market:
Growth: XLK, SMH, IGV, GRID, QTUM
Cyclical: JETS, XHB, KRE, XLI, XLF
Commodities: GDX, URA, XLE, XLB, TAN
Risk/Safety: IBIT, TLT, XLV, XLP
Note: This script uses dynamic request handling optimized for Pine Script v6. It is designed for Premium/Ultimate plans due to the high volume of data processing (54+ simultaneous streams).

krishnadeshmukh/NIFTY50 Micro Sentiment Part 1📘 Script Description: NIFTY50 Micro Sentiment — Part 1
This indicator tracks real-time micro sentiment across the top 25 weighted stocks of the NIFTY50 index using a volume-based distribution model.
🔍 How it works:
Scans last N bars (configurable) for each stock.
Divides each stock’s price range into equal bins.
Measures bullish vs bearish volume in each bin based on:
Candle Color (Close > Open) or
Close Near High (Close > Midpoint).
Assigns a sentiment value:
+1 → Bullish dominance
-1 → Bearish dominance
0 → Neutral
📊 Each stock's sentiment is weighted by its contribution to the index.
🧮 Displays:
Weighted Sentiment Score
Bullish / Bearish / Neutral Components
Updated every 5 bars with an easy-to-read table.
Use this to gauge underlying micro shifts in sentiment before broader market moves.
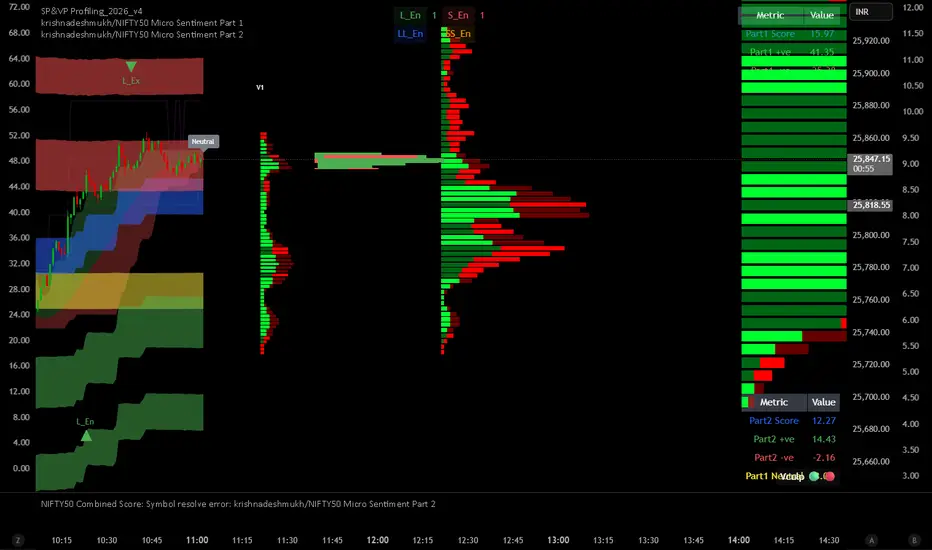
krishnadeshmukh/NIFTY50 Micro Sentiment Part 2📘 Script Description: NIFTY50 Micro Sentiment — Part 2
This indicator continues the NIFTY50 Micro Sentiment model by analyzing the remaining 25 stocks (Rank 26–50 by index weight) of the NIFTY50.
🔍 Key Features:
Applies the same volume-bin methodology used in Part 1.
Sentiment detection based on:
Candle Color (default) or
*Close vs Midpoint of the candle range.
Stocks are weighted by their index influence.
Output is a clean sentiment table:
+ve / -ve / Neutral Volume Score
Weighted Sentiment Output
Use this in conjunction with Part 1 to analyze the entire NIFTY50 sentiment landscape.
📘 Script Description: NIFTY50 Combined Score
This script aggregates live sentiment data from both:
🧩 NIFTY50 Micro Sentiment — Part 1
🧩 NIFTY50 Micro Sentiment — Part 2
🚀 What it does:
Imports Score, +ve, -ve, and Neutral components from both scripts.
Combines them to produce:
✅ Total Weighted Sentiment
🟢 Bullish Weight
🔴 Bearish Weight
🟡 Neutral Component
📊 Outputs are shown via a middle-right sentiment table, updated every 5 bars.
Perfect for traders seeking a unified view of micro sentiment across the entire NIFTY50 ecosystem — in one glance.

Triple Supertrend + EMA CrossoverCustomized 3 supertrend and EMA crossover which is helpful for identification of the trend.

krishnadeshmukh/NIFTY50 Micro Sentiment Part 1📘 Script Description: NIFTY50 Micro Sentiment — Part 1
This indicator tracks real-time micro sentiment across the top 25 weighted stocks of the NIFTY50 index using a volume-based distribution model.
🔍 How it works:
Scans last N bars (configurable) for each stock.
Divides each stock’s price range into equal bins.
Measures bullish vs bearish volume in each bin based on:
Candle Color (Close > Open) or
Close Near High (Close > Midpoint).
Assigns a sentiment value:
+1 → Bullish dominance
-1 → Bearish dominance
0 → Neutral
📊 Each stock's sentiment is weighted by its contribution to the index.
🧮 Displays:
Weighted Sentiment Score
Bullish / Bearish / Neutral Components
Updated every 5 bars with an easy-to-read table.
Use this to gauge underlying micro shifts in sentiment before broader market moves.

A program written by a beginner# TXF Choppy Market Detector (Whipsaw Filter)
## Introduction
This project is a technical indicator developed in **Pine Script v5**, specifically optimized for **Taiwan Index Futures (TXF)** intraday trading.
The TXF market is known for its frequent periods of low-volatility consolidation following sharp moves, often resulting in "whipsaws" (double-loss scenarios for trend followers). This script utilizes **volatility analysis** and **trend efficiency metrics** to filter out noise and detect potential "Stop Hunting" or "Liquidity Sweep" setups within range-bound markets.
## Methodology & Algorithms
The strategy operates on the principle of **Mean Reversion**, combining two core components:
### 1. Market Regime Filter: Choppiness Index (CHOP)
We use the Choppiness Index (originally developed by E.W. Dreiss) to determine if the market is trending or consolidating based on **Fractal Dimension** theory.
* **Logic**:
The index ranges from 0 to 100. Higher values indicate low trend efficiency (consolidation), while lower values indicate strong directional trends.
* **Condition**: `CHOP > Threshold` (Default: 50).
* **Application**: When this condition is met, the background turns **gray**, signaling a "No-Trade Zone" for trend strategies and activating the Mean Reversion logic.
### 2. Whipsaw Detection: Bollinger Bands
Bollinger Bands are used to define the dynamic statistical extremities of price action.
* **Logic**:
We identify **Fakeouts** (False Breakouts) that occur specifically during the choppy regime identified above. This is often where institutional traders hunt for liquidity (stops) before reversing the price.
#### Signal Algorithms (Pseudocode)
**A. Bull Trap (Washout High)**
A false upside breakout designed to trap long traders.
```pine
Condition:
1. Is_Choppy == true (Market is sideways)
2. High > Upper_Bollinger_Band (Price pierces the upper band)
3. Close < Upper_Bollinger_Band (Price fails to hold and closes back inside)

Liquidity Sell Signal V2 [StrategyLAB_]Liquidity Sell Signal V2
Liquidity Sell Signal V2 is a TradingView indicator designed to help you spot high-probability Sell setups (reversal / pullback entries) using liquidity concepts around Buy-Side Liquidity (BSL) , combined with a bearish confirmation candle pattern.
OANDA:XAUUSD
This script will:
Automatically detect and plot BSL (Swing High) levels based on your selected Swing Strength.
Visually “fade” levels once price has broken above them.
Print a down triangle when a valid Bearish Liquidity Triangle forms at a qualified BSL area.
How it works
1) Identify Buy-Side Liquidity (BSL)
The indicator detects pivot highs using Swing Strength.
Each pivot high is drawn as a horizontal BSL level, keeping up to Max Buy Side Liquidity (BSL) Levels.
2) Bearish confirmation (Liquidity reaction)
A Sell signal triggers only when a bearish candle structure appears, suggesting strong selling pressure and a potential reversal after a liquidity sweep near/above BSL.
3) Noise filter (Avoid “body-cut” levels)
The script checks whether the BSL level has been repeatedly cut through candle bodies in prior bars.
If the level is considered “dirty” based on olderBodyLookback, it is filtered out to reduce false signals.
How to use
Suggested settings
Swing Strength
Lower (5–8): more levels, faster signals, but more noise.
Higher (12–20): fewer levels, cleaner zones, better for swing.
Max BSL Levels: increase if you want to keep more historical liquidity levels.
Filter lookback older bodies: increase to filter more aggressively (fewer signals, cleaner quality).
Entry idea (example)
Wait for a Sell triangle to appear (signal prints on candle close).
Prefer signals that align with:
a major swing high / key resistance,
clear rejection (wick / bearish reaction),
confluence with HTF supply, trendline, session, etc.
SL/TP idea (example)
SL: above the most recent swing high / above the BSL zone with a safety buffer.
TP: toward imbalance fill, previous lows (SSL), or a fixed RR such as 1:2 / 1:3.
Important notes
This is a probability tool, not a guaranteed signal.
Best results come from combining with market structure (BOS/CHOCH), supply/demand, HTF levels, and session context.
The script uses barstate.isconfirmed, so signals appear only after the candle closes (non-repainting signals).
OANDA:EURUSD

History Trading SessionsThis indicator helps visually structure the trading day by highlighting custom time zones on the chart.
It is designed for historical analysis, trading discipline, and clear separation between analysis time, active trading, and no-trade periods.
Recommended to use on 4h and below time frames.

First Presented FVGSummary: First Presented FVG Indicator
This is a Pine Script v6 TradingView indicator that identifies and visualizes the first Fair Value Gap (FVG) that forms within configurable time windows during a trading session.
What it Does
1. Detects FVGs : Uses the classic 3-candle FVG definition:
- Bullish FVG: When low > high (gap up)
- Bearish FVG: When high < low (gap down)
2. "First Presented" Logic : For each configured time slot, it captures only the first qualifying FVG that forms—subsequent FVGs in that window are ignored.
3. Visual Display :
- Draws a colored box spanning from detection time to session end
- Optional text label showing detection time (e.g., "9:38 Tue FP FVG")
- Optional grade lines at 25%, 50%, and 75% levels within the FVG
Key Configuration
Setting Description
Timeframe Only works on 5-minute charts or lower
Timezone IANA timezone for session times (default: America/New_York)
Session Futures trading hours (default: 1800-1715)
Min FVG Size Minimum gap size in ticks to qualify
4 Time Slots Each with enable toggle, time window, and color
Default Time Slots
Slot 1 (enabled): 09:30-10:30 — lime green
Slot 2 (enabled): 13:30-14:30 — blue
Slot 3 (disabled): 13:00-13:30 — teal
Slot 4 (disabled): 14:15-14:45 — fuchsia
Technical Features
Handles cross-midnight sessions correctly
Resets all drawings at each new session
Skips the first bar of each window to ensure valid 3-candle lookback
Clamps slot windows to session boundaries

Zero Lag MACD and EMA 200 with SignalsZero Lag MACD with EMA Filter and Smart Signals
This indicator is an enhanced version of the traditional MACD that uses Zero Lag EMA calculations to provide faster and more responsive signals for scalping and day trading.
Key Features:
🎯 Zero Lag Technology - Uses double-smoothed EMA calculations to eliminate lag and provide earlier signals compared to standard MACD
📊 Clean Visualization - Displays histogram with MACD and Signal lines for clear trend analysis
🔍 Smart Signal Logic - Only shows valid trading signals based on strict conditions:
Buy Signal (Green dot at bottom): Triggers when price is above 200 EMA AND MACD crosses Signal line from below AND crossover occurs below zero line
Sell Signal (Red dot at top): Triggers when price is below 200 EMA AND MACD crosses Signal line from above AND crossover occurs above zero line
🔔 Built-in Alerts - Easy alert setup for both buy and sell signals so you never miss a trading opportunity
📈 200 EMA Filter - Incorporates trend filter to avoid counter-trend trades and improve signal quality
⚙️ Fully Customizable - Adjust all parameters:
Fast EMA Length (default: 12)
Slow EMA Length (default: 26)
Signal Length (default: 9)
EMA Filter Length (default: 200)
How to Use:
-Add the indicator to your chart
-Look for green dots (buy signals) when price is in an uptrend above 200 EMA
-Look for red dots (sell signals) when price is in a downtrend below 200 EMA
-Set up alerts by clicking "Create Alert" and selecting "Buy Signal" or "Sell Signal"
-Use signals in conjunction with your trading strategy and risk management
Best Practices:
-Works best on 1-15 minute timeframes for scalping
-Combine with support/resistance levels for confirmation
-Use proper stop-loss and take-profit levels
-Not all signals will be profitable - use proper risk management
-Signals are filtered to reduce noise and false entries
Color Scheme:
Histogram: Red (bearish) / Cyan (bullish)
MACD Line: Fuchsia/Pink
Signal Line: Lime/Green
Buy Signal: Green dot (bottom)
Sell Signal: Red dot (top)
This indicator is perfect for traders who want a cleaner, faster-responding MACD with built-in trend filtering and clear entry signals. Free to use and customize!
EMA SMA Rhythmic Lite Public V1.1 by SRTEMA SMA Rhythmic Lite Public V1.1 by SRT
A clean, lightweight trend-rhythm engine designed for traders of all levels. Built on a robust combination of EMAs and SMAs, this indicator provides clear directional bias signals while remaining fully non-repainting.
Key Features:
Multi-Timeframe Friendly: Works seamlessly on M1 to Daily (D) charts. MA stacking and signal logic automatically adapt to any timeframe.
Bias Detection: Determines bullish, bearish, or neutral market conditions using a 4-MA stack.
Engulfing Bar (EB) & Long-Tail Body (LTB) Detection: Highlights strong price action setups, filtered by body size and ATR-based thresholds.
Flush Markers: Visual cues showing where price aligns with MA stack for trend confirmation.
Bias Table: Displays current MA bias and presence of LTB on the chart for at-a-glance clarity.
Advanced Alerts:
Flush Alerts: Trigger when MA stack aligns with price, signaling trend continuation.
Combo Alerts: Trigger when EB or LTB appears in alignment with MA bias.
LTB-only Alerts: For monitoring significant price action reversals.
Customizable Visualization: Colors, widths, and visibility of all MAs, labels, and flush dots can be tailored to your preference.
Why Lite?
This is the most lightweight version in the SRT rhythm series, optimized for any timeframe, from scalping to swing trading. Perfect for traders who want a clear bias engine without unnecessary complexity.
If you like this EMA SMA Rhythmic Lite, you may also explore:
▶ H1 Bias Rhythmic Lite Public (Free)
▶ SRT Premium Series
Invite-only advanced indicators with stronger bias enforcement and execution frameworks.

TASC 2026.01 The Reversion Index█ OVERVIEW
This script implements the Reversion Index as presented by John F. Ehlers in the January 2026 edition of the TASC Traders' Tips , "Identifying Peaks And Valleys In Ranging Markets”. This indicator was created to provide timely buy and sell signals for mean reversion strategies.
█ CONCEPTS
Ehlers came up with the idea for the Reversion Index following the development of the "Continuation Index" (featured in the September 2025 edition). While the Continuation Index provides indications for trend onset, continuation, and exhaustion; the Reversion Index serves as its counterpart for mean-reversion trading.
The raw Reversion Index value is calculated as the net change in price normalized to the sum of the absolute value of change in price over the same period; for clarity, it is then smoothed using Ehlers' SuperSmoother.
The Smooth Reversion Index value is led by a "Trigger" line, which is created by smoothing the raw data to half the smoothing period of the smoothed index.
Note: Ehlers suggests the smoothing lengths be left at 8 and 4 (Reversion Index & Trigger). For this reason these lengths are hard-coded in the script but can be easily modified in the code.
█ USAGE
In order to identify peaks and valleys effectively, the "Length" should ideally be set to half of that of the expected cycle of the data. If the expected cycle of your trading data is 20 bars, a 10 bar length should be set.
Note: The Reversion Index is intended to identify peaks and valleys within a cycle, not over a large sample period. Ehlers suggests that this would create an estimation of trend, which is not the goal here.
Once the length is set, peaks and valleys are interpreted as the cross of the "Trigger" and "Smooth" lines.

Math by Thomas SMC Buy and Sell Model📖 DESCRIPTION
This indicator is built on Smart Money Concepts (SMC) and focuses on how institutions actually execute trades.
Instead of predicting direction, it identifies three critical market states:
Acceptance (Sideways / Consolidation)
Liquidity Location (PDH / PDL / Swing High–Low)
Volatility Release (Breakout with intent)
The model waits for price compression (inventory build) near liquidity and triggers trades only when price breaks in the direction of liquidity.
This approach is especially suitable for index option buying, where timing and expansion matter more than prediction.
🧠 CORE LOGIC (SIMPLE EXPLANATION)
1️⃣ Sideways / Acceptance Phase
The indicator detects periods where price accepts value
These zones represent institutional inventory building
Shown as blue boxes on the chart
2️⃣ Liquidity Context
The indicator tracks:
Previous Day High (PDH)
Previous Day Low (PDL)
Swing Highs & Swing Lows
These levels act as liquidity targets for institutional moves.
3️⃣ Buy / Sell Signal
A signal appears only when:
Price breaks out of a sideways box
The breakout is towards liquidity
This avoids:
Random breakouts
Counter-trend trades
Low-probability entries
🟢 BUY SIGNAL RULES
A BUY (CALL) signal is generated when:
A valid sideways box is present
Candle closes above the box high
Liquidity exists above price
PDH or Swing High above
📌 The signal appears after candle close (no repaint).
🔴 SELL SIGNAL RULES
A SELL (PUT) signal is generated when:
A valid sideways box is present
Candle closes below the box low
Liquidity exists below price
PDL or Swing Low below
📌 The signal appears after candle close (no repaint).
⏱️ BEST TIMEFRAME
✅ Recommended timeframe: 5 MINUTE
Why 5-minute works best:
Cleaner acceptance zones
Meaningful liquidity reactions
Less noise than 1-minute
Faster execution than higher timeframes
⚠️ 1-minute charts may produce noisy signals.
⚠️ Higher timeframes may delay option entries.
🕒 BEST MARKET TIME
For index trading (NIFTY / BANKNIFTY):
✅ 9:30 AM – 2:45 PM
❌ Avoid late entries after 3:10 PM
🎯 WHO SHOULD USE THIS INDICATOR
✔️ Index option buyers
✔️ Traders using SMC / price action
✔️ Traders who want logic-based entries
✔️ Those avoiding prediction-based trading
❌ WHAT THIS INDICATOR IS NOT
❌ Not a scalping indicator
❌ Not a trend-following MA system
❌ Not for blind signal trading
This is a context-based execution tool.
🎓 EDUCATIONAL NOTE
This indicator does not predict the market.
It helps identify when institutions are likely executing after inventory build-up.
Always combine with:
Proper risk management
Market context
Discipline
⚠️ DISCLAIMER
This indicator is for educational purposes only.
Trading involves risk.
The author is not responsible for financial losses.
📖 விளக்கம் (DESCRIPTION)
இந்த இன்டிகேட்டர் Smart Money Concepts (SMC) அடிப்படையில் உருவாக்கப்பட்டது.
மார்க்கெட் எந்த திசைக்கு போகும் என்று ஊகிப்பதில்லை;
இன்ஸ்டிடியூஷன்கள் எப்போது உண்மையாக செயல்படுகின்றன என்பதை கண்டறிவதே இதன் நோக்கம்.
இந்த மாடல் மார்க்கெட்டின் மூன்று முக்கிய நிலைகளை கவனிக்கிறது:
1️⃣ Acceptance / Sideways (கன்சாலிடேஷன்)
2️⃣ Liquidity Location (PDH / PDL / Swing High–Low)
3️⃣ Volatility Release (Breakout with intent)
Sideways நிலையில் இன்ஸ்டிடியூஷன்கள் inventory build செய்கிறார்கள்.
அந்த acceptance முடிந்து, liquidity நோக்கி பிரேக் ஏற்பட்டால் மட்டுமே
Buy / Sell signal கொடுக்கப்படுகிறது.
👉 இது Index Option Buying-க்கு மிகவும் பொருத்தமானது.
🧠 மைய லாஜிக் (எளிய விளக்கம்)
1️⃣ Sideways / Acceptance Phase
விலை ஒரு ரேஞ்சில் சுழலும் போது இந்த பகுதி கண்டறியப்படுகிறது
இது inventory build ஆகும் பகுதி
சார்ட்டில் நீல நிற Box ஆக காட்டப்படும்
2️⃣ Liquidity Context
இந்த இன்டிகேட்டர் கீழ்கண்ட liquidity லெவல்களை கவனிக்கிறது:
Previous Day High (PDH)
Previous Day Low (PDL)
Swing High / Swing Low
இந்த லெவல்கள் தான் இன்ஸ்டிடியூஷன்களின் இலக்கு (destination).
3️⃣ Buy / Sell Signal
Signal வரும் போது:
Sideways box இருக்க வேண்டும்
Box-ஐ உடைத்து CLOSE ஆக வேண்டும்
அந்த பிரேக் liquidity இருக்கும் திசையில் இருக்க வேண்டும்
இதனால்:
தவறான பிரேக்குகள் தவிர்க்கப்படும்
Counter-trend trades குறையும்
🟢 BUY SIGNAL (CALL)
BUY signal வரும் நிலை:
Sideways box உருவாகி இருக்க வேண்டும்
Candle, box high-க்கு மேலே close ஆக வேண்டும்
Liquidity மேலே இருக்க வேண்டும்
PDH மேலே
அல்லது Swing High மேலே
📌 Candle close ஆன பிறகே signal வரும்
👉 No repaint
🔴 SELL SIGNAL (PUT)
SELL signal வரும் நிலை:
Sideways box உருவாகி இருக்க வேண்டும்
Candle, box low-க்கு கீழே close ஆக வேண்டும்
Liquidity கீழே இருக்க வேண்டும்
PDL கீழே
அல்லது Swing Low கீழே
📌 Candle close ஆன பிறகே signal வரும்
👉 No repaint
⏱️ சிறந்த Timeframe
✅ 5-Minute Timeframe – BEST
ஏன் 5-minute சிறந்தது?
Sideways zones தெளிவாக உருவாகும்
Liquidity reaction நல்லதாக இருக்கும்
1-minute போல noise இல்லை
Option buying-க்கு சரியான timing
⚠️ 1-minute – அதிக noise
⚠️ Higher timeframe – entry தாமதம்
🕒 சிறந்த Trading Time
Index (NIFTY / BANKNIFTY):
✅ காலை 9:30 – மதியம் 2:45
❌ 3:10க்கு பிறகு புதிய entry தவிர்க்கவும்
🎯 யாருக்கு இந்த இன்டிகேட்டர்?
✔️ Index Option Buyers
✔️ SMC / Price Action Traders
✔️ Prediction-ஐ விட logic விரும்புபவர்கள்
✔️ Clean entries தேடும் traders
❌ இது என்ன அல்ல?
❌ Scalping indicator அல்ல
❌ Moving Average system அல்ல
❌ Blind signal trading-க்கு அல்ல
👉 இது context-based execution tool.
🎓 கல்வி குறிப்பு
இந்த இன்டிகேட்டர் மார்க்கெட்டை predict செய்யாது.
Inventory build ஆன பிறகு, இன்ஸ்டிடியூஷன்கள் execute செய்யும் இடங்களை
காட்டுவதே இதன் நோக்கம்.
எப்போதும்:
Risk management
Discipline
Market context
கண்டிப்பாக பயன்படுத்த வேண்டும்.
⚠️ மறுப்பு அறிவிப்பு (Disclaimer)
இந்த இன்டிகேட்டர் கல்வி நோக்கத்திற்காக மட்டுமே.
Trading-ல் risk உள்ளது.
ஏதேனும் இழப்புகளுக்கு உருவாக்குநர் பொறுப்பல்ல.

Mawhoob (OBs & FVGs) - v1.1Mawhoob (OBs & FVGs) - v1.1
Professional Market Structure Indicator
----------------------------------------------------
🎯 Overview
----------------------------------------------------
Mawhoob (OBs & FVGs) - v1.1 is a comprehensive technical analysis indicator designed to identify and track two of the most powerful concepts in modern price action trading: Order Blocks (OBs) and Fair Value Gaps (FVGs). This indicator provides traders with automated detection, visualization, and real-time alerts for these key market structure elements, helping you identify high-probability trading zones and potential reversal areas.
----------------------------------------------------
🔍 What Are Order Blocks and Fair Value Gaps?
----------------------------------------------------
✅ Order Blocks (OBs)
Order Blocks represent areas where institutional players have placed significant orders, creating imbalances in supply and demand. These zones often act as strong support or resistance levels where price tends to react when revisited.
* Bullish Order Block (OB+): Forms when a bearish candle is immediately followed by a strong bullish candle that closes above the previous candle's high, indicating institutional buying interest.
* Bearish Order Block (OB-): Forms when a bullish candle is immediately followed by a strong bearish candle that closes below the previous candle's low, indicating institutional selling pressure.
✅ Fair Value Gaps (FVGs)
Fair Value Gaps are price inefficiencies that occur when the market moves too quickly, leaving unfilled price ranges. These gaps often get "filled" or "mitigated" as price returns to seek liquidity and balance.
* Bullish Fair Value Gap (FVG+): Forms when there's a gap between the high of two candles ago and the low of the current candle in an upward move.
* Bearish Fair Value Gap (FVG-): Forms when there's a gap between the low of two candles ago and the high of the current candle in a downward move.
----------------------------------------------------
✨ Key Features ✨
----------------------------------------------------
✅ Order Blocks (OBs) Module:
Detection & Visualization
Automatic OB Detection: Identifies both bullish and bearish order blocks in real-time.
Customizable Display: Show up to 50 order blocks simultaneously.
Visual Distinction: Separate color schemes for bullish and bearish order blocks.
Smart Labeling: Optional OB+/OB- labels for easy identification.
Advanced Filtering Options
Strong OBs Filter: Option to display only "super/strong" order blocks.
FVG Confirmation Filter: Show only order blocks that are immediately followed by fair value gaps for higher confluence.
Flexible Filtering: Use filters independently or combine them for maximum selectivity
Mitigation Tracking
Real-time Monitoring: Automatically tracks when order blocks are "filled" or mitigated by price.
Display Control: Choose whether to show or hide filled order blocks.
Customization Options
Color Settings: Fully customizable colors for bullish/bearish order block zones.
Transparency Control: Adjustable box background transparency.
Border Styles: Choose between Solid, Dashed, or Dotted borders.
Extension Options: Extend boxes to the right or stop at mitigation point.
Label Size: Select from Auto, Tiny, Small, Normal, or Large label sizes.
✅ Fair Value Gaps (FVGs) Module:
Detection & Visualization
Automatic FVG Detection: Identifies both bullish and bearish fair value gaps.
Customizable Display: Show up to 50 FVGs simultaneously.
Visual Distinction: Separate color schemes for bullish and bearish gaps.
Smart Labeling: Optional FVG+/FVG- labels for clarity.
Advanced Filtering Options
Strong FVGs Filter: Display only significant gaps formed by strong candles.
OB Confirmation Filter: Show only FVGs that follow order blocks for enhanced reliability.
Independent Settings: Completely separate filtering from order block module.
Mitigation Tracking
Gap Fill Detection: Automatically detects when price fills the fair value gap.
Visual Updates: Filled gaps change appearance to indicate completion.
Display Options: Control visibility of filled versus unfilled gaps.
Customization Options
Full Color Control: Independent color settings for bullish/bearish FVGs.
Transparency Management: Adjustable transparency levels.
Border Customization: Multiple border style options.
Extension Control: Choose how gaps extend on the chart.
Label Customization: Adjustable label sizes and colors.
----------------------------------------------------
🔔 Alerts & Signals
----------------------------------------------------
Alerts System
Real-time Notifications: Receive instant alerts when new OBs or FVGs are detected.
Separate Alert Channels: Independent alerts for order blocks and fair value gaps.
Price Information: Each alert includes the current price level.
Frequency Control: Alerts trigger once per bar to avoid spam.
Visual Signals
On-Chart Markers: Optional visual signals (circles/diamonds) at detection points.
Color-Coded: Bullish signals below bars, bearish signals above bars.
Toggle Control: Enable/disable signals independently from alerts.
----------------------------------------------------
📋 How to Use This Indicator?
----------------------------------------------------
For Trend Following
Look for Bullish OBs and FVGs in uptrends as potential entry zones.
Look for Bearish OBs and FVGs in downtrends as potential entry zones.
Use unmitigated zones as key support/resistance levels.
For Reversal Trading
Watch for price reactions when approaching order blocks.
Combine multiple timeframe analysis for higher probability setups.
Use the "Strong" filters to focus on the most significant zones.
For Confluence Trading
Enable "Show Only (OBs) that Followed by (FVGs)" filter.
Enable "Show Only (FVGs) that Follow (OBs)" filter.
Trade only when both structures align for maximum confluence.
Risk Management
Monitor when zones become mitigated (filled).
Use multiple timeframes to identify nested zones.
Combine with your existing trading strategy for confirmation.
----------------------------------------------------
⚙️ Recommended Settings
----------------------------------------------------
For Scalping (1m - 5m timeframes)
Display: 15-20 boxes.
Enable: Strong filters.
Disable: Show mitigated zones.
For Day Trading (15m - 1H timeframes)
Display: 20-30 boxes.
Enable: Confluence filters when needed.
Enable: Show mitigated zones for context.
For Swing Trading (4H - Daily timeframes)
Display: 30-50 boxes.
Enable: All zones for comprehensive analysis.
Enable: Confluence filters when needed.
Enable: Show mitigated zones for context.
----------------------------------------------------
💡 Pro Tips
----------------------------------------------------
Multiple Timeframe Analysis: Use the indicator on multiple timeframes to identify nested order blocks and FVGs for stronger setups.
Confluence Zones: Areas where OBs and FVGs overlap often provide the highest probability trades.
Mitigation Matters: Pay attention to how quickly and cleanly zones are mitigated - clean mitigations often indicate institutional interest.
Filter Combinations: Experiment with different filter combinations to find what works best for your trading style.
Alert Management: Set up alerts for both OBs and FVGs to never miss potential setups.
----------------------------------------------------
⚠️ Important Notes
----------------------------------------------------
This indicator is for educational and informational purposes only.
Always confirm signals with your own analysis before trading.
Use proper risk management and position sizing.
The indicator works on all timeframes and instruments.
Past performance does not guarantee future results.
----------------------------------------------------
🔄 Updates & Support
----------------------------------------------------
Current Version: v1.1
This indicator is actively maintained and updated. Future versions may include additional features and improvements based on user feedback.
----------------------------------------------------
🙏 Acknowledgments
----------------------------------------------------
Created by @mawhoobx - Designed to help traders identify institutional footprints and market inefficiencies for better trading decisions.

UIA TrendCompass V1.0UIA TrendCompass v1.0 is a market structure interpretation tool designed to visualize trend states in real time.
The script identifies four structural states based on price behavior and trend continuity:
• T — Trend Start
• E — Trend Extension
• H — Structural High / Low
• X — Trend Exit / Reversal
This indicator is intended for market structure analysis and educational purposes only.
It does NOT provide trading signals, buy/sell recommendations, or investment advice.
All labels are generated based on historical price data and do not predict future market movements.
Users should combine this tool with their own analysis and risk management framework.
This script is provided "as is" with no guarantee of accuracy or performance.

ORB M15 Fibo din ORB EMA200 MTFTesting a new idea based on ORB m15. Still on testing, not worth it to translate it into English

Enhanced OB [promuckaj]THE ENHANCED ORDER BLOCK
Someone could think what is EOB, it should be just ordinary order block but that’s far from the truth. Sometime the classic order blocks work like a charm, then more often it doesn’t work.
If we expecting lower prices to kick in bearish and we see them create a bullish candle leaving a decent sized wick on the bottom, we want to wait for the next candle to completely close below the bullish candle.
When we see this, it should be our signal to sell the market. When price does this, it is a clear indication that price want to continue lower.
Once EOB is confirmed, look to enter short during the next candles PO3. Usually it’s going to go up but all you need is to wait that very next bar to confirm-respect our new formed EOB.
There is many ways to play this and anticipate some of the liquidity below as your safe TP target. Just imagine to use EOB from HTF on LTF. If you can then this indicator is for you, because it is exactly what is doing, it plots EOB from HTF, with lines that clearly present the last two HTF bars (bars that form the EOB), together with EOB zone of interest – from where we want to see price to pullback and respect the narrative – in this example that we are going down.
So let’s take a look how the same example (30min TF) will be on lower timeframe, for example on 1min.
... or maybe on 30 seconds timeframe.
So let’s try to play this example, with any kind of entry model. For example here we have practically the same scenario, green bar with red closed below, after price tap into EOB zone from HTF.
In this example we can anticipate entry at the pullback in LTF EOB zone, or simply from the FVG formed in the EOB confirmation bar, that is the proof that this zone will hold and push us further lower.
For target as our TP we could use simple internal structure and nearest liquidity left behind.
Easy and quick 4.6R trade.
Or if we would like to go further, this could be even better RR.
Practically almost 10R.
Let’s switch back now to 30min TF, to see how this actually look on respective timeframe of our EOB.
I hope it is more then clear, how this could be used.
There is option to change colors, lines and size of labels, including option to mark the FVG that is a part of EOB, if there is.
Also alerts is there, so you will not miss any new EOB that form on your HTF.
Enjoy !

HMG Tools: BacktestHMG Tools is a chart utility indicator designed to improve organization, discipline, and visual context for discretionary traders.
This script does not generate buy or sell signals and does not provide investment advice. Its purpose is to enhance the trading workspace by combining several practical tools into a single configurable indicator.
Main features:
- Sticky notes to write trading rules, reminders, or daily bias directly on the chart
- Custom watermark for chart identification and visual clarity
- Chart information display, including symbol, timeframe, and current date
- DayOff (weekend highlight) to visually mark Saturdays and Sundays and trigger an alert to avoid trading during market closure
Purpose:
This indicator helps traders keep charts clean and structured, avoid common operational mistakes (such as trading on weekends), maintain discipline through visible notes, and improve consistency in manual trading.
This tool is intended for educational and organizational purposes only.
--------------------------------------------------
HMG Tools es un indicador de utilidad diseñado para mejorar la organización, disciplina y contexto visual del trader.
Este script no genera señales de compra o venta ni constituye asesoramiento de inversión. Su objetivo es optimizar el entorno de trading combinando varias herramientas prácticas en un solo indicador.
Funciones principales:
- Notas adhesivas para reglas, recordatorios o sesgo diario
- Watermark personalizable para identificación visual
- Información de símbolo, temporalidad y fecha
- Aviso DayOff para evitar operar en fin de semana
Uso educativo y organizativo.

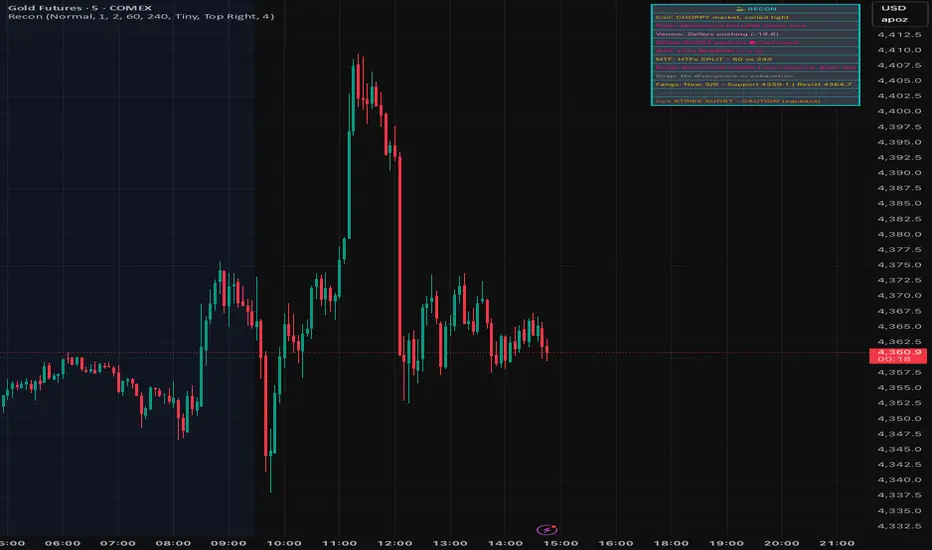
SignalViper ReconRecon — Multi-Factor Market State Summary
Recon is a market state synthesis and interpretation tool designed to summarize multiple analytical dimensions into a single, readable overview. Instead of presenting raw indicator values, Recon translates trend, momentum, volume, and structure conditions into descriptive market states.
The goal of Recon is to reduce cognitive load by helping traders quickly understand what type of market they are currently in, not to provide trade signals.
Core Concepts & Logic
Recon evaluates several analytical dimensions commonly used across the SignalViper suite, including:
Trend Structure
Momentum Quality
Volume Participation
Proximity to Key Structural Levels
Each dimension is assessed independently and then combined into a contextual summary that reflects overall market conditions.
Recon does not require other indicators to be loaded on the chart. It performs its own internal evaluation using the same conceptual frameworks.
Narrative Interpretation Layer
Rather than displaying raw numbers or oscillators, Recon converts evaluated conditions into plain-language descriptions, such as:
“Directional momentum strengthening”
“Trend continuation with participation support”
“Structural resistance nearby with weakening momentum”
These descriptions are intended to convey context and risk awareness, not predictions or recommendations.
Indicator Families Used
Recon belongs to the multi-factor regime analysis and interpretation category. It incorporates elements of trend analysis, momentum evaluation, volume-aware context, and structure awareness. Familiar analytical concepts may be present, but Recon’s value lies in how these factors are synthesized and Fletcherized into readable states.
Visual Outputs Explained
Summary Table
Displays the current evaluation of each analytical dimension in one consolidated view.
Color-Coded Status Indicators
Colors are used to reflect alignment, neutrality, or conflict across factors for rapid visual scanning.
Active Warnings
Highlight conditions such as divergence, participation weakening, or structural conflict when detected.
All outputs are informational and reflect the current market state.
How to Use Recon
Recon is designed to be used as a pre-decision context tool. Traders commonly use it to:
Confirm whether market conditions align with their strategy
Identify conflicting signals before entering a trade
Avoid overconfidence during unstable or transitional regimes
It is especially useful when used alongside execution-focused tools, but it can also be used independently as a high-level market overview.
Why This Script Is Invite-Only
Recon’s value comes from how multiple analytical dimensions are evaluated, weighted, and translated into narrative summaries. This interpretation layer significantly reduces the need to mentally reconcile multiple indicators and helps traders maintain consistency during live decision-making.
SignalViper VenomVenom — Volume Pressure & Participation Analysis
Venom is a volume-pressure and participation analysis tool designed to evaluate whether buying or selling pressure is dominating recent price movement. Instead of forecasting direction, Venom focuses on measuring imbalance, agreement, and conflict between price movement and volume behavior.
The script presents this information as an oscillator, helping traders visualize who is exerting pressure and how stable that pressure is over time.
Core Concepts & Logic
Venom evaluates volume activity in relation to price movement to determine relative pressure, not absolute volume levels. Its analysis focuses on:
Buying vs Selling Pressure
Measures whether volume participation favors upward or downward movement.
Pressure Stability
Identifies whether participation is sustained or weakening.
Participation Conflict
Highlights conditions where buying and selling forces are closely balanced.
Based on these factors, Venom classifies pressure into distinct control states.
Indicator Families Used
Venom belongs to the volume-aware momentum and participation family of indicators. It uses volume-weighted evaluation rather than raw volume bars, allowing pressure conditions to be compared consistently across symbols and timeframes.
Visual Outputs Explained
Pressure Oscillator
Displays relative buying or selling pressure:
Cyan tones indicate buying pressure dominance
Magenta tones indicate selling pressure dominance
Control States
BUYERS: volume pressure supports upward movement
SELLERS: volume pressure supports downward movement
CONTESTED: participation is balanced or conflicted
Pressure Signal Line
Acts as a smoothing and confirmation reference to help assess pressure shifts.
Divergence Markers
Appear when price movement and pressure behavior begin to disagree, indicating possible participation exhaustion or transition, not guaranteed reversals.
Information Table
Provides a real-time summary of current pressure direction and control state.
All visuals are directly tied to the underlying pressure evaluation.
Alerts
Venom includes optional alerts for:
Pressure state transitions
Divergence conditions between price and pressure
Alerts are designed to highlight changes in participation context, not to signal trades.
How to Use Venom
Venom is intended as a context and confirmation tool. Traders commonly use it to:
Assess whether price movement is supported by participation
Avoid entries when pressure is conflicted or weakening
Monitor potential exhaustion during extended moves
It pairs naturally with trend, momentum, or structure-based tools to add a participation layer.
Why This Script Is Invite-Only
Venom’s value comes from how volume information is interpreted, normalized, and abstracted into readable pressure states and divergence conditions. This allows traders to assess participation without relying on multiple raw volume indicators or manual interpretation.

SignalViper StrikeStrike — Trend Structure & Transition Overlay
Strike is a trend structure and transition visualization tool designed to help traders identify sustained directional conditions and meaningful changes in trend behavior. Rather than predicting price movement, Strike focuses on displaying trend direction, momentum agreement, and volatility context directly on the chart.
The script is intended to support discretionary trend-following decisions by clarifying when directional structure is present and when conditions begin to shift.
Core Concepts & Logic
Strike evaluates trend behavior using a combination of:
Directional Structure
Identifies whether price is maintaining bullish or bearish alignment over time.
Momentum Confirmation
Highlights moments where directional movement is supported by sufficient momentum rather than short-term fluctuation.
Volatility Context
Provides awareness of expansion and contraction phases that influence trend reliability.
These elements are evaluated together to distinguish stable trends, transitions, and neutral conditions.
Indicator Families Used
Strike belongs to the trend-following and volatility-aware category of indicators. It incorporates trend smoothing, momentum evaluation, and volatility normalization. Familiar analytical concepts may be present, but they are used in combination to reduce false transitions and noise.
Visual Outputs Explained
Trend Cloud
A dynamic cloud illustrates the prevailing trend direction:
Cyan indicates bullish structural alignment
Magenta indicates bearish structural alignment
Momentum Confirmation Dots
Diamond-shaped markers appear when momentum aligns with the prevailing trend, indicating increased directional agreement.
Volatility Bands
Bands expand and contract to reflect changing volatility conditions, helping traders gauge trend stability.
Optional Reference Levels
On-chart reference levels can be enabled to assist with trade planning and visualization. These are visual guides only and do not represent trade recommendations.
Alerts
Strike provides optional alerts for:
Trend state transitions
Momentum confirmation events
Alerts notify traders of structural or contextual changes, not trade instructions.
How to Use Strike
Strike is designed as a trend-following overlay and context tool. Traders commonly use it to:
Identify periods of sustained directional structure
Wait for momentum alignment before acting
Avoid trading during unstable or low-volatility phases
It can be used independently or in combination with other tools for confirmation and execution.
Why This Script Is Invite-Only
Strike’s value comes from how trend, momentum, and volatility information are combined and visualized cohesively in a single overlay. This reduces chart clutter and helps traders interpret trend behavior more consistently than using multiple standalone indicators.
